| | |
| | |

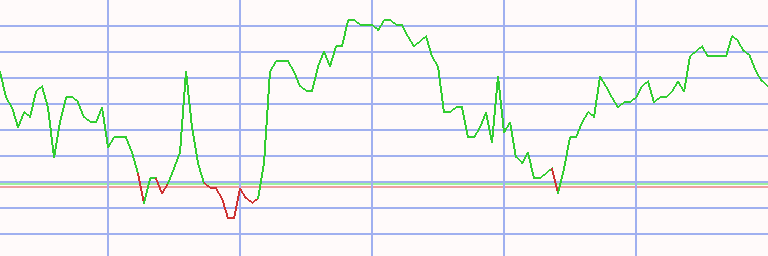
Assessment - STOXX Europe 50 in Dollar - 18/12/23 - RS = 22
⇐
| |
|
instrument |
freshest |
⇓ Δday |
18/12/23 |
⇓ Δwk |
17/07/23 |
prc diff |
⇓ Δ22 |
|
⇓∅-RS |
| |  |
 |
 |
|
|
 |
Stoxx 50 |
4,668.690 |
12/08/24 |
-0.16 |
4,381.930 |
|
4,410.029 |
-28.099 |
-0.64 |
|
3.36 |
| | |
|
|
|
L |
|
ABB |
51.732 |
12/08/24 |
0.55 |
42.025 |
|
39.395 |
2.630 |
6.68 |
|
17.57 |
| | |
|
|
|
S |
|
Air Liquide |
174.422 |
12/08/24 |
-0.79 |
189.812 |
|
179.147 |
10.665 |
5.95 |
|
12.35 |
| | |
|
|
|
|
|
Airbus |
143.751 |
12/08/24 |
-0.45 |
152.928 |
|
150.023 |
2.905 |
1.94 |
|
12.77 |
| | |
|
|
|
|
|
Allianz |
275.013 |
12/08/24 |
|
263.729 |
|
236.181 |
27.548 |
11.66 |
|
12.29 |
| | |
|
|
|
|
|
Anheuser-Busch InBev |
59.323 |
12/08/24 |
-0.47 |
62.934 |
|
57.629 |
5.304 |
9.20 |
|
6.95 |
| | |
|
|
|
|
|
ASML |
843.202 |
12/08/24 |
0.08 |
708.436 |
|
746.857 |
-38.421 |
-5.14 |
|
9.00 |
| | |
|
|
|
L |
|
AstraZeneca |
16,031.537 |
12/08/24 |
0.63 |
12,664.663 |
|
13,340.535 |
-675.872 |
-5.07 |
|
-7.23 |
| | |
|
|
|
|
|
Axa |
34.766 |
12/08/24 |
-0.77 |
32.305 |
|
29.730 |
2.575 |
8.66 |
|
7.64 |
| | |
|
|
|
|
|
Banco Santander |
4.394 |
12/08/24 |
-0.24 |
4.235 |
|
3.875 |
0.361 |
9.31 |
|
16.09 |
| | |
|
|
|
S |
|
BASF |
44.363 |
12/08/24 |
-0.22 |
48.823 |
|
50.798 |
-1.975 |
-3.89 |
|
-2.45 |
| | |
|
|
|
L |
|
BAT |
3,513.641 |
12/08/24 |
|
2,875.767 |
|
3,299.167 |
-423.400 |
-12.83 |
|
-15.61 |
| | |
|
|
|
L |
|
Bayer |
27.899 |
12/08/24 |
-0.04 |
33.842 |
|
56.427 |
-22.585 |
-40.03 |
|
-36.42 |
| | |
|
|
|
|
|
BNP Paribas |
63.675 |
12/08/24 |
|
65.750 |
|
63.719 |
2.030 |
3.19 |
|
5.02 |
| | |
|
|
|
|
|
BP |
551.445 |
12/08/24 |
1.35 |
586.130 |
|
591.692 |
-5.562 |
-0.94 |
|
-4.83 |
| | |
|
|
|
|
|
Deutsche Post |
38.732 |
12/08/24 |
-0.36 |
49.484 |
|
51.489 |
-2.005 |
-3.89 |
|
11.43 |
| | |
|
|
|
L |
|
Deutsche Telekom |
26.577 |
12/08/24 |
0.49 |
24.487 |
|
22.193 |
2.293 |
10.33 |
|
10.43 |
| | |
|
|
|
S |
|
Diageo |
3,075.220 |
12/08/24 |
1.03 |
3,524.304 |
|
4,378.181 |
-853.877 |
-19.50 |
|
-15.21 |
| | |
|
|
|
|
|
Enel |
6.919 |
12/08/24 |
0.44 |
7.004 |
|
7.000 |
0.004 |
0.05 |
|
11.15 |
| | |
|
|
|
|
|
EssilorLuxottica |
222.783 |
12/08/24 |
-0.58 |
196.905 |
|
196.720 |
0.185 |
0.09 |
|
5.88 |
| | |
|
|
|
|
|
Glencore |
514.627 |
12/08/24 |
1.27 |
551.068 |
|
593.327 |
-42.258 |
-7.12 |
|
-4.90 |
| | |
|
|
|
|
|
GSK |
1,971.954 |
12/08/24 |
0.42 |
1,815.653 |
|
1,724.591 |
91.062 |
5.28 |
|
2.48 |
| | |
|
|
|
|
|
Hermes International |
2,155.828 |
12/08/24 |
-0.50 |
2,147.016 |
|
2,148.548 |
-1.532 |
-0.07 |
|
9.74 |
| | |
|
|
|
L |
|
HSBC |
807.724 |
12/08/24 |
0.22 |
773.227 |
|
808.149 |
-34.922 |
-4.32 |
|
4.46 |
| | |
|
|
|
L |
|
Iberdrola |
13.009 |
12/08/24 |
0.29 |
12.628 |
|
12.607 |
0.021 |
0.17 |
|
5.58 |
| |
|
instrument |
freshest |
⇓ Δday |
18/12/23 |
⇓ Δwk |
17/07/23 |
prc diff |
⇓ Δ22 |
|
⇓∅-RS |
| | |
|
|
|
|
|
ING Groep |
16.370 |
12/08/24 |
0.21 |
14.592 |
|
14.483 |
0.109 |
0.75 |
|
9.97 |
| | |
|
|
|
|
|
L´Oreal |
404.782 |
12/08/24 |
-1.59 |
477.001 |
|
465.114 |
11.887 |
2.56 |
|
10.80 |
| | |
|
|
|
S |
|
LVMH |
682.536 |
12/08/24 |
-0.14 |
795.271 |
|
965.172 |
-169.902 |
-17.60 |
|
-5.60 |
| | |
|
|
|
S |
|
Mercedes-Benz |
61.773 |
12/08/24 |
-0.57 |
67.759 |
|
81.483 |
-13.724 |
-16.84 |
|
-6.85 |
| | |
|
|
|
L |
|
Münchener Rück |
472.004 |
12/08/24 |
1.01 |
422.353 |
|
376.855 |
45.498 |
12.07 |
|
14.65 |
| | |
|
|
|
S |
|
National Grid |
1,227.328 |
12/08/24 |
-0.04 |
1,334.080 |
|
1,330.784 |
3.296 |
0.25 |
|
4.15 |
| | |
|
|
|
L |
|
Nestlé |
100.759 |
12/08/24 |
-0.40 |
112.558 |
|
121.752 |
-9.194 |
-7.55 |
|
-5.41 |
| | |
|
|
|
L |
|
Novartis |
109.966 |
12/08/24 |
0.16 |
97.281 |
|
98.713 |
-1.433 |
-1.45 |
|
1.47 |
| | |
|
|
|
|
|
Novo Nordisk |
128.702 |
12/08/24 |
-2.80 |
96.458 |
|
80.836 |
15.622 |
19.33 |
|
17.77 |
| | |
|
|
|
L |
|
Prosus |
35.304 |
12/08/24 |
1.77 |
32.423 |
|
35.247 |
-2.824 |
-8.01 |
|
-1.47 |
| | |
|
|
|
|
|
Reckitt Benckiser |
5,243.492 |
12/08/24 |
|
6,751.309 |
|
7,546.558 |
-795.248 |
-10.54 |
|
-7.37 |
| | |
|
|
|
|
|
RELX |
4,429.371 |
12/08/24 |
0.57 |
3,910.039 |
|
3,337.750 |
572.290 |
17.15 |
|
21.11 |
| | |
|
|
|
L |
|
Richemont |
145.728 |
12/08/24 |
1.22 |
133.508 |
|
160.298 |
-26.791 |
-16.71 |
|
-7.62 |
| | |
|
|
|
|
|
Rio Tinto |
6,199.363 |
12/08/24 |
0.56 |
6,879.261 |
|
6,651.957 |
227.303 |
3.42 |
|
4.48 |
| | |
|
|
|
L |
|
Roche |
315.781 |
12/08/24 |
0.25 |
289.068 |
|
311.762 |
-22.694 |
-7.28 |
|
-2.61 |
| | |
|
|
|
|
|
Safran |
206.555 |
12/08/24 |
-0.18 |
177.840 |
|
153.933 |
23.907 |
15.53 |
|
17.62 |
| | |
|
|
|
|
|
Sanofi |
102.816 |
12/08/24 |
-0.60 |
94.358 |
|
105.798 |
-11.440 |
-10.81 |
|
-7.37 |
| | |
|
|
|
|
|
SAP |
203.439 |
12/08/24 |
-0.33 |
158.345 |
|
144.270 |
14.075 |
9.76 |
|
22.70 |
| | |
|
|
|
|
|
Schneider Electric |
227.028 |
12/08/24 |
0.38 |
189.747 |
|
180.270 |
9.477 |
5.26 |
|
14.06 |
| | |
|
|
|
|
|
Shell |
35.492 |
12/08/24 |
0.93 |
32.042 |
|
30.596 |
1.446 |
4.73 |
|
4.49 |
| | |
|
|
|
|
|
Siemens |
168.941 |
12/08/24 |
0.01 |
176.572 |
|
168.450 |
8.121 |
4.82 |
|
14.33 |
| | |
|
|
|
|
|
TotalEnergies |
66.330 |
12/08/24 |
0.60 |
66.599 |
|
57.259 |
9.340 |
16.31 |
|
6.56 |
| | |
|
|
|
|
|
UBS |
28.248 |
12/08/24 |
0.44 |
28.463 |
|
21.075 |
7.389 |
35.06 |
|
30.52 |
| | |
|
|
|
L |
|
Unilever Plc |
5,913.354 |
12/08/24 |
-0.34 |
4,741.095 |
|
5,257.086 |
-515.991 |
-9.82 |
|
-6.65 |
| | |
|
|
|
S |
|
Vinci |
110.317 |
12/08/24 |
-0.77 |
124.772 |
|
118.562 |
6.209 |
5.24 |
|
9.91 |
| |
|
instrument |
freshest |
⇓ Δday |
18/12/23 |
⇓ Δwk |
17/07/23 |
prc diff |
⇓ Δ22 |
|
⇓∅-RS |
| | |
|
|
|
L |
|
Zurich Insurance |
528.234 |
12/08/24 |
0.85 |
511.183 |
|
474.618 |
36.565 |
7.70 |
|
7.38 |
| Europe 50 - 50 out of 50 instruments rated - 18/12/23 / 17/07/23 - 29 did rise, Market-Ratio(22) in USD = 58.00 % |
Technical Chart
Transactions STOXX Europe 50 in Dollar * A22 - 28/27 (1)
|
⇐ |
| |
| L/S | date buy | date sell | days | | instrument | spl | pieces | | prc buy | prc sell | ps short | prc diff | d % | asset | yield | |
| 2/01/06 |
12/06/06 |
161 |
|
- cash - |
| short |
12/06/06 |
26/06/06 |
14 |
|
|
|
Vodafone |
100 |
4,624 |
|
2.162 |
2.094 |
2.232 |
0.070 |
3 |
10,324 |
129 |
|
| long |
26/06/06 |
21/01/08 |
574 |
|
|
|
ABB |
100 |
845 |
|
12.207 |
21.665 |
|
9.458 |
77 |
18,315 |
44 |
|
| short |
21/01/08 |
21/04/08 |
91 |
|
|
|
UBS |
100 |
499 |
|
36.684 |
35.295 |
38.128 |
1.444 |
4 |
19,036 |
17 |
|
| long |
21/04/08 |
28/04/08 |
7 |
|
|
|
Rio Tinto |
100 |
184 |
|
102.938 |
102.115 |
|
-0.823 |
-1 |
18,885 |
-34 |
|
| short |
28/04/08 |
23/06/08 |
56 |
|
|
|
UBS |
100 |
537 |
|
35.126 |
21.301 |
57.924 |
22.798 |
65 |
31,127 |
2,505 |
|
| long |
23/06/08 |
30/06/08 |
7 |
|
|
|
Rio Tinto |
100 |
319 |
|
97.522 |
99.043 |
|
1.521 |
2 |
31,612 |
124 |
|
| short |
30/06/08 |
11/08/08 |
42 |
|
|
|
UBS |
100 |
1,501 |
|
21.051 |
21.417 |
20.684 |
-0.367 |
-2 |
31,062 |
-14 |
|
| long |
11/08/08 |
8/09/08 |
28 |
|
|
|
AstraZeneca |
100 |
626 |
|
49.578 |
46.100 |
|
-3.478 |
-7 |
28,885 |
-61 |
|
| short |
8/09/08 |
30/03/09 |
203 |
|
|
|
UBS |
100 |
1,331 |
|
21.687 |
8.860 |
53.082 |
31.395 |
145 |
70,671 |
400 |
|
| long |
30/03/09 |
6/04/09 |
7 |
|
|
|
AstraZeneca |
100 |
2,099 |
|
33.664 |
35.243 |
|
1.580 |
5 |
73,987 |
993 |
|
| short |
6/04/09 |
13/04/09 |
7 |
|
|
|
Lloyds Bank |
100 |
62,558 |
|
1.183 |
1.290 |
1.076 |
-0.107 |
-9 |
67,281 |
-99 |
|
| long |
13/04/09 |
30/08/10 |
504 |
|
|
|
Deutsche Bank |
100 |
1,697 |
|
39.624 |
49.221 |
|
9.597 |
24 |
83,568 |
17 |
|
| short |
30/08/10 |
6/09/10 |
7 |
|
|
|
BP |
100 |
14,139 |
|
5.910 |
6.281 |
5.540 |
-0.370 |
-6 |
78,331 |
-97 |
|
| long |
6/09/10 |
8/08/11 |
336 |
|
|
|
Novo Nordisk |
100 |
8,928 |
|
8.773 |
10.958 |
|
2.184 |
25 |
97,832 |
27 |
|
| short |
8/08/11 |
19/12/11 |
133 |
|
|
|
Lloyds Bank |
100 |
181,632 |
|
0.539 |
0.365 |
0.795 |
0.257 |
48 |
144,470 |
191 |
|
| long |
19/12/11 |
20/10/14 |
1036 |
|
|
|
Roche |
100 |
853 |
|
169.180 |
284.848 |
|
115.668 |
68 |
243,135 |
20 |
|
| short |
20/10/14 |
10/11/14 |
21 |
|
|
|
Deutsche Bank |
100 |
8,817 |
|
27.573 |
26.790 |
28.380 |
0.806 |
3 |
250,246 |
65 |
|
| long |
10/11/14 |
24/08/15 |
287 |
|
|
|
Novartis |
100 |
3,253 |
|
76.924 |
80.211 |
|
3.287 |
4 |
260,937 |
5 |
|
| short |
24/08/15 |
26/10/15 |
63 |
|
|
|
Rio Tinto |
100 |
7,676 |
|
33.991 |
38.176 |
29.805 |
-4.185 |
-12 |
228,811 |
-53 |
|
| long |
26/10/15 |
14/12/15 |
49 |
|
|
|
SAP |
100 |
2,951 |
|
77.515 |
76.278 |
|
-1.237 |
-2 |
225,160 |
-11 |
|
| short |
14/12/15 |
28/12/15 |
14 |
|
|
|
Rio Tinto |
100 |
8,049 |
|
27.973 |
29.853 |
26.094 |
-1.879 |
-7 |
210,033 |
-84 |
|
| long |
28/12/15 |
4/01/16 |
7 |
|
|
|
SAP |
100 |
2,628 |
|
79.913 |
76.445 |
|
-3.468 |
-4 |
200,920 |
-90 |
|
| short |
4/01/16 |
25/01/16 |
21 |
|
|
|
Rio Tinto |
100 |
7,175 |
|
28.001 |
22.920 |
34.208 |
6.207 |
22 |
245,457 |
3,146 |
|
| long |
25/01/16 |
28/03/16 |
63 |
|
|
|
SAP |
100 |
3,112 |
|
78.851 |
79.305 |
|
0.455 |
1 |
246,872 |
3 |
|
| short |
28/03/16 |
18/04/16 |
21 |
|
|
|
Credit Suisse |
100 |
17,232 |
|
14.326 |
15.076 |
13.577 |
-0.750 |
-5 |
233,956 |
-61 |
|
| L/S | date buy | date sell | days | | instrument | spl | pieces | | prc buy | prc sell | ps short | prc diff | d % | asset | yield | | | long |
18/04/16 |
25/04/16 |
7 |
|
|
|
BAT |
100 |
3,828 |
|
61.117 |
60.290 |
|
-0.827 |
-1 |
230,790 |
-51 |
|
| short |
25/04/16 |
16/05/16 |
21 |
|
|
|
Credit Suisse |
100 |
15,262 |
|
15.121 |
13.694 |
16.697 |
1.576 |
10 |
254,845 |
460 |
|
| long |
16/05/16 |
5/03/18 |
658 |
|
|
|
BAT |
100 |
4,204 |
|
60.615 |
58.436 |
|
-2.179 |
-4 |
245,683 |
-2 |
|
| short |
5/03/18 |
23/04/18 |
49 |
|
|
|
Imperial Brands |
100 |
6,877 |
|
35.725 |
33.360 |
38.257 |
2.532 |
7 |
263,096 |
67 |
|
| long |
23/04/18 |
15/10/18 |
175 |
|
|
|
LVMH |
100 |
766 |
|
343.022 |
302.075 |
|
-40.946 |
-12 |
231,731 |
-23 |
|
| short |
15/10/18 |
12/11/18 |
28 |
|
|
|
Intesa Sanpaolo |
100 |
97,868 |
|
2.368 |
2.204 |
2.544 |
0.176 |
7 |
248,929 |
154 |
|
| long |
12/11/18 |
10/12/18 |
28 |
|
|
|
AstraZeneca |
100 |
3,097 |
|
80.356 |
75.459 |
|
-4.897 |
-6 |
233,763 |
-56 |
|
| short |
10/12/18 |
11/02/19 |
63 |
|
|
|
Bayer |
100 |
3,383 |
|
69.083 |
77.020 |
61.146 |
-7.937 |
-11 |
206,912 |
-51 |
|
| long |
11/02/19 |
2/03/20 |
385 |
|
|
|
Roche |
100 |
762 |
|
271.318 |
328.913 |
|
57.595 |
21 |
250,799 |
20 |
|
| short |
2/03/20 |
22/06/20 |
112 |
|
|
|
Anheuser-Busch InBev |
100 |
4,319 |
|
58.062 |
50.637 |
66.575 |
8.514 |
15 |
287,570 |
56 |
|
| long |
22/06/20 |
29/06/20 |
7 |
|
|
|
ASML |
100 |
791 |
|
363.356 |
361.860 |
|
-1.496 |
0 |
286,387 |
-19 |
|
| short |
29/06/20 |
27/07/20 |
28 |
|
|
|
Airbus |
100 |
4,025 |
|
71.148 |
72.847 |
69.449 |
-1.699 |
-2 |
279,547 |
-27 |
|
| long |
27/07/20 |
20/06/22 |
693 |
|
|
|
ASML |
100 |
733 |
|
381.117 |
481.315 |
|
100.198 |
26 |
352,992 |
13 |
|
| short |
20/06/22 |
27/06/22 |
7 |
|
|
|
Adyen |
100 |
270 |
|
1,303.788 |
1,504.988 |
1,102.587 |
-201.201 |
-15 |
298,668 |
-100 |
|
| long |
27/06/22 |
11/07/22 |
14 |
|
|
|
BAT |
100 |
6,802 |
|
43.906 |
40.282 |
|
-3.624 |
-8 |
274,015 |
-89 |
|
| short |
11/07/22 |
25/07/22 |
14 |
|
|
|
Adidas |
100 |
1,669 |
|
164.147 |
179.961 |
148.332 |
-15.815 |
-10 |
247,620 |
-93 |
|
| long |
25/07/22 |
5/09/22 |
42 |
|
|
|
Novo Nordisk |
100 |
4,308 |
|
57.470 |
52.299 |
|
-5.171 |
-9 |
225,344 |
-56 |
|
| short |
5/09/22 |
7/11/22 |
63 |
|
|
|
Adidas |
100 |
1,561 |
|
144.277 |
115.283 |
180.562 |
36.286 |
25 |
281,986 |
267 |
|
| long |
7/11/22 |
23/10/23 |
350 |
|
|
|
BP |
100 |
48,762 |
|
5.783 |
6.513 |
|
0.730 |
13 |
317,581 |
13 |
|
| short |
23/10/23 |
30/10/23 |
7 |
|
|
|
Adyen |
100 |
436 |
|
727.757 |
671.835 |
788.335 |
60.578 |
8 |
343,992 |
6,366 |
|
| long |
30/10/23 |
12/08/24 |
287 |
|
|
|
Novo Nordisk |
100 |
3,569 |
|
96.364 |
128.428 |
|
32.064 |
33 |
458,430 |
44 |
|
| accum | 12/06/06 |
12/08/24 | 7307 |
days out of 7468 invested (98%) |
4,484 |
458,430 |
21 |
|
Instrument Related Contribution
| instrument | L/S | date buy | date sell | days | prc buy | prc sell | ps short | prc diff | d % | | | total |
| UBS | short | 21/01/08 | 21/04/08 | 91 | 36.68 | 35.30 | 38.13 | 1.44 | 3.94 | | | |
| | short | 28/04/08 | 23/06/08 | 56 | 35.13 | 21.30 | 57.92 | 22.80 | 64.90 | | | |
| | short | 30/06/08 | 11/08/08 | 42 | 21.05 | 21.42 | 20.68 | -0.37 | -1.74 | | | |
| | short | 8/09/08 | 30/03/09 | 203 | 21.69 | 8.86 | 53.08 | 31.39 | 144.76 | | | 312.20 |
| Roche | long | 19/12/11 | 20/10/14 | 1036 | 169.18 | 284.85 | | 115.67 | 68.37 | | | |
| | long | 11/02/19 | 2/03/20 | 385 | 271.32 | 328.91 | | 57.60 | 21.23 | | | 104.11 |
| ABB | long | 26/06/06 | 21/01/08 | 574 | 12.21 | 21.66 | | 9.46 | 77.48 | | | 77.48 |
| Novo Nordisk | long | 6/09/10 | 8/08/11 | 336 | 8.77 | 10.96 | | 2.18 | 24.90 | | | |
| | long | 25/07/22 | 5/09/22 | 42 | 57.47 | 52.30 | | -5.17 | -9.00 | | | |
| | long | 30/10/23 | 12/08/24 | 287 | 96.36 | 128.43 | | 32.06 | 33.27 | | | 51.48 |
| Lloyds Bank | short | 6/04/09 | 13/04/09 | 7 | 1.18 | 1.29 | 1.08 | -0.11 | -9.06 | | | |
| | short | 8/08/11 | 19/12/11 | 133 | 0.54 | 0.36 | 0.80 | 0.26 | 47.67 | | | 34.29 |
| Deutsche Bank | long | 13/04/09 | 30/08/10 | 504 | 39.62 | 49.22 | | 9.60 | 24.22 | | | |
| | short | 20/10/14 | 10/11/14 | 21 | 27.57 | 26.79 | 28.38 | 0.81 | 2.92 | | | 27.85 |
| ASML | long | 22/06/20 | 29/06/20 | 7 | 363.36 | 361.86 | | -1.50 | -0.41 | | | |
| | long | 27/07/20 | 20/06/22 | 693 | 381.12 | 481.32 | | 100.20 | 26.29 | | | 25.77 |
| Anheuser-Busch InBev | short | 2/03/20 | 22/06/20 | 112 | 58.06 | 50.64 | 66.58 | 8.51 | 14.66 | | | 14.66 |
| Adidas | short | 11/07/22 | 25/07/22 | 14 | 164.15 | 179.96 | 148.33 | -15.81 | -9.63 | | | |
| | short | 5/09/22 | 7/11/22 | 63 | 144.28 | 115.28 | 180.56 | 36.29 | 25.15 | | | 13.09 |
| Intesa Sanpaolo | short | 15/10/18 | 12/11/18 | 28 | 2.37 | 2.20 | 2.54 | 0.18 | 7.42 | | | 7.42 |
| Imperial Brands | short | 5/03/18 | 23/04/18 | 49 | 35.72 | 33.36 | 38.26 | 2.53 | 7.09 | | | 7.09 |
| BP | short | 30/08/10 | 6/09/10 | 7 | 5.91 | 6.28 | 5.54 | -0.37 | -6.27 | | | |
| | long | 7/11/22 | 23/10/23 | 350 | 5.78 | 6.51 | | 0.73 | 12.62 | | | 5.56 |
| Credit Suisse | short | 28/03/16 | 18/04/16 | 21 | 14.33 | 15.08 | 13.58 | -0.75 | -5.23 | | | |
| | short | 25/04/16 | 16/05/16 | 21 | 15.12 | 13.69 | 16.70 | 1.58 | 10.42 | | | 4.65 |
| instrument | L/S | date buy | date sell | days | prc buy | prc sell | ps short | prc diff | d % | | | total |
| Novartis | long | 10/11/14 | 24/08/15 | 287 | 76.92 | 80.21 | | 3.29 | 4.27 | | | 4.27 |
| Vodafone | short | 12/06/06 | 26/06/06 | 14 | 2.16 | 2.09 | 2.23 | 0.07 | 3.24 | | | 3.24 |
| Rio Tinto | long | 21/04/08 | 28/04/08 | 7 | 102.94 | 102.11 | | -0.82 | -0.80 | | | |
| | long | 23/06/08 | 30/06/08 | 7 | 97.52 | 99.04 | | 1.52 | 1.56 | | | |
| | short | 24/08/15 | 26/10/15 | 63 | 33.99 | 38.18 | 29.81 | -4.19 | -12.31 | | | |
| | short | 14/12/15 | 28/12/15 | 14 | 27.97 | 29.85 | 26.09 | -1.88 | -6.72 | | | |
| | short | 4/01/16 | 25/01/16 | 21 | 28.00 | 22.92 | 34.21 | 6.21 | 22.17 | | | 0.68 |
| Airbus | short | 29/06/20 | 27/07/20 | 28 | 71.15 | 72.85 | 69.45 | -1.70 | -2.39 | | | -2.39 |
| SAP | long | 26/10/15 | 14/12/15 | 49 | 77.51 | 76.28 | | -1.24 | -1.60 | | | |
| | long | 28/12/15 | 4/01/16 | 7 | 79.91 | 76.45 | | -3.47 | -4.34 | | | |
| | long | 25/01/16 | 28/03/16 | 63 | 78.85 | 79.31 | | 0.45 | 0.58 | | | -5.32 |
| Adyen | short | 20/06/22 | 27/06/22 | 7 | 1,303.79 | 1,504.99 | 1,102.59 | -201.20 | -15.43 | | | |
| | short | 23/10/23 | 30/10/23 | 7 | 727.76 | 671.83 | 788.34 | 60.58 | 8.32 | | | -8.39 |
| AstraZeneca | long | 11/08/08 | 8/09/08 | 28 | 49.58 | 46.10 | | -3.48 | -7.02 | | | |
| | long | 30/03/09 | 6/04/09 | 7 | 33.66 | 35.24 | | 1.58 | 4.69 | | | |
| | long | 12/11/18 | 10/12/18 | 28 | 80.36 | 75.46 | | -4.90 | -6.09 | | | -8.58 |
| Bayer | short | 10/12/18 | 11/02/19 | 63 | 69.08 | 77.02 | 61.15 | -7.94 | -11.49 | | | -11.49 |
| LVMH | long | 23/04/18 | 15/10/18 | 175 | 343.02 | 302.08 | | -40.95 | -11.94 | | | -11.94 |
| BAT | long | 18/04/16 | 25/04/16 | 7 | 61.12 | 60.29 | | -0.83 | -1.35 | | | |
| | long | 16/05/16 | 5/03/18 | 658 | 60.62 | 58.44 | | -2.18 | -3.60 | | | |
| | long | 27/06/22 | 11/07/22 | 14 | 43.91 | 40.28 | | -3.62 | -8.25 | | | -12.75 |
Annotations
| 19/02/24 | Stoxx 50 | | | Component update: Glencore, ING and Munich Re replace Adidas, Adyen and Kering |
| 14/09/23 | Prosus | | | stock split 1:2.1796 (two-point-onesevenninesix for one) |
| 13/09/23 | Novo Nordisk | | | stock split 1:2 (two for one) |
| 18/07/22 | GlaxoSmithKline | | | demergers OTC business -> Haleon |
| 24/09/18 | Europe 50 | | | Safran replaces Imperial Brands |
| 31/05/17 | Europe 50 | | | Glencore replaces Syngenta (acquired by ChemChina) |
| 4/10/16 | AB InBev | | | acquisition of SAB Miller completed |
| 19/09/16 | Europe 50 | | | Syngenta replaces Richemont |
| 8/08/16 | Europe 50 | | | ASML and Vinci replace Credit Suisse and Deutsche Bank |
| 21/09/15 | Europe 50 | | | Imperial Tobacco and Intesa Sanpaolo replace BHP Biliton and Glencore |
| 14/09/15 | Europe 50 | | | complete analysis
ex BHP Biliton, Glencore - in Imperial Tobacco, Intesa Sanpaolo |
| 5/09/15 | Europe 50 | | | complete analysis |
| 9/07/15 | Europe 50 | | | market adjustment to index: Novo Nordisk replaces Standard Chartered |
| 22/09/14 | Europe 50 | | | BT Group and Prudential replace Ericsson and Tesco. |
|
|