| | |
| | |

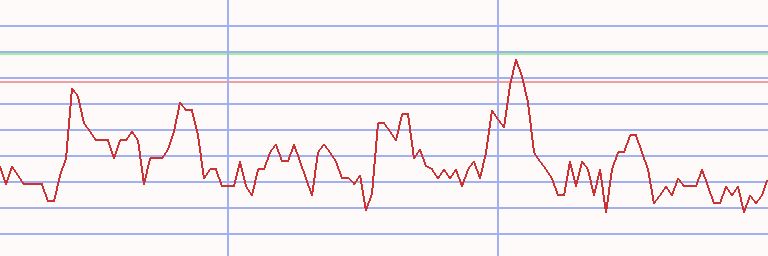
Assessment - Straits Times Index - 7/01/24 - RS = 45
⇐
| |
|
⇓instrument |
freshest |
⇓ Δday |
7/01/24 |
Δwk |
8/21/23 |
prc diff |
⇓ Δ45 |
Curr |
⇓∅-RS |
| |  |
 |
 |
|
L |
 |
STI |
3,235.380 |
8/12/24 |
-0.81 |
3,338.570 |
-3.09 |
3,154.030 |
184.540 |
5.85 |
SGD |
3.13 |
| | |
|
|
|
L |
|
ThaiBev |
0.480 |
8/12/24 |
-4.00 |
0.445 |
7.87 |
0.570 |
-0.125 |
-21.93 |
SGD |
-8.96 |
| | |
|
|
|
|
|
CapitaLand ICT |
2.100 |
8/12/24 |
0.96 |
1.960 |
7.14 |
1.880 |
0.080 |
4.26 |
SGD |
0.99 |
| | |
|
|
|
L |
|
SATS |
3.030 |
8/12/24 |
-0.98 |
2.860 |
5.94 |
2.510 |
0.350 |
13.94 |
SGD |
10.47 |
| | |
|
|
|
S |
|
Mapletree Industrial |
2.220 |
8/12/24 |
-0.89 |
2.110 |
5.21 |
2.200 |
-0.090 |
-4.09 |
SGD |
-5.05 |
| | |
|
|
|
L |
|
Hongkong Land |
3.400 |
8/12/24 |
1.80 |
3.240 |
4.94 |
3.460 |
-0.220 |
-6.36 |
USD |
-3.94 |
| | |
|
|
|
S |
|
Frasers L&C Trust |
0.985 |
8/12/24 |
-1.50 |
0.945 |
4.23 |
1.160 |
-0.215 |
-18.53 |
SGD |
-13.08 |
| | |
|
|
|
L |
|
Singapore Exchange |
9.770 |
8/12/24 |
-0.51 |
9.390 |
4.05 |
9.440 |
-0.050 |
-0.53 |
SGD |
0.28 |
| | |
|
|
|
S |
|
CapitaLand Ascendas |
2.630 |
8/12/24 |
-0.75 |
2.540 |
3.54 |
2.700 |
-0.160 |
-5.93 |
SGD |
-6.16 |
| | |
|
|
|
L |
|
Singtel |
2.840 |
8/12/24 |
-2.74 |
2.760 |
2.90 |
2.340 |
0.420 |
17.95 |
SGD |
5.73 |
| | |
|
|
|
S |
|
Jardine Matheson |
36.180 |
8/12/24 |
1.63 |
35.440 |
2.09 |
44.730 |
-9.290 |
-20.77 |
USD |
-12.67 |
| | |
|
|
|
S |
|
UOL |
5.310 |
8/12/24 |
-0.19 |
5.240 |
1.34 |
6.420 |
-1.180 |
-18.38 |
SGD |
-13.48 |
| | |
|
|
|
|
|
Emperador |
0.430 |
8/12/24 |
|
0.430 |
|
0.505 |
-0.075 |
-14.85 |
SGD |
-10.89 |
| | |
|
|
|
L |
|
Yangzijiang Ship |
2.380 |
8/12/24 |
-4.03 |
2.400 |
-0.83 |
1.660 |
0.740 |
44.58 |
SGD |
50.17 |
| | |
|
|
|
|
|
ST Engineering |
4.250 |
8/12/24 |
0.71 |
4.290 |
-0.93 |
3.780 |
0.510 |
13.49 |
SGD |
3.43 |
| | |
|
|
|
S |
|
City Developments |
5.200 |
8/12/24 |
0.97 |
5.250 |
-0.95 |
6.600 |
-1.350 |
-20.45 |
SGD |
-15.56 |
| | |
|
|
|
|
|
Mapletree Pan Asia |
1.220 |
8/12/24 |
-0.81 |
1.240 |
-1.61 |
1.520 |
-0.280 |
-18.42 |
USD |
-12.99 |
| | |
|
|
|
S |
|
Wilmar International |
3.040 |
8/12/24 |
-0.98 |
3.090 |
-1.62 |
3.580 |
-0.490 |
-13.69 |
SGD |
-12.13 |
| | |
|
|
|
L |
|
Jardine Cycle & Carr |
26.030 |
8/12/24 |
1.21 |
26.460 |
-1.63 |
32.370 |
-5.910 |
-18.26 |
SGD |
-5.33 |
| | |
|
|
|
L |
|
DFI Retail |
1.860 |
8/12/24 |
5.68 |
1.910 |
-2.62 |
2.440 |
-0.530 |
-21.72 |
USD |
-15.02 |
| | |
|
|
|
L |
|
Seatrium |
1.400 |
8/12/24 |
-1.41 |
1.440 |
-2.78 |
2.680 |
-1.240 |
-46.27 |
SGD |
-21.69 |
| | |
|
|
|
S |
|
Mapletree Logistics |
1.260 |
8/12/24 |
-0.79 |
1.300 |
-3.08 |
1.640 |
-0.340 |
-20.73 |
SGD |
-14.55 |
| | |
|
|
|
|
|
Venture Corporation |
13.780 |
8/12/24 |
-0.72 |
14.280 |
-3.50 |
13.250 |
1.030 |
7.77 |
SGD |
2.11 |
| | |
|
|
|
|
|
OCBC |
13.830 |
8/12/24 |
0.29 |
14.500 |
-4.62 |
12.210 |
2.290 |
18.76 |
SGD |
8.37 |
| | |
|
|
|
S |
|
Sembcorp Industries |
4.630 |
8/12/24 |
-2.53 |
4.860 |
-4.73 |
5.320 |
-0.460 |
-8.65 |
SGD |
-3.66 |
| |
|
⇓instrument |
freshest |
⇓ Δday |
7/01/24 |
Δwk |
8/21/23 |
prc diff |
⇓ Δ45 |
Curr |
⇓∅-RS |
| | |
|
|
|
L |
|
CapitaLand Invest |
2.520 |
8/12/24 |
0.80 |
2.650 |
-4.91 |
3.040 |
-0.390 |
-12.83 |
SGD |
-10.68 |
| | |
|
|
|
|
|
DBS Bank |
33.980 |
8/12/24 |
1.22 |
36.120 |
-5.92 |
32.520 |
3.600 |
11.07 |
SGD |
6.27 |
| | |
|
|
|
S |
|
Genting |
0.795 |
8/12/24 |
-2.45 |
0.845 |
-5.92 |
0.910 |
-0.065 |
-7.14 |
SGD |
-5.31 |
| | |
|
|
|
L |
|
United Overseas Bank |
29.290 |
8/12/24 |
0.58 |
31.300 |
-6.42 |
27.780 |
3.520 |
12.67 |
SGD |
7.07 |
| | |
|
|
|
S |
|
Keppel |
5.950 |
8/12/24 |
0.34 |
6.440 |
-7.61 |
6.700 |
-0.260 |
-3.88 |
SGD |
-4.45 |
| | |
|
|
|
|
|
Singapore Airlines |
5.900 |
8/12/24 |
0.34 |
6.880 |
-14.24 |
6.900 |
-0.020 |
-0.29 |
SGD |
1.08 |
| STI - 30 out of 30 instruments rated - 7/01/24 / 8/21/23 - 9 did rise, Market-Ratio(45) = 30.00 % |
Technical Chart
Transactions Straits Times Index * A45 - 79/68 (1)
|
⇐ |
| |
| L/S | date buy | date sell | days | | instrument | spl | pieces | Curr | prc buy | prc sell | ps short | prc diff | d % | asset | yield | |
| 1/02/06 |
2/27/06 |
56 |
|
- cash - |
| long |
2/27/06 |
5/29/06 |
91 |
|
|
|
Singapore Exchange |
100 |
2,551 |
SGD |
3.920 |
3.980 |
|
0.060 |
2 |
10,153 |
6 |
|
| short |
5/29/06 |
9/04/06 |
98 |
|
|
|
Noble Group |
100 |
16,115 |
SGD |
0.630 |
0.710 |
0.550 |
-0.080 |
-13 |
8,864 |
-40 |
|
| long |
9/04/06 |
11/26/07 |
448 |
|
|
|
Singapore Exchange |
100 |
2,172 |
SGD |
4.080 |
14.100 |
|
10.020 |
246 |
30,627 |
175 |
|
| short |
11/26/07 |
8/17/09 |
630 |
|
|
|
CapitaLand ICT |
100 |
9,511 |
SGD |
3.220 |
1.530 |
6.777 |
3.557 |
110 |
64,455 |
54 |
|
| long |
8/17/09 |
2/07/11 |
539 |
|
|
|
Yangzijiang Ship |
100 |
68,206 |
SGD |
0.945 |
1.910 |
|
0.965 |
102 |
130,274 |
61 |
|
| short |
2/07/11 |
3/28/11 |
49 |
|
|
|
Wilmar International |
100 |
24,814 |
SGD |
5.250 |
5.470 |
5.030 |
-0.220 |
-4 |
124,815 |
-27 |
|
| long |
3/28/11 |
5/02/11 |
35 |
|
|
|
Genting |
100 |
60,589 |
SGD |
2.060 |
2.100 |
|
0.040 |
2 |
127,238 |
22 |
|
| short |
5/02/11 |
7/02/12 |
427 |
|
|
|
Wilmar International |
100 |
24,851 |
SGD |
5.120 |
3.520 |
7.447 |
2.327 |
45 |
185,074 |
38 |
|
| long |
7/02/12 |
6/10/13 |
343 |
|
|
|
ThaiBev |
100 |
544,335 |
SGD |
0.340 |
0.630 |
|
0.290 |
85 |
342,931 |
93 |
|
| short |
6/10/13 |
12/05/16 |
1274 |
|
|
|
Noble Group |
100 |
339,535 |
SGD |
1.010 |
0.166 |
6.145 |
5.135 |
508 |
2,086,511 |
68 |
|
| long |
12/05/16 |
12/19/16 |
14 |
|
|
|
Genting |
100 |
2,129,093 |
SGD |
0.980 |
0.930 |
|
-0.050 |
-5 |
1,980,057 |
-74 |
|
| short |
12/19/16 |
5/08/17 |
140 |
|
|
|
StarHub |
100 |
717,411 |
SGD |
2.760 |
2.760 |
2.760 |
0.000 |
0 |
1,980,057 |
0 |
|
| long |
5/08/17 |
6/12/17 |
35 |
|
|
|
Yangzijiang Ship |
100 |
1,565,262 |
SGD |
1.265 |
1.215 |
|
-0.050 |
-4 |
1,901,794 |
-34 |
|
| short |
6/12/17 |
1/25/21 |
1323 |
|
|
|
StarHub |
100 |
699,188 |
SGD |
2.720 |
1.330 |
5.563 |
2.843 |
105 |
3,889,375 |
22 |
|
| long |
1/25/21 |
6/21/21 |
147 |
|
|
|
Wilmar International |
100 |
703,322 |
SGD |
5.530 |
4.550 |
|
-0.980 |
-18 |
3,200,120 |
-38 |
|
| short |
6/21/21 |
7/19/21 |
28 |
|
|
|
Keppel DC REIT |
100 |
1,245,182 |
SGD |
2.570 |
2.600 |
2.540 |
-0.030 |
-1 |
3,162,764 |
-14 |
|
| long |
7/19/21 |
9/27/21 |
70 |
|
|
|
Yangzijiang Ship |
100 |
2,325,561 |
SGD |
1.360 |
1.400 |
|
0.040 |
3 |
3,255,787 |
16 |
|
| short |
9/27/21 |
8/12/24 |
1050 |
|
|
|
DFI Retail |
100 |
946,449 |
USD |
3.440 |
1.860 |
6.362 |
2.922 |
85 |
6,021,500 |
24 |
|
| accum | 2/27/06 |
8/12/24 | 7421 |
days out of 7477 invested (99%) |
60,115 |
6,021,500 |
37 |
|
Instrument Related Contribution
| instrument | L/S | date buy | date sell | days | prc buy | prc sell | ps short | prc diff | d % | | | total |
| Noble Group | short | 5/29/06 | 9/04/06 | 98 | 0.63 | 0.71 | 0.55 | -0.08 | -12.70 | | | |
| | short | 6/10/13 | 12/05/16 | 1274 | 1.01 | 0.17 | 6.15 | 5.14 | 508.44 | | | 431.17 |
| Singapore Exchange | long | 2/27/06 | 5/29/06 | 91 | 3.92 | 3.98 | | 0.06 | 1.53 | | | |
| | long | 9/04/06 | 11/26/07 | 448 | 4.08 | 14.10 | | 10.02 | 245.59 | | | 250.88 |
| CapitaLand ICT | short | 11/26/07 | 8/17/09 | 630 | 3.22 | 1.53 | 6.78 | 3.56 | 110.46 | | | 110.46 |
| StarHub | short | 12/19/16 | 5/08/17 | 140 | 2.76 | 2.76 | 2.76 | 0.00 | 0.00 | | | |
| | short | 6/12/17 | 1/25/21 | 1323 | 2.72 | 1.33 | 5.56 | 2.84 | 104.51 | | | 104.51 |
| Yangzijiang Ship | long | 8/17/09 | 2/07/11 | 539 | 0.95 | 1.91 | | 0.97 | 102.12 | | | |
| | long | 5/08/17 | 6/12/17 | 35 | 1.27 | 1.22 | | -0.05 | -3.95 | | | |
| | long | 7/19/21 | 9/27/21 | 70 | 1.36 | 1.40 | | 0.04 | 2.94 | | | 99.84 |
| ThaiBev | long | 7/02/12 | 6/10/13 | 343 | 0.34 | 0.63 | | 0.29 | 85.29 | | | 85.29 |
| DFI Retail | short | 9/27/21 | 8/12/24 | 1050 | 3.44 | 1.86 | 6.36 | 2.92 | 84.95 | | | 84.95 |
| Wilmar International | short | 2/07/11 | 3/28/11 | 49 | 5.25 | 5.47 | 5.03 | -0.22 | -4.19 | | | |
| | short | 5/02/11 | 7/02/12 | 427 | 5.12 | 3.52 | 7.45 | 2.33 | 45.46 | | | |
| | long | 1/25/21 | 6/21/21 | 147 | 5.53 | 4.55 | | -0.98 | -17.72 | | | 14.66 |
| Keppel DC REIT | short | 6/21/21 | 7/19/21 | 28 | 2.57 | 2.60 | 2.54 | -0.03 | -1.17 | | | -1.17 |
| Genting | long | 3/28/11 | 5/02/11 | 35 | 2.06 | 2.10 | | 0.04 | 1.94 | | | |
| | long | 12/05/16 | 12/19/16 | 14 | 0.98 | 0.93 | | -0.05 | -5.10 | | | -3.26 |
Annotations
| 5/07/24 | Seatrium | | | reverse split 20:1 (one for twenty) |
| 3/12/24 | STI | | | Component update: Seatrium (former Sembcorp Marine) replaces Keppel DC REIT |
| 12/07/20 | CapitaLand Mall | | | mergered with CMT |
| 1/17/18 | STI | | | Jardine Strategic and Venture Corporation replace Global Logistic and SIA Engineering Company |
| 10/31/16 | STI | | | CapitaCom Trust and Jardine Matheson replace Noble and Sembcorp Marine |
| 2/02/16 | STI | | | full technique analysis performed |
| 9/21/15 | STI | | | SATS, UOL and Yangzijiang Shipbuilding replace
Jardine Matheson, Jardine Strategic and Olam |
| 9/04/15 | STI | | | complete analysis |
|
|