| | Fri, 19th Jun 2026, 18:22UTC |
| | |

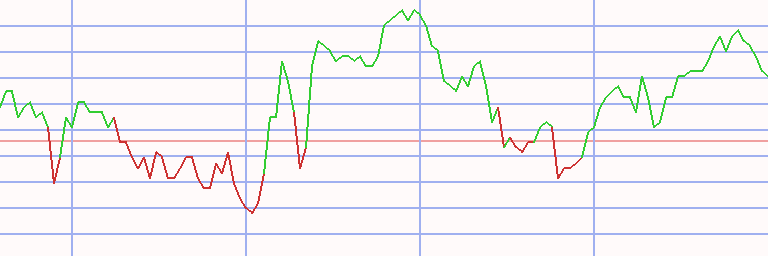
Assessment - STOXX Europe 50 in Japanese yen - 1/07/24 - RS = 29
⇐
| |
|
instrument |
freshest |
⇓ Δday |
1/07/24 |
⇓ Δwk |
11/12/23 |
prc diff |
⇓ Δ29 |
|
⇓∅-RS |
| |  |
 |
 |
|
|
 |
Stoxx 50 |
752,888.080 |
12/08/24 |
-0.16 |
781,258.599 |
-3.63 |
641,565.084 |
139,693.515 |
21.77 |
|
17.87 |
| | |
|
|
|
L |
|
ABB |
8,137.474 |
12/08/24 |
0.55 |
9,008.261 |
-9.67 |
6,152.881 |
2,855.379 |
46.41 |
|
45.14 |
| | |
|
|
|
S |
|
Air Liquide |
28,127.888 |
12/08/24 |
-0.79 |
28,183.347 |
-0.20 |
27,790.627 |
392.720 |
1.41 |
|
2.26 |
| | |
|
|
|
|
|
Airbus |
23,181.678 |
12/08/24 |
-0.45 |
22,814.265 |
1.61 |
22,390.478 |
423.787 |
1.89 |
|
0.51 |
| | |
|
|
|
|
|
Allianz |
44,349.517 |
12/08/24 |
|
45,493.350 |
-2.51 |
38,612.954 |
6,880.396 |
17.82 |
|
18.63 |
| | |
|
|
|
|
|
Anheuser-Busch InBev |
9,566.602 |
12/08/24 |
-0.47 |
9,434.888 |
1.40 |
9,214.240 |
220.647 |
2.39 |
|
6.52 |
| | |
|
|
|
|
|
ASML |
135,977.457 |
12/08/24 |
0.08 |
165,387.824 |
-17.78 |
103,723.142 |
61,664.682 |
59.45 |
|
47.29 |
| | |
|
|
|
L |
|
AstraZeneca |
2,610,435.601 |
12/08/24 |
0.63 |
2,513,208.109 |
3.87 |
1,854,252.693 |
658,955.416 |
35.54 |
|
24.92 |
| | |
|
|
|
|
|
Axa |
5,606.514 |
12/08/24 |
-0.77 |
5,417.608 |
3.49 |
4,729.851 |
687.757 |
14.54 |
|
12.92 |
| | |
|
|
|
|
|
Banco Santander |
708.656 |
12/08/24 |
-0.24 |
770.787 |
-8.06 |
620.105 |
150.683 |
24.30 |
|
24.98 |
| | |
|
|
|
S |
|
BASF |
7,154.154 |
12/08/24 |
-0.22 |
7,693.142 |
-7.01 |
7,148.274 |
544.868 |
7.62 |
|
3.94 |
| | |
|
|
|
L |
|
BAT |
572,130.682 |
12/08/24 |
|
500,639.879 |
14.28 |
421,045.394 |
79,594.485 |
18.90 |
|
9.14 |
| | |
|
|
|
L |
|
Bayer |
4,499.076 |
12/08/24 |
-0.04 |
4,535.470 |
-0.80 |
4,954.857 |
-419.387 |
-8.46 |
|
-18.92 |
| | |
|
|
|
|
|
BNP Paribas |
10,268.499 |
12/08/24 |
|
10,687.904 |
-3.92 |
9,626.489 |
1,061.415 |
11.03 |
|
10.35 |
| | |
|
|
|
|
|
BP |
89,792.448 |
12/08/24 |
1.35 |
97,738.140 |
-8.13 |
85,816.122 |
11,922.018 |
13.89 |
|
7.47 |
| | |
|
|
|
|
|
Deutsche Post |
6,246.020 |
12/08/24 |
-0.36 |
6,675.824 |
-6.44 |
7,245.043 |
-569.218 |
-7.86 |
|
0.22 |
| | |
|
|
|
L |
|
Deutsche Telekom |
4,285.907 |
12/08/24 |
0.49 |
4,103.933 |
4.43 |
3,585.151 |
518.782 |
14.47 |
|
20.25 |
| | |
|
|
|
S |
|
Diageo |
500,742.009 |
12/08/24 |
1.03 |
506,563.403 |
-1.15 |
515,998.707 |
-9,435.304 |
-1.83 |
|
-8.60 |
| | |
|
|
|
|
|
Enel |
1,115.757 |
12/08/24 |
0.44 |
1,145.046 |
-2.56 |
1,025.430 |
119.616 |
11.66 |
|
14.95 |
| | |
|
|
|
|
|
EssilorLuxottica |
35,926.748 |
12/08/24 |
-0.58 |
34,973.554 |
2.73 |
28,829.117 |
6,144.437 |
21.31 |
|
18.25 |
| | |
|
|
|
|
|
Glencore |
83,797.434 |
12/08/24 |
1.27 |
94,306.582 |
-11.14 |
80,682.766 |
13,623.816 |
16.89 |
|
13.76 |
| | |
|
|
|
|
|
GSK |
321,095.834 |
12/08/24 |
0.42 |
311,699.900 |
3.01 |
265,832.542 |
45,867.358 |
17.25 |
|
9.79 |
| | |
|
|
|
|
|
Hermes International |
347,655.848 |
12/08/24 |
-0.50 |
364,293.416 |
-4.57 |
314,347.837 |
49,945.579 |
15.89 |
|
13.37 |
| | |
|
|
|
L |
|
HSBC |
131,522.651 |
12/08/24 |
0.22 |
141,122.845 |
-6.80 |
113,209.326 |
27,913.518 |
24.66 |
|
20.19 |
| | |
|
|
|
L |
|
Iberdrola |
2,097.893 |
12/08/24 |
0.29 |
2,135.155 |
-1.75 |
1,848.827 |
286.327 |
15.49 |
|
18.47 |
| |
|
instrument |
freshest |
⇓ Δday |
1/07/24 |
⇓ Δwk |
11/12/23 |
prc diff |
⇓ Δ29 |
|
⇓∅-RS |
| | |
|
|
|
|
|
ING Groep |
2,639.827 |
12/08/24 |
0.21 |
2,834.972 |
-6.88 |
2,136.458 |
698.515 |
32.69 |
|
31.37 |
| | |
|
|
|
|
|
L´Oreal |
65,276.458 |
12/08/24 |
-1.59 |
71,446.223 |
-8.64 |
69,838.466 |
1,607.757 |
2.30 |
|
4.76 |
| | |
|
|
|
S |
|
LVMH |
110,067.911 |
12/08/24 |
-0.14 |
123,395.296 |
-10.80 |
116,436.780 |
6,958.516 |
5.98 |
|
0.59 |
| | |
|
|
|
S |
|
Mercedes-Benz |
9,961.744 |
12/08/24 |
-0.57 |
11,230.358 |
-11.30 |
9,920.728 |
1,309.630 |
13.20 |
|
5.02 |
| | |
|
|
|
L |
|
Münchener Rück |
76,116.874 |
12/08/24 |
1.01 |
80,917.505 |
-5.93 |
61,837.371 |
19,080.134 |
30.86 |
|
29.34 |
| | |
|
|
|
S |
|
National Grid |
199,847.433 |
12/08/24 |
-0.04 |
180,851.305 |
10.50 |
195,324.657 |
-14,473.352 |
-7.41 |
|
-4.42 |
| | |
|
|
|
L |
|
Nestlé |
15,849.389 |
12/08/24 |
-0.40 |
16,428.722 |
-3.53 |
16,479.803 |
-51.081 |
-0.31 |
|
-1.28 |
| | |
|
|
|
L |
|
Novartis |
17,297.720 |
12/08/24 |
0.16 |
17,294.144 |
0.02 |
14,242.997 |
3,051.147 |
21.42 |
|
16.32 |
| | |
|
|
|
|
|
Novo Nordisk |
20,750.704 |
12/08/24 |
-2.80 |
23,346.575 |
-11.12 |
14,122.514 |
9,224.062 |
65.31 |
|
51.02 |
| | |
|
|
|
L |
|
Prosus |
5,693.168 |
12/08/24 |
1.77 |
5,739.094 |
-0.80 |
4,747.159 |
991.935 |
20.90 |
|
21.60 |
| | |
|
|
|
|
|
Reckitt Benckiser |
853,804.445 |
12/08/24 |
|
876,068.724 |
-2.54 |
988,469.493 |
-112,400.769 |
-11.37 |
|
-11.18 |
| | |
|
|
|
|
|
RELX |
721,240.071 |
12/08/24 |
0.57 |
730,636.005 |
-1.29 |
572,474.806 |
158,161.199 |
27.63 |
|
29.64 |
| | |
|
|
|
L |
|
Richemont |
22,922.966 |
12/08/24 |
1.22 |
25,131.224 |
-8.79 |
19,547.090 |
5,584.133 |
28.57 |
|
19.17 |
| | |
|
|
|
|
|
Rio Tinto |
1,009,450.136 |
12/08/24 |
0.56 |
1,069,093.892 |
-5.58 |
1,007,203.028 |
61,890.864 |
6.14 |
|
9.29 |
| | |
|
|
|
L |
|
Roche |
49,672.387 |
12/08/24 |
0.25 |
44,719.453 |
11.08 |
42,322.904 |
2,396.549 |
5.66 |
|
9.51 |
| | |
|
|
|
|
|
Safran |
33,309.798 |
12/08/24 |
-0.18 |
35,025.547 |
-4.90 |
26,037.782 |
8,987.765 |
34.52 |
|
30.19 |
| | |
|
|
|
|
|
Sanofi |
16,580.376 |
12/08/24 |
-0.60 |
15,918.340 |
4.16 |
13,815.067 |
2,103.273 |
15.22 |
|
7.50 |
| | |
|
|
|
|
|
SAP |
32,807.204 |
12/08/24 |
-0.33 |
32,179.829 |
1.95 |
23,183.507 |
8,996.322 |
38.80 |
|
38.60 |
| | |
|
|
|
|
|
Schneider Electric |
36,611.315 |
12/08/24 |
0.38 |
39,054.958 |
-6.26 |
27,781.186 |
11,273.771 |
40.58 |
|
36.22 |
| | |
|
|
|
|
|
Shell |
5,723.497 |
12/08/24 |
0.93 |
5,871.675 |
-2.52 |
4,691.301 |
1,180.374 |
25.16 |
|
20.90 |
| | |
|
|
|
|
|
Siemens |
27,244.018 |
12/08/24 |
0.01 |
30,696.313 |
-11.25 |
25,852.112 |
4,844.201 |
18.74 |
|
22.71 |
| | |
|
|
|
|
|
TotalEnergies |
10,696.570 |
12/08/24 |
0.60 |
11,024.122 |
-2.97 |
9,750.794 |
1,273.328 |
13.06 |
|
12.72 |
| | |
|
|
|
|
|
UBS |
4,443.336 |
12/08/24 |
0.44 |
4,824.194 |
-7.89 |
4,167.383 |
656.811 |
15.76 |
|
22.48 |
| | |
|
|
|
L |
|
Unilever Plc |
962,878.985 |
12/08/24 |
-0.34 |
887,507.252 |
8.49 |
694,150.956 |
193,356.296 |
27.86 |
|
19.24 |
| | |
|
|
|
S |
|
Vinci |
17,790.066 |
12/08/24 |
-0.77 |
17,486.777 |
1.73 |
18,267.987 |
-781.210 |
-4.28 |
|
-0.91 |
| |
|
instrument |
freshest |
⇓ Δday |
1/07/24 |
⇓ Δwk |
11/12/23 |
prc diff |
⇓ Δ29 |
|
⇓∅-RS |
| | |
|
|
|
L |
|
Zurich Insurance |
83,091.282 |
12/08/24 |
0.85 |
86,327.676 |
-3.75 |
74,843.137 |
11,484.538 |
15.34 |
|
17.13 |
| Europe 50 - 50 out of 50 instruments rated - 1/07/24 / 11/12/23 - 43 did rise, Market-Ratio(29) in JPY = 86.00 % |
Technical Chart
Transactions STOXX Europe 50 in Japanese yen * L29 - 45 ex 9 (1)
|
⇐ |
| |
| L/S | date buy | date sell | days | | instrument | spl | pieces | | prc buy | prc sell | | prc diff | d % | asset | yield | | | long |
2/01/06 |
17/07/06 |
196 |
|
|
|
ABB |
100 |
8 |
|
1,174.254 |
1,349.999 |
|
175.746 |
15 |
11,406 |
30 |
|
| 17/07/06 |
24/07/06 |
7 |
|
- cash - |
| |
24/07/06 |
2/04/07 |
252 |
|
|
|
ABB |
100 |
8 |
|
1,395.049 |
2,035.450 |
|
640.402 |
46 |
16,529 |
73 |
|
| |
2/04/07 |
10/09/07 |
161 |
|
|
|
Mercedes-Benz |
100 |
1 |
|
9,787.170 |
9,971.029 |
|
183.859 |
2 |
16,713 |
4 |
|
| 10/09/07 |
24/09/07 |
14 |
|
- cash - |
| |
24/09/07 |
12/11/07 |
49 |
|
|
|
Rio Tinto |
100 |
2 |
|
8,103.029 |
10,813.932 |
|
2,710.903 |
33 |
22,135 |
758 |
|
| 12/11/07 |
3/12/07 |
21 |
|
- cash - |
| |
3/12/07 |
10/12/07 |
7 |
|
|
|
Rio Tinto |
100 |
2 |
|
10,286.424 |
10,835.153 |
|
548.729 |
5 |
23,232 |
1,403 |
|
| 10/12/07 |
11/08/08 |
245 |
|
- cash - |
| |
11/08/08 |
18/08/08 |
7 |
|
|
|
Hermes International |
100 |
1 |
|
17,510.434 |
16,200.786 |
|
-1,309.648 |
-7 |
21,923 |
-98 |
|
| 18/08/08 |
4/05/09 |
259 |
|
- cash - |
| |
4/05/09 |
11/05/09 |
7 |
|
|
|
ASML |
100 |
10 |
|
2,134.390 |
1,897.376 |
|
-237.013 |
-11 |
19,553 |
-100 |
|
| |
11/05/09 |
25/05/09 |
14 |
|
|
|
Anheuser-Busch InBev |
100 |
5 |
|
3,360.357 |
3,265.918 |
|
-94.439 |
-3 |
19,080 |
-52 |
|
| 25/05/09 |
8/06/09 |
14 |
|
- cash - |
| |
8/06/09 |
22/06/09 |
14 |
|
|
|
Rio Tinto |
100 |
5 |
|
3,809.442 |
3,199.500 |
|
-609.942 |
-16 |
16,031 |
-99 |
|
| |
22/06/09 |
29/06/09 |
7 |
|
|
|
Anheuser-Busch InBev |
100 |
4 |
|
3,237.334 |
3,474.636 |
|
237.303 |
7 |
16,980 |
3,899 |
|
| 29/06/09 |
20/07/09 |
21 |
|
- cash - |
| |
20/07/09 |
11/01/10 |
175 |
|
|
|
Anheuser-Busch InBev |
100 |
4 |
|
3,655.025 |
4,713.256 |
|
1,058.231 |
29 |
21,213 |
70 |
|
| |
11/01/10 |
3/05/10 |
112 |
|
|
|
Rio Tinto |
100 |
3 |
|
5,381.500 |
4,535.146 |
|
-846.354 |
-16 |
18,674 |
-43 |
|
| |
3/05/10 |
5/07/10 |
63 |
|
|
|
Safran |
100 |
7 |
|
2,394.096 |
2,284.724 |
|
-109.372 |
-5 |
17,908 |
-24 |
|
| 5/07/10 |
12/07/10 |
7 |
|
- cash - |
| |
12/07/10 |
19/07/10 |
7 |
|
|
|
Safran |
100 |
7 |
|
2,435.657 |
2,288.613 |
|
-147.044 |
-6 |
16,879 |
-96 |
|
| 19/07/10 |
26/07/10 |
7 |
|
- cash - |
| |
26/07/10 |
7/02/11 |
196 |
|
|
|
Safran |
100 |
7 |
|
2,401.244 |
2,846.055 |
|
444.811 |
19 |
19,992 |
37 |
|
| |
7/02/11 |
18/04/11 |
70 |
|
|
|
ASML |
100 |
5 |
|
3,644.067 |
3,259.313 |
|
-384.753 |
-11 |
18,069 |
-44 |
|
| |
18/04/11 |
18/07/11 |
91 |
|
|
|
BASF |
100 |
2 |
|
7,468.710 |
7,552.160 |
|
83.450 |
1 |
18,236 |
5 |
|
| 18/07/11 |
25/07/11 |
7 |
|
- cash - |
| |
25/07/11 |
8/08/11 |
14 |
|
|
|
Hermes International |
100 |
0 |
|
27,062.400 |
24,053.201 |
|
-3,009.200 |
-11 |
18,236 |
0 |
|
| 8/08/11 |
16/01/12 |
161 |
|
- cash - |
| |
16/01/12 |
23/01/12 |
7 |
|
|
|
Hermes International |
100 |
0 |
|
24,248.444 |
25,248.416 |
|
999.972 |
4 |
18,236 |
0 |
|
| 23/01/12 |
6/02/12 |
14 |
|
- cash - |
| |
6/02/12 |
19/03/12 |
42 |
|
|
|
Hermes International |
100 |
0 |
|
27,887.101 |
27,207.675 |
|
-679.426 |
-2 |
18,236 |
0 |
|
| |
19/03/12 |
25/06/12 |
98 |
|
|
|
Airbus |
100 |
5 |
|
3,333.627 |
2,654.361 |
|
-679.266 |
-20 |
14,839 |
-57 |
|
| |
25/06/12 |
24/09/12 |
91 |
|
|
|
ASML |
100 |
3 |
|
3,948.690 |
4,156.914 |
|
208.224 |
5 |
15,464 |
23 |
|
| |
24/09/12 |
10/12/12 |
77 |
|
|
|
Anheuser-Busch InBev |
100 |
2 |
|
6,798.165 |
7,259.280 |
|
461.115 |
7 |
16,386 |
36 |
|
| |
10/12/12 |
25/03/13 |
105 |
|
|
|
Richemont |
100 |
2 |
|
6,506.781 |
7,385.698 |
|
878.917 |
14 |
18,144 |
55 |
|
| |
25/03/13 |
10/02/14 |
322 |
|
|
|
Airbus |
100 |
3 |
|
5,086.529 |
7,316.513 |
|
2,229.984 |
44 |
24,834 |
51 |
|
| L/S | date buy | date sell | days | | instrument | spl | pieces | | prc buy | prc sell | | prc diff | d % | asset | yield | | | |
10/02/14 |
12/05/14 |
91 |
|
|
|
ING Groep |
100 |
17 |
|
1,402.622 |
1,441.971 |
|
39.349 |
3 |
25,503 |
12 |
|
| |
12/05/14 |
22/09/14 |
133 |
|
|
|
Enel |
100 |
42 |
|
594.497 |
580.946 |
|
-13.550 |
-2 |
24,934 |
-6 |
|
| |
22/09/14 |
20/10/14 |
28 |
|
|
|
Novo Nordisk |
100 |
9 |
|
2,627.072 |
2,397.132 |
|
-229.940 |
-9 |
22,864 |
-70 |
|
| 20/10/14 |
3/11/14 |
14 |
|
- cash - |
| |
3/11/14 |
15/12/14 |
42 |
|
|
|
ASML |
100 |
2 |
|
11,317.756 |
12,190.206 |
|
872.450 |
8 |
24,609 |
91 |
|
| 15/12/14 |
22/12/14 |
7 |
|
- cash - |
| |
22/12/14 |
5/01/15 |
14 |
|
|
|
ASML |
100 |
1 |
|
13,010.606 |
12,455.076 |
|
-555.530 |
-4 |
24,054 |
-68 |
|
| 5/01/15 |
12/01/15 |
7 |
|
- cash - |
| |
12/01/15 |
6/04/15 |
84 |
|
|
|
ASML |
100 |
1 |
|
12,308.116 |
12,161.910 |
|
-146.206 |
-1 |
23,907 |
-5 |
|
| |
6/04/15 |
24/08/15 |
140 |
|
|
|
Novo Nordisk |
100 |
7 |
|
3,295.945 |
3,220.672 |
|
-75.273 |
-2 |
23,381 |
-6 |
|
| 24/08/15 |
14/03/16 |
203 |
|
- cash - |
| |
14/03/16 |
4/04/16 |
21 |
|
|
|
Vinci |
100 |
2 |
|
8,163.179 |
8,299.060 |
|
135.881 |
2 |
23,652 |
33 |
|
| 4/04/16 |
18/04/16 |
14 |
|
- cash - |
| |
18/04/16 |
2/05/16 |
14 |
|
|
|
Glencore |
100 |
96 |
|
245.594 |
255.581 |
|
9.987 |
4 |
24,611 |
183 |
|
| 2/05/16 |
4/07/16 |
63 |
|
- cash - |
| |
4/07/16 |
5/06/17 |
336 |
|
|
|
Glencore |
100 |
110 |
|
222.193 |
404.018 |
|
181.825 |
82 |
44,612 |
91 |
|
| |
5/06/17 |
31/07/17 |
56 |
|
|
|
LVMH |
100 |
1 |
|
28,638.035 |
27,770.537 |
|
-867.497 |
-3 |
43,744 |
-18 |
|
| |
31/07/17 |
20/11/17 |
112 |
|
|
|
Glencore |
100 |
88 |
|
492.977 |
536.409 |
|
43.432 |
9 |
47,566 |
32 |
|
| |
20/11/17 |
26/03/18 |
126 |
|
|
|
ASML |
100 |
2 |
|
20,430.737 |
21,442.165 |
|
1,011.428 |
5 |
49,589 |
15 |
|
| 26/03/18 |
11/06/18 |
77 |
|
- cash - |
| |
11/06/18 |
18/06/18 |
7 |
|
|
|
LVMH |
100 |
1 |
|
39,066.684 |
38,087.082 |
|
-979.601 |
-3 |
48,609 |
-73 |
|
| 18/06/18 |
27/08/18 |
70 |
|
- cash - |
| |
27/08/18 |
12/11/18 |
77 |
|
|
|
Safran |
100 |
3 |
|
14,510.748 |
14,275.984 |
|
-234.764 |
-2 |
47,905 |
-7 |
|
| 12/11/18 |
25/02/19 |
105 |
|
- cash - |
| |
25/02/19 |
18/03/19 |
21 |
|
|
|
Roche |
100 |
1 |
|
30,701.675 |
31,015.728 |
|
314.053 |
1 |
48,219 |
19 |
|
| 18/03/19 |
25/03/19 |
7 |
|
- cash - |
| |
25/03/19 |
28/10/19 |
217 |
|
|
|
Iberdrola |
100 |
49 |
|
966.557 |
1,108.754 |
|
142.197 |
15 |
55,187 |
26 |
|
| |
28/10/19 |
9/03/20 |
133 |
|
|
|
ASML |
100 |
1 |
|
29,071.285 |
27,654.532 |
|
-1,416.753 |
-5 |
53,770 |
-13 |
|
| 9/03/20 |
28/09/20 |
203 |
|
- cash - |
| |
28/09/20 |
7/12/20 |
70 |
|
|
|
Deutsche Post |
100 |
11 |
|
4,826.624 |
4,962.468 |
|
135.844 |
3 |
55,264 |
16 |
|
| |
7/12/20 |
12/07/21 |
217 |
|
|
|
Mercedes-Benz |
100 |
7 |
|
7,276.605 |
9,585.338 |
|
2,308.734 |
32 |
71,426 |
59 |
|
| |
12/07/21 |
10/01/22 |
182 |
|
|
|
ASML |
100 |
0 |
|
77,418.028 |
81,146.053 |
|
3,728.025 |
5 |
71,426 |
0 |
|
| |
10/01/22 |
7/03/22 |
56 |
|
|
|
Richemont |
100 |
4 |
|
16,493.834 |
13,129.484 |
|
-3,364.350 |
-20 |
57,968 |
-77 |
|
| 7/03/22 |
21/03/22 |
14 |
|
- cash - |
| |
21/03/22 |
23/05/22 |
63 |
|
|
|
Glencore |
100 |
74 |
|
782.473 |
824.025 |
|
41.552 |
5 |
61,043 |
35 |
|
| 23/05/22 |
14/11/22 |
175 |
|
- cash - |
| |
14/11/22 |
19/12/22 |
35 |
|
|
|
BP |
100 |
77 |
|
792.257 |
777.239 |
|
-15.019 |
-2 |
59,887 |
-18 |
|
| 19/12/22 |
26/12/22 |
7 |
|
- cash - |
| |
26/12/22 |
12/06/23 |
168 |
|
|
|
Münchener Rück |
100 |
1 |
|
42,863.609 |
48,817.341 |
|
5,953.733 |
14 |
65,840 |
33 |
|
| L/S | date buy | date sell | days | | instrument | spl | pieces | | prc buy | prc sell | | prc diff | d % | asset | yield | | | |
12/06/23 |
21/08/23 |
70 |
|
|
|
Hermes International |
100 |
0 |
|
296,417.814 |
298,661.254 |
|
2,243.440 |
1 |
65,840 |
0 |
|
| 21/08/23 |
28/08/23 |
7 |
|
- cash - |
| |
28/08/23 |
4/09/23 |
7 |
|
|
|
Novo Nordisk |
100 |
4 |
|
13,734.534 |
13,902.270 |
|
167.736 |
1 |
66,511 |
88 |
|
| 4/09/23 |
2/10/23 |
28 |
|
- cash - |
| |
2/10/23 |
23/10/23 |
21 |
|
|
|
Novo Nordisk |
100 |
4 |
|
13,432.877 |
14,596.697 |
|
1,163.820 |
9 |
71,167 |
324 |
|
| 23/10/23 |
27/11/23 |
35 |
|
- cash - |
| |
27/11/23 |
12/08/24 |
259 |
|
|
|
Novo Nordisk |
100 |
4 |
|
15,511.014 |
20,750.704 |
|
5,239.690 |
34 |
92,125 |
51 |
|
| accum | 2/01/06 |
12/08/24 | 5660 |
days out of 7473 invested (76%) |
821 |
92,125 |
15 |
|
Instrument Related Contribution
| instrument | L/S | date buy | date sell | days | prc buy | prc sell | | prc diff | d % | | | total |
| Glencore | long | 18/04/16 | 2/05/16 | 14 | 245.59 | 255.58 | | 9.99 | 4.07 | | | |
| | | 4/07/16 | 5/06/17 | 336 | 222.19 | 404.02 | | 181.82 | 81.83 | | | |
| | | 31/07/17 | 20/11/17 | 112 | 492.98 | 536.41 | | 43.43 | 8.81 | | | |
| | | 21/03/22 | 23/05/22 | 63 | 782.47 | 824.02 | | 41.55 | 5.31 | | | 116.83 |
| ABB | | 2/01/06 | 17/07/06 | 196 | 1,174.25 | 1,350.00 | | 175.75 | 14.97 | | | |
| | | 24/07/06 | 2/04/07 | 252 | 1,395.05 | 2,035.45 | | 640.40 | 45.91 | | | 67.74 |
| Anheuser-Busch InBev | | 11/05/09 | 25/05/09 | 14 | 3,360.36 | 3,265.92 | | -94.44 | -2.81 | | | |
| | | 22/06/09 | 29/06/09 | 7 | 3,237.33 | 3,474.64 | | 237.30 | 7.33 | | | |
| | | 20/07/09 | 11/01/10 | 175 | 3,655.03 | 4,713.26 | | 1,058.23 | 28.95 | | | |
| | | 24/09/12 | 10/12/12 | 77 | 6,798.16 | 7,259.28 | | 461.12 | 6.78 | | | 43.64 |
| Mercedes-Benz | | 2/04/07 | 10/09/07 | 161 | 9,787.17 | 9,971.03 | | 183.86 | 1.88 | | | |
| | | 7/12/20 | 12/07/21 | 217 | 7,276.60 | 9,585.34 | | 2,308.73 | 31.73 | | | 34.20 |
| Novo Nordisk | | 22/09/14 | 20/10/14 | 28 | 2,627.07 | 2,397.13 | | -229.94 | -8.75 | | | |
| | | 6/04/15 | 24/08/15 | 140 | 3,295.94 | 3,220.67 | | -75.27 | -2.28 | | | |
| | | 28/08/23 | 4/09/23 | 7 | 13,734.53 | 13,902.27 | | 167.74 | 1.22 | | | |
| | | 2/10/23 | 23/10/23 | 21 | 13,432.88 | 14,596.70 | | 1,163.82 | 8.66 | | | |
| | | 27/11/23 | 12/08/24 | 259 | 15,511.01 | 20,750.70 | | 5,239.69 | 33.78 | | | 31.20 |
| Iberdrola | | 25/03/19 | 28/10/19 | 217 | 966.56 | 1,108.75 | | 142.20 | 14.71 | | | 14.71 |
| Airbus | | 19/03/12 | 25/06/12 | 98 | 3,333.63 | 2,654.36 | | -679.27 | -20.38 | | | |
| | | 25/03/13 | 10/02/14 | 322 | 5,086.53 | 7,316.51 | | 2,229.98 | 43.84 | | | 14.53 |
| Münchener Rück | | 26/12/22 | 12/06/23 | 168 | 42,863.61 | 48,817.34 | | 5,953.73 | 13.89 | | | 13.89 |
| Safran | | 3/05/10 | 5/07/10 | 63 | 2,394.10 | 2,284.72 | | -109.37 | -4.57 | | | |
| | | 12/07/10 | 19/07/10 | 7 | 2,435.66 | 2,288.61 | | -147.04 | -6.04 | | | |
| | | 26/07/10 | 7/02/11 | 196 | 2,401.24 | 2,846.06 | | 444.81 | 18.52 | | | |
| | | 27/08/18 | 12/11/18 | 77 | 14,510.75 | 14,275.98 | | -234.76 | -1.62 | | | 4.56 |
| instrument | L/S | date buy | date sell | days | prc buy | prc sell | | prc diff | d % | | | total |
| Deutsche Post | | 28/09/20 | 7/12/20 | 70 | 4,826.62 | 4,962.47 | | 135.84 | 2.81 | | | 2.81 |
| ING Groep | | 10/02/14 | 12/05/14 | 91 | 1,402.62 | 1,441.97 | | 39.35 | 2.81 | | | 2.81 |
| Vinci | | 14/03/16 | 4/04/16 | 21 | 8,163.18 | 8,299.06 | | 135.88 | 1.66 | | | 1.66 |
| BASF | | 18/04/11 | 18/07/11 | 91 | 7,468.71 | 7,552.16 | | 83.45 | 1.12 | | | 1.12 |
| Roche | | 25/02/19 | 18/03/19 | 21 | 30,701.68 | 31,015.73 | | 314.05 | 1.02 | | | 1.02 |
| Rio Tinto | | 24/09/07 | 12/11/07 | 49 | 8,103.03 | 10,813.93 | | 2,710.90 | 33.46 | | | |
| | | 3/12/07 | 10/12/07 | 7 | 10,286.42 | 10,835.15 | | 548.73 | 5.33 | | | |
| | | 8/06/09 | 22/06/09 | 14 | 3,809.44 | 3,199.50 | | -609.94 | -16.01 | | | |
| | | 11/01/10 | 3/05/10 | 112 | 5,381.50 | 4,535.15 | | -846.35 | -15.73 | | | -0.50 |
| BP | | 14/11/22 | 19/12/22 | 35 | 792.26 | 777.24 | | -15.02 | -1.90 | | | -1.90 |
| Enel | | 12/05/14 | 22/09/14 | 133 | 594.50 | 580.95 | | -13.55 | -2.28 | | | -2.28 |
| LVMH | | 5/06/17 | 31/07/17 | 56 | 28,638.03 | 27,770.54 | | -867.50 | -3.03 | | | |
| | | 11/06/18 | 18/06/18 | 7 | 39,066.68 | 38,087.08 | | -979.60 | -2.51 | | | -5.46 |
| Richemont | | 10/12/12 | 25/03/13 | 105 | 6,506.78 | 7,385.70 | | 878.92 | 13.51 | | | |
| | | 10/01/22 | 7/03/22 | 56 | 16,493.83 | 13,129.48 | | -3,364.35 | -20.40 | | | -9.65 |
| ASML | | 4/05/09 | 11/05/09 | 7 | 2,134.39 | 1,897.38 | | -237.01 | -11.10 | | | |
| | | 7/02/11 | 18/04/11 | 70 | 3,644.07 | 3,259.31 | | -384.75 | -10.56 | | | |
| | | 25/06/12 | 24/09/12 | 91 | 3,948.69 | 4,156.91 | | 208.22 | 5.27 | | | |
| | | 3/11/14 | 15/12/14 | 42 | 11,317.76 | 12,190.21 | | 872.45 | 7.71 | | | |
| | | 22/12/14 | 5/01/15 | 14 | 13,010.61 | 12,455.08 | | -555.53 | -4.27 | | | |
| | | 12/01/15 | 6/04/15 | 84 | 12,308.12 | 12,161.91 | | -146.21 | -1.19 | | | |
| | | 20/11/17 | 26/03/18 | 126 | 20,430.74 | 21,442.17 | | 1,011.43 | 4.95 | | | |
| | | 28/10/19 | 9/03/20 | 133 | 29,071.28 | 27,654.53 | | -1,416.75 | -4.87 | | | |
| | | 12/07/21 | 10/01/22 | 182 | 77,418.03 | 81,146.05 | | 3,728.03 | 4.82 | | | -10.76 |
| Hermes International | | 11/08/08 | 18/08/08 | 7 | 17,510.43 | 16,200.79 | | -1,309.65 | -7.48 | | | |
| | | 25/07/11 | 8/08/11 | 14 | 27,062.40 | 24,053.20 | | -3,009.20 | -11.12 | | | |
| | | 16/01/12 | 23/01/12 | 7 | 24,248.44 | 25,248.42 | | 999.97 | 4.12 | | | |
| | | 6/02/12 | 19/03/12 | 42 | 27,887.10 | 27,207.68 | | -679.43 | -2.44 | | | |
| | | 12/06/23 | 21/08/23 | 70 | 296,417.81 | 298,661.25 | | 2,243.44 | 0.76 | | | -15.83 |
Annotations
| 19/02/24 | Stoxx 50 | | | Component update: Glencore, ING and Munich Re replace Adidas, Adyen and Kering |
| 14/09/23 | Prosus | | | stock split 1:2.1796 (two-point-onesevenninesix for one) |
| 13/09/23 | Novo Nordisk | | | stock split 1:2 (two for one) |
| 18/07/22 | GlaxoSmithKline | | | demergers OTC business -> Haleon |
| 24/09/18 | Europe 50 | | | Safran replaces Imperial Brands |
| 31/05/17 | Europe 50 | | | Glencore replaces Syngenta (acquired by ChemChina) |
| 4/10/16 | AB InBev | | | acquisition of SAB Miller completed |
| 19/09/16 | Europe 50 | | | Syngenta replaces Richemont |
| 8/08/16 | Europe 50 | | | ASML and Vinci replace Credit Suisse and Deutsche Bank |
| 21/09/15 | Europe 50 | | | Imperial Tobacco and Intesa Sanpaolo replace BHP Biliton and Glencore |
| 14/09/15 | Europe 50 | | | complete analysis
ex BHP Biliton, Glencore - in Imperial Tobacco, Intesa Sanpaolo |
| 5/09/15 | Europe 50 | | | complete analysis |
| 9/07/15 | Europe 50 | | | market adjustment to index: Novo Nordisk replaces Standard Chartered |
| 22/09/14 | Europe 50 | | | BT Group and Prudential replace Ericsson and Tesco. |
|
|