| | Sat, 20th Jun 2026, 18:57UTC |
| | |

Assessment - Swiss Market Index in Pound sterling - 1/07/24 - RS = 41
⇐
| |
|
⇓instrument |
freshest |
⇓ Δday |
1/07/24 |
⇓ Δwk |
18/09/23 |
prc diff |
⇓ Δ41 |
|
∅-RS |
| |  |
 |
 |
|
L |
 |
SMI® PR |
10,394.096 |
12/08/24 |
0.07 |
10,548.077 |
-1.46 |
9,977.145 |
570.932 |
5.72 |
|
5.07 |
| | |
|
|
|
L |
|
ABB |
39.839 |
12/08/24 |
0.55 |
44.102 |
-9.67 |
29.714 |
14.388 |
48.42 |
|
32.59 |
| | |
|
|
|
L |
|
Givaudan |
3,621.481 |
12/08/24 |
-1.12 |
3,765.920 |
-3.84 |
2,557.573 |
1,208.346 |
47.25 |
|
25.12 |
| | |
|
|
|
L |
|
Logitech |
65.899 |
12/08/24 |
1.95 |
76.334 |
-13.67 |
57.737 |
18.597 |
32.21 |
|
21.40 |
| | |
|
|
|
|
|
Holcim |
66.775 |
12/08/24 |
-0.34 |
69.944 |
-4.53 |
52.483 |
17.461 |
33.27 |
|
18.78 |
| | |
|
|
|
|
|
UBS |
21.753 |
12/08/24 |
0.44 |
23.618 |
-7.89 |
21.060 |
2.558 |
12.15 |
|
11.98 |
| | |
|
|
|
L |
|
Richemont |
112.225 |
12/08/24 |
1.22 |
123.036 |
-8.79 |
107.818 |
15.218 |
14.11 |
|
9.07 |
| | |
|
|
|
|
|
Swiss Re |
91.040 |
12/08/24 |
0.10 |
98.394 |
-7.47 |
84.275 |
14.119 |
16.75 |
|
11.56 |
| | |
|
|
|
L |
|
Alcon |
69.646 |
12/08/24 |
-1.12 |
70.189 |
-0.77 |
65.491 |
4.697 |
7.17 |
|
10.74 |
| | |
|
|
|
L |
|
Geberit |
457.653 |
12/08/24 |
-0.72 |
463.255 |
-1.21 |
407.251 |
56.005 |
13.75 |
|
5.46 |
| | |
|
|
|
|
|
Swiss Life |
570.928 |
12/08/24 |
0.62 |
585.810 |
-2.54 |
512.594 |
73.216 |
14.28 |
|
11.42 |
| | |
|
|
|
L |
|
Sonova |
243.445 |
12/08/24 |
-1.52 |
245.371 |
-0.78 |
196.923 |
48.448 |
24.60 |
|
9.55 |
| | |
|
|
|
|
|
Lonza |
477.087 |
12/08/24 |
-1.80 |
427.540 |
11.59 |
381.702 |
45.838 |
12.01 |
|
9.53 |
| | |
|
|
|
L |
|
Zurich Insurance |
406.793 |
12/08/24 |
0.85 |
422.637 |
-3.75 |
383.501 |
39.136 |
10.21 |
|
7.26 |
| | |
|
|
|
|
|
Partners |
993.128 |
12/08/24 |
0.93 |
1,004.508 |
-1.13 |
926.142 |
78.366 |
8.46 |
|
3.01 |
| | |
|
|
|
L |
|
Novartis |
84.685 |
12/08/24 |
0.16 |
84.668 |
0.02 |
82.782 |
1.886 |
2.28 |
|
6.59 |
| | |
|
|
|
|
|
Sika |
216.571 |
12/08/24 |
0.04 |
223.312 |
-3.02 |
216.535 |
6.777 |
3.13 |
|
-0.38 |
| | |
|
|
|
L |
|
Roche |
243.183 |
12/08/24 |
0.25 |
218.935 |
11.08 |
232.053 |
-13.118 |
-5.65 |
|
0.51 |
| | |
|
|
|
|
|
Kühne & Nagel |
222.174 |
12/08/24 |
0.40 |
228.914 |
-2.94 |
240.284 |
-11.370 |
-4.73 |
|
-2.54 |
| | |
|
|
|
L |
|
Nestlé |
77.594 |
12/08/24 |
-0.40 |
80.431 |
-3.53 |
95.106 |
-14.675 |
-15.43 |
|
-9.40 |
| | |
|
|
|
|
|
Swisscom |
459.579 |
12/08/24 |
0.48 |
445.135 |
3.24 |
493.163 |
-48.028 |
-9.74 |
|
-4.78 |
| SMI - 20 out of 20 instruments rated - 1/07/24 / 18/09/23 - 16 did rise, Market-Ratio(41) in GBP = 80.00 % |
| Stock Exchange Currency: CHF ₣ Swiss Franc |
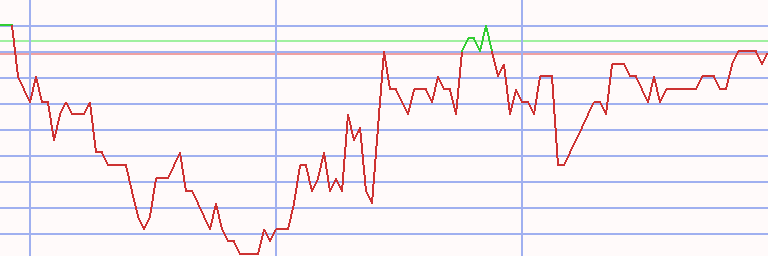
Technical Chart
Transactions Swiss Market Index in Pound sterling * A41 - 84/79 (1)
|
⇐ |
| |
| L/S | date buy | date sell | days | | instrument | spl | pieces | | prc buy | prc sell | ps short | prc diff | d % | asset | yield | |
| 2/01/06 |
9/01/06 |
7 |
|
- cash - |
| long |
9/01/06 |
30/07/07 |
567 |
|
|
|
ABB |
100 |
1,611 |
|
6.204 |
11.695 |
|
5.492 |
89 |
18,847 |
50 |
|
| short |
30/07/07 |
10/08/09 |
742 |
|
|
|
UBS |
100 |
701 |
|
26.866 |
9.038 |
79.860 |
52.994 |
197 |
55,996 |
71 |
|
| long |
10/08/09 |
17/08/09 |
7 |
|
|
|
Credit Suisse |
100 |
1,910 |
|
29.305 |
28.874 |
|
-0.431 |
-1 |
55,173 |
-54 |
|
| short |
17/08/09 |
7/09/09 |
21 |
|
|
|
Givaudan |
100 |
134 |
|
408.857 |
438.006 |
379.709 |
-29.149 |
-7 |
51,267 |
-72 |
|
| long |
7/09/09 |
21/09/09 |
14 |
|
|
|
Swiss Re |
100 |
1,906 |
|
26.896 |
27.293 |
|
0.397 |
1 |
52,023 |
46 |
|
| short |
21/09/09 |
12/10/09 |
21 |
|
|
|
Novartis |
100 |
2,089 |
|
24.899 |
26.596 |
23.202 |
-1.697 |
-7 |
48,477 |
-71 |
|
| long |
12/10/09 |
19/10/09 |
7 |
|
|
|
Swiss Re |
100 |
1,614 |
|
30.023 |
28.433 |
|
-1.590 |
-5 |
45,911 |
-94 |
|
| short |
19/10/09 |
9/11/09 |
21 |
|
|
|
Roche |
100 |
465 |
|
98.680 |
96.333 |
101.084 |
2.404 |
2 |
47,028 |
52 |
|
| long |
9/11/09 |
17/05/10 |
189 |
|
|
|
Swatch |
100 |
310 |
|
151.541 |
193.613 |
|
42.072 |
28 |
60,071 |
61 |
|
| short |
17/05/10 |
21/02/11 |
280 |
|
|
|
Actelion |
100 |
2,435 |
|
24.666 |
34.036 |
15.296 |
-9.370 |
-38 |
37,254 |
-46 |
|
| long |
21/02/11 |
28/02/11 |
7 |
|
|
|
Richemont |
100 |
1,038 |
|
35.860 |
35.518 |
|
-0.342 |
-1 |
36,899 |
-39 |
|
| short |
28/02/11 |
7/03/11 |
7 |
|
|
|
Roche |
100 |
394 |
|
93.623 |
87.808 |
99.823 |
6.200 |
7 |
39,342 |
2,732 |
|
| long |
7/03/11 |
14/03/11 |
7 |
|
|
|
Richemont |
100 |
1,082 |
|
36.360 |
34.181 |
|
-2.178 |
-6 |
36,985 |
-96 |
|
| short |
14/03/11 |
2/05/11 |
49 |
|
|
|
Roche |
100 |
422 |
|
87.493 |
98.155 |
76.832 |
-10.662 |
-12 |
32,486 |
-62 |
|
| long |
2/05/11 |
9/05/11 |
7 |
|
|
|
Richemont |
100 |
837 |
|
38.771 |
37.537 |
|
-1.233 |
-3 |
31,453 |
-81 |
|
| short |
9/05/11 |
21/05/12 |
378 |
|
|
|
Credit Suisse |
100 |
1,223 |
|
25.713 |
12.600 |
52.472 |
26.758 |
104 |
64,179 |
99 |
|
| long |
21/05/12 |
28/05/12 |
7 |
|
|
|
Richemont |
100 |
1,654 |
|
38.797 |
38.437 |
|
-0.359 |
-1 |
63,585 |
-38 |
|
| short |
28/05/12 |
4/06/12 |
7 |
|
|
|
Credit Suisse |
100 |
5,054 |
|
12.580 |
12.381 |
12.781 |
0.202 |
2 |
64,605 |
129 |
|
| long |
4/06/12 |
11/06/12 |
7 |
|
|
|
Swiss Re |
100 |
1,825 |
|
35.398 |
37.310 |
|
1.912 |
5 |
68,095 |
1,454 |
|
| short |
11/06/12 |
18/06/12 |
7 |
|
|
|
Credit Suisse |
100 |
5,231 |
|
13.016 |
11.683 |
14.502 |
1.485 |
11 |
75,864 |
27,877 |
|
| long |
18/06/12 |
19/11/12 |
154 |
|
|
|
Swiss Re |
100 |
2,022 |
|
37.515 |
44.017 |
|
6.502 |
17 |
89,011 |
46 |
|
| short |
19/11/12 |
17/12/12 |
28 |
|
|
|
Julius Bär |
100 |
4,247 |
|
20.956 |
22.239 |
19.674 |
-1.282 |
-6 |
83,565 |
-56 |
|
| long |
17/12/12 |
14/10/13 |
301 |
|
|
|
Richemont |
100 |
1,713 |
|
48.776 |
62.965 |
|
14.189 |
29 |
107,870 |
36 |
|
| short |
14/10/13 |
31/03/14 |
168 |
|
|
|
Transocean |
100 |
3,854 |
|
27.989 |
24.714 |
31.698 |
3.709 |
13 |
122,166 |
31 |
|
| long |
31/03/14 |
5/05/14 |
35 |
|
|
|
Actelion |
100 |
2,150 |
|
56.796 |
59.030 |
|
2.233 |
4 |
126,968 |
50 |
|
| L/S | date buy | date sell | days | | instrument | spl | pieces | | prc buy | prc sell | ps short | prc diff | d % | asset | yield | | | short |
5/05/14 |
3/08/15 |
455 |
|
|
|
Transocean |
100 |
4,960 |
|
25.598 |
8.407 |
77.937 |
52.340 |
204 |
386,573 |
144 |
|
| long |
3/08/15 |
17/08/15 |
14 |
|
|
|
UBS |
100 |
26,069 |
|
14.829 |
14.274 |
|
-0.555 |
-4 |
372,110 |
-63 |
|
| short |
17/08/15 |
2/11/15 |
77 |
|
|
|
Transocean |
100 |
42,345 |
|
8.787 |
10.357 |
7.217 |
-1.570 |
-18 |
305,629 |
-61 |
|
| long |
2/11/15 |
16/11/15 |
14 |
|
|
|
Actelion |
100 |
3,326 |
|
91.876 |
90.237 |
|
-1.639 |
-2 |
300,179 |
-37 |
|
| short |
16/11/15 |
9/01/17 |
420 |
|
|
|
Holcim |
100 |
8,453 |
|
35.508 |
43.466 |
27.551 |
-7.958 |
-22 |
232,913 |
-20 |
|
| long |
9/01/17 |
23/01/17 |
14 |
|
|
|
Actelion |
100 |
1,262 |
|
184.477 |
184.682 |
|
0.205 |
0 |
233,172 |
3 |
|
| short |
23/01/17 |
20/02/17 |
28 |
|
|
|
Swisscom |
100 |
662 |
|
351.745 |
360.815 |
342.675 |
-9.070 |
-3 |
227,167 |
-29 |
|
| long |
20/02/17 |
13/03/17 |
21 |
|
|
|
Actelion |
100 |
1,053 |
|
215.579 |
224.530 |
|
8.951 |
4 |
236,593 |
103 |
|
| short |
13/03/17 |
27/03/17 |
14 |
|
|
|
Givaudan |
100 |
159 |
|
1,480.890 |
1,451.028 |
1,511.367 |
30.476 |
2 |
241,439 |
70 |
|
| long |
27/03/17 |
24/04/17 |
28 |
|
|
|
Actelion |
100 |
1,094 |
|
220.563 |
220.084 |
|
-0.479 |
0 |
240,915 |
-3 |
|
| short |
24/04/17 |
8/05/17 |
14 |
|
|
|
Swisscom |
100 |
701 |
|
343.356 |
351.263 |
335.449 |
-7.907 |
-2 |
235,372 |
-46 |
|
| long |
8/05/17 |
12/02/18 |
280 |
|
|
|
Sika |
100 |
2,785 |
|
84.501 |
96.460 |
|
11.959 |
14 |
268,678 |
19 |
|
| short |
12/02/18 |
9/09/19 |
574 |
|
|
|
Roche |
100 |
1,590 |
|
168.959 |
221.939 |
115.979 |
-52.980 |
-31 |
184,440 |
-21 |
|
| long |
9/09/19 |
3/02/20 |
147 |
|
|
|
Nestlé |
100 |
2,038 |
|
90.490 |
85.204 |
|
-5.287 |
-6 |
173,666 |
-14 |
|
| short |
3/02/20 |
17/02/20 |
14 |
|
|
|
Swatch |
100 |
889 |
|
195.289 |
198.149 |
192.428 |
-2.861 |
-1 |
171,123 |
-32 |
|
| long |
17/02/20 |
2/03/20 |
14 |
|
|
|
Lonza |
100 |
523 |
|
326.695 |
319.946 |
|
-6.749 |
-2 |
167,593 |
-42 |
|
| short |
2/03/20 |
21/12/20 |
294 |
|
|
|
Swatch |
100 |
932 |
|
179.637 |
197.247 |
162.027 |
-17.610 |
-10 |
151,180 |
-12 |
|
| long |
21/12/20 |
25/10/21 |
308 |
|
|
|
Richemont |
100 |
2,297 |
|
65.794 |
88.602 |
|
22.807 |
35 |
203,569 |
42 |
|
| short |
25/10/21 |
8/11/21 |
14 |
|
|
|
Holcim |
100 |
5,684 |
|
35.812 |
38.176 |
33.448 |
-2.364 |
-7 |
190,133 |
-83 |
|
| long |
8/11/21 |
13/12/21 |
35 |
|
|
|
Partners |
100 |
142 |
|
1,333.486 |
1,214.445 |
|
-119.041 |
-9 |
173,229 |
-62 |
|
| short |
13/12/21 |
3/01/22 |
21 |
|
|
|
Credit Suisse |
100 |
24,358 |
|
7.112 |
7.338 |
6.885 |
-0.227 |
-3 |
167,707 |
-43 |
|
| long |
3/01/22 |
24/01/22 |
21 |
|
|
|
Richemont |
100 |
1,507 |
|
111.255 |
104.043 |
|
-7.212 |
-6 |
156,839 |
-69 |
|
| short |
24/01/22 |
12/06/23 |
504 |
|
|
|
Credit Suisse |
100 |
23,287 |
|
6.735 |
0.718 |
63.154 |
56.419 |
838 |
1,470,677 |
406 |
|
| 12/06/23 |
10/07/23 |
28 |
|
- cash - |
| long |
10/07/23 |
14/08/23 |
35 |
|
|
|
Richemont |
100 |
11,623 |
|
126.525 |
116.251 |
|
-10.274 |
-8 |
1,351,257 |
-59 |
|
| short |
14/08/23 |
12/08/24 |
364 |
|
|
|
Roche |
100 |
5,681 |
|
237.844 |
243.183 |
232.506 |
-5.339 |
-2 |
1,320,929 |
-2 |
|
| accum | 9/01/06 |
12/08/24 | 7439 |
days out of 7474 invested (100%) |
13,109 |
1,320,929 |
27 |
|
Instrument Related Contribution
| instrument | L/S | date buy | date sell | days | prc buy | prc sell | ps short | prc diff | d % | | | total |
| Credit Suisse | long | 10/08/09 | 17/08/09 | 7 | 29.30 | 28.87 | | -0.43 | -1.47 | | | |
| | short | 9/05/11 | 21/05/12 | 378 | 25.71 | 12.60 | 52.47 | 26.76 | 104.06 | | | |
| | short | 28/05/12 | 4/06/12 | 7 | 12.58 | 12.38 | 12.78 | 0.20 | 1.60 | | | |
| | short | 11/06/12 | 18/06/12 | 7 | 13.02 | 11.68 | 14.50 | 1.49 | 11.41 | | | |
| | short | 13/12/21 | 3/01/22 | 21 | 7.11 | 7.34 | 6.89 | -0.23 | -3.19 | | | |
| | short | 24/01/22 | 12/06/23 | 504 | 6.73 | 0.72 | 63.15 | 56.42 | 837.72 | | | 1,966.20 |
| UBS | short | 30/07/07 | 10/08/09 | 742 | 26.87 | 9.04 | 79.86 | 52.99 | 197.25 | | | |
| | long | 3/08/15 | 17/08/15 | 14 | 14.83 | 14.27 | | -0.55 | -3.74 | | | 186.13 |
| Transocean | short | 14/10/13 | 31/03/14 | 168 | 27.99 | 24.71 | 31.70 | 3.71 | 13.25 | | | |
| | short | 5/05/14 | 3/08/15 | 455 | 25.60 | 8.41 | 77.94 | 52.34 | 204.47 | | | |
| | short | 17/08/15 | 2/11/15 | 77 | 8.79 | 10.36 | 7.22 | -1.57 | -17.87 | | | 183.22 |
| ABB | long | 9/01/06 | 30/07/07 | 567 | 6.20 | 11.70 | | 5.49 | 88.53 | | | 88.53 |
| Richemont | long | 21/02/11 | 28/02/11 | 7 | 35.86 | 35.52 | | -0.34 | -0.95 | | | |
| | long | 7/03/11 | 14/03/11 | 7 | 36.36 | 34.18 | | -2.18 | -5.99 | | | |
| | long | 2/05/11 | 9/05/11 | 7 | 38.77 | 37.54 | | -1.23 | -3.18 | | | |
| | long | 21/05/12 | 28/05/12 | 7 | 38.80 | 38.44 | | -0.36 | -0.93 | | | |
| | long | 17/12/12 | 14/10/13 | 301 | 48.78 | 62.96 | | 14.19 | 29.09 | | | |
| | long | 21/12/20 | 25/10/21 | 308 | 65.79 | 88.60 | | 22.81 | 34.66 | | | |
| | long | 3/01/22 | 24/01/22 | 21 | 111.25 | 104.04 | | -7.21 | -6.48 | | | |
| | long | 10/07/23 | 14/08/23 | 35 | 126.52 | 116.25 | | -10.27 | -8.12 | | | 33.41 |
| Swiss Re | long | 7/09/09 | 21/09/09 | 14 | 26.90 | 27.29 | | 0.40 | 1.48 | | | |
| | long | 12/10/09 | 19/10/09 | 7 | 30.02 | 28.43 | | -1.59 | -5.30 | | | |
| | long | 4/06/12 | 11/06/12 | 7 | 35.40 | 37.31 | | 1.91 | 5.40 | | | |
| | long | 18/06/12 | 19/11/12 | 154 | 37.52 | 44.02 | | 6.50 | 17.33 | | | 18.85 |
| Sika | long | 8/05/17 | 12/02/18 | 280 | 84.50 | 96.46 | | 11.96 | 14.15 | | | 14.15 |
| instrument | L/S | date buy | date sell | days | prc buy | prc sell | ps short | prc diff | d % | | | total |
| Swatch | long | 9/11/09 | 17/05/10 | 189 | 151.54 | 193.61 | | 42.07 | 27.76 | | | |
| | short | 3/02/20 | 17/02/20 | 14 | 195.29 | 198.15 | 192.43 | -2.86 | -1.46 | | | |
| | short | 2/03/20 | 21/12/20 | 294 | 179.64 | 197.25 | 162.03 | -17.61 | -9.80 | | | 13.55 |
| Lonza | long | 17/02/20 | 2/03/20 | 14 | 326.70 | 319.95 | | -6.75 | -2.07 | | | -2.07 |
| Swisscom | short | 23/01/17 | 20/02/17 | 28 | 351.75 | 360.82 | 342.68 | -9.07 | -2.58 | | | |
| | short | 24/04/17 | 8/05/17 | 14 | 343.36 | 351.26 | 335.45 | -7.91 | -2.30 | | | -4.82 |
| Givaudan | short | 17/08/09 | 7/09/09 | 21 | 408.86 | 438.01 | 379.71 | -29.15 | -7.13 | | | |
| | short | 13/03/17 | 27/03/17 | 14 | 1,480.89 | 1,451.03 | 1,511.37 | 30.48 | 2.06 | | | -5.22 |
| Nestlé | long | 9/09/19 | 3/02/20 | 147 | 90.49 | 85.20 | | -5.29 | -5.84 | | | -5.84 |
| Julius Bär | short | 19/11/12 | 17/12/12 | 28 | 20.96 | 22.24 | 19.67 | -1.28 | -6.12 | | | -6.12 |
| Novartis | short | 21/09/09 | 12/10/09 | 21 | 24.90 | 26.60 | 23.20 | -1.70 | -6.82 | | | -6.82 |
| Partners | long | 8/11/21 | 13/12/21 | 35 | 1,333.49 | 1,214.45 | | -119.04 | -8.93 | | | -8.93 |
| Holcim | short | 16/11/15 | 9/01/17 | 420 | 35.51 | 43.47 | 27.55 | -7.96 | -22.41 | | | |
| | short | 25/10/21 | 8/11/21 | 14 | 35.81 | 38.18 | 33.45 | -2.36 | -6.60 | | | -27.53 |
| Actelion | short | 17/05/10 | 21/02/11 | 280 | 24.67 | 34.04 | 15.30 | -9.37 | -37.99 | | | |
| | long | 31/03/14 | 5/05/14 | 35 | 56.80 | 59.03 | | 2.23 | 3.93 | | | |
| | long | 2/11/15 | 16/11/15 | 14 | 91.88 | 90.24 | | -1.64 | -1.78 | | | |
| | long | 9/01/17 | 23/01/17 | 14 | 184.48 | 184.68 | | 0.21 | 0.11 | | | |
| | long | 20/02/17 | 13/03/17 | 21 | 215.58 | 224.53 | | 8.95 | 4.15 | | | |
| | long | 27/03/17 | 24/04/17 | 28 | 220.56 | 220.08 | | -0.48 | -0.22 | | | -34.14 |
| Roche | short | 19/10/09 | 9/11/09 | 21 | 98.68 | 96.33 | 101.08 | 2.40 | 2.44 | | | |
| | short | 28/02/11 | 7/03/11 | 7 | 93.62 | 87.81 | 99.82 | 6.20 | 6.62 | | | |
| | short | 14/03/11 | 2/05/11 | 49 | 87.49 | 98.15 | 76.83 | -10.66 | -12.19 | | | |
| | short | 12/02/18 | 9/09/19 | 574 | 168.96 | 221.94 | 115.98 | -52.98 | -31.36 | | | |
| | short | 14/08/23 | 12/08/24 | 364 | 237.84 | 243.18 | 232.51 | -5.34 | -2.24 | | | -35.64 |
Annotations
| 19/06/18 | Sika | | | stock split 1:60 (sixty for one) |
| 15/05/17 | SMI | | | Sika replaces Syngenta (acquired by ChemChina) |
| 3/05/17 | SMI | | | Lonza replaces Actelion (acquired by Johnson & Johnson) |
| 5/04/16 | SMI | | | Transocean was replaced by Swiss Life |
| 10/09/15 | SMI | | | complete analysis |
|
|