| | |
| | |

Assessment - Finance in Pound sterling - 8/01/24 - RS = 43
⇐
| |
|
⇓instrument |
freshest |
⇓ Δday |
8/01/24 |
Δwk |
13/03/23 |
prc diff |
⇓ Δ43 |
|
⇓∅-RS |
| |  |
 |
 |
|
|
 |
SOM Finance |
324.857 |
12/08/24 |
0.25 |
279.750 |
|
258.586 |
21.164 |
8.18 |
|
5.66 |
| | |
|
|
|
|
|
Banco Macro |
6.434 |
12/08/24 |
0.91 |
3.033 |
|
2.988 |
0.045 |
1.51 |
|
-14.78 |
| | |
|
|
|
|
|
Gr Fin Galicia |
4.017 |
12/08/24 |
0.48 |
1.924 |
|
1.810 |
0.113 |
6.26 |
|
-14.97 |
| | |
|
|
|
|
|
Supervielle |
1.710 |
12/08/24 |
1.14 |
0.837 |
|
0.810 |
0.027 |
3.30 |
|
-4.13 |
| | |
|
|
|
|
|
BBVA Banco Francés |
3.877 |
12/08/24 |
0.75 |
1.965 |
|
2.334 |
-0.369 |
-15.80 |
|
-25.36 |
| | |
|
|
|
L |
|
Unipol |
7.714 |
12/08/24 |
0.06 |
4.683 |
|
4.215 |
0.467 |
11.08 |
|
7.67 |
| | |
|
|
|
|
|
MS&AD Insurance |
16.408 |
9/08/24 |
-0.50 |
10.347 |
|
8.883 |
1.463 |
16.47 |
|
10.59 |
| | |
|
|
|
|
|
KB Financial |
49.270 |
12/08/24 |
0.73 |
31.174 |
|
31.858 |
-0.684 |
-2.15 |
|
-1.63 |
| | |
|
|
|
|
|
Hypoport |
222.782 |
12/08/24 |
4.68 |
142.247 |
|
103.093 |
39.154 |
37.98 |
|
14.71 |
| | |
|
|
|
L |
|
NatWest |
334.600 |
12/08/24 |
0.48 |
221.900 |
|
272.200 |
-50.300 |
-18.48 |
|
-8.88 |
| | |
|
|
|
L |
|
Hargreaves Lansdown |
1,102.000 |
12/08/24 |
|
732.400 |
|
777.600 |
-45.200 |
-5.81 |
|
-7.43 |
| | |
|
|
|
|
|
Banco de Valores |
0.328 |
12/08/24 |
-0.15 |
0.219 |
|
0.314 |
-0.095 |
-30.13 |
|
-31.22 |
| | |
|
|
|
|
|
Hana Financial |
36.131 |
12/08/24 |
0.33 |
24.635 |
|
27.044 |
-2.410 |
-8.91 |
|
-4.74 |
| | |
|
|
|
|
|
Shinhan |
32.309 |
12/08/24 |
0.19 |
22.067 |
|
22.833 |
-0.766 |
-3.35 |
|
-1.02 |
| | |
|
|
|
|
|
BPER Banca |
4.096 |
12/08/24 |
-0.27 |
2.818 |
|
2.147 |
0.671 |
31.24 |
|
18.85 |
| | |
|
|
|
|
|
Banco Sabadell |
1.537 |
12/08/24 |
0.45 |
1.061 |
|
0.961 |
0.099 |
10.34 |
|
12.92 |
| | |
|
|
|
|
|
Samsung F&M Ins |
211.710 |
12/08/24 |
1.00 |
148.107 |
|
138.072 |
10.035 |
7.27 |
|
3.20 |
| | |
|
|
|
|
|
Barclays |
220.100 |
12/08/24 |
0.85 |
154.820 |
|
147.480 |
7.340 |
4.98 |
|
0.89 |
| | |
|
|
|
|
|
Samsung Life |
53.569 |
12/08/24 |
-0.33 |
38.878 |
|
42.372 |
-3.494 |
-8.25 |
|
-7.45 |
| | |
|
|
|
|
|
Bolsas y Mercados |
0.277 |
12/08/24 |
|
0.204 |
|
0.217 |
-0.013 |
-5.77 |
|
-14.96 |
| | |
|
|
|
|
|
Unicredit |
29.713 |
12/08/24 |
0.38 |
22.338 |
|
14.941 |
7.397 |
49.51 |
|
27.39 |
| | |
|
|
|
|
|
Beazley |
732.000 |
12/08/24 |
1.24 |
552.000 |
|
545.000 |
7.000 |
1.28 |
|
-3.45 |
| | |
|
|
|
L |
|
State Bank of India |
7.672 |
12/08/24 |
-1.42 |
5.920 |
|
5.289 |
0.630 |
11.91 |
|
5.92 |
| | |
|
|
|
|
|
Banco Comercial |
0.325 |
12/08/24 |
0.16 |
0.251 |
|
0.181 |
0.069 |
38.32 |
|
23.00 |
| | |
|
|
|
|
|
Sompo |
16.111 |
9/08/24 |
0.02 |
12.852 |
|
11.616 |
1.236 |
10.64 |
|
10.32 |
| |
|
⇓instrument |
freshest |
⇓ Δday |
8/01/24 |
Δwk |
13/03/23 |
prc diff |
⇓ Δ43 |
|
⇓∅-RS |
| | |
|
|
|
|
|
American Express |
185.775 |
12/08/24 |
-0.34 |
148.283 |
|
129.406 |
18.876 |
14.59 |
|
13.55 |
| | |
|
|
|
|
|
Sumitomo Mitsui FG |
48.837 |
9/08/24 |
3.71 |
38.996 |
|
34.965 |
4.032 |
11.53 |
|
9.25 |
| | |
|
|
|
L |
|
Goldman Sachs |
380.483 |
12/08/24 |
-0.97 |
304.747 |
|
259.018 |
45.729 |
17.65 |
|
12.90 |
| | |
|
|
|
|
|
Agricultural Bank |
0.508 |
12/08/24 |
0.65 |
0.408 |
|
0.361 |
0.047 |
12.95 |
|
6.05 |
| | |
|
|
|
|
|
Intesa Sanpaolo |
2.983 |
12/08/24 |
0.54 |
2.403 |
|
2.055 |
0.347 |
16.91 |
|
13.37 |
| | |
|
|
|
L |
|
China Merchants B HK |
3.264 |
12/08/24 |
|
2.631 |
|
4.209 |
-1.578 |
-37.49 |
|
-26.85 |
| | |
|
|
|
|
|
Mediobanca |
12.059 |
12/08/24 |
0.94 |
9.755 |
|
8.193 |
1.563 |
19.07 |
|
5.03 |
| | |
|
|
|
|
|
Westpac Banking |
14.850 |
12/08/24 |
0.61 |
12.040 |
|
11.780 |
0.260 |
2.21 |
|
3.73 |
| | |
|
|
|
L |
|
China Constr Bk HK |
0.557 |
12/08/24 |
1.46 |
0.452 |
|
0.522 |
-0.071 |
-13.51 |
|
-7.02 |
| | |
|
|
|
|
|
Ind and Comm Bk |
0.656 |
12/08/24 |
1.18 |
0.535 |
|
0.528 |
0.007 |
1.36 |
|
1.24 |
| | |
|
|
|
|
|
Caixabank |
4.279 |
12/08/24 |
0.52 |
3.488 |
|
3.301 |
0.187 |
5.66 |
|
7.13 |
| | |
|
|
|
|
|
Unicaja Banco |
0.988 |
12/08/24 |
-0.86 |
0.806 |
|
0.941 |
-0.135 |
-14.37 |
|
-8.36 |
| | |
|
|
|
|
|
Insurance Australia |
3.768 |
12/08/24 |
0.56 |
3.073 |
|
2.615 |
0.458 |
17.53 |
|
7.68 |
| | |
|
|
|
|
|
Dai-ichi Life |
20.710 |
9/08/24 |
3.15 |
16.920 |
|
16.258 |
0.662 |
4.07 |
|
5.80 |
| | |
|
|
|
L |
|
ICBC |
0.450 |
12/08/24 |
2.05 |
0.370 |
|
0.436 |
-0.066 |
-15.16 |
|
-8.32 |
| | |
|
|
|
|
|
Erste Group Bank |
39.623 |
12/08/24 |
0.37 |
32.687 |
|
28.732 |
3.955 |
13.76 |
|
13.35 |
| | |
|
|
|
|
|
Resona |
4.922 |
9/08/24 |
3.93 |
4.066 |
|
4.320 |
-0.254 |
-5.87 |
|
-1.77 |
| | |
|
|
|
|
|
Suncorp-Metway |
8.862 |
12/08/24 |
1.38 |
7.325 |
|
6.775 |
0.550 |
8.11 |
|
4.63 |
| | |
|
|
|
|
|
Orix |
18.161 |
9/08/24 |
4.68 |
15.025 |
|
14.331 |
0.694 |
4.84 |
|
5.21 |
| | |
|
|
|
L |
|
Glanbia |
15.566 |
12/08/24 |
0.50 |
12.893 |
|
11.244 |
1.648 |
14.66 |
|
7.32 |
| | |
|
|
|
|
|
NN |
38.385 |
12/08/24 |
0.74 |
31.913 |
|
31.245 |
0.668 |
2.14 |
|
6.26 |
| | |
|
|
|
|
|
BNY Mellon |
49.584 |
12/08/24 |
-0.80 |
41.301 |
|
36.220 |
5.080 |
14.03 |
|
13.50 |
| | |
|
|
|
|
|
SBI Life |
16.097 |
12/08/24 |
-1.17 |
13.416 |
|
10.703 |
2.713 |
25.35 |
|
9.80 |
| | |
|
|
|
|
|
JP Morgan Chase |
161.590 |
12/08/24 |
0.19 |
134.811 |
|
107.750 |
27.061 |
25.11 |
|
16.41 |
| | |
|
|
|
|
|
ICICI Bank |
11.072 |
12/08/24 |
0.10 |
9.271 |
|
8.267 |
1.004 |
12.14 |
|
2.79 |
| |
|
⇓instrument |
freshest |
⇓ Δday |
8/01/24 |
Δwk |
13/03/23 |
prc diff |
⇓ Δ43 |
|
⇓∅-RS |
| | |
|
|
|
L |
|
Lloyds Bank |
56.800 |
12/08/24 |
-0.28 |
47.565 |
|
47.225 |
0.340 |
0.72 |
|
4.52 |
| | |
|
|
|
|
|
Euronext |
79.547 |
12/08/24 |
1.26 |
66.697 |
|
60.110 |
6.588 |
10.96 |
|
10.89 |
| | |
|
|
|
|
|
AIB |
4.294 |
12/08/24 |
-0.38 |
3.605 |
|
3.125 |
0.479 |
15.34 |
|
4.71 |
| | |
|
|
|
L |
|
Multitude |
4.744 |
12/08/24 |
-0.72 |
4.005 |
|
3.228 |
0.778 |
24.09 |
|
29.11 |
| | |
|
|
|
|
|
Bankinter |
6.269 |
12/08/24 |
0.19 |
5.310 |
|
5.230 |
0.080 |
1.54 |
|
3.15 |
| | |
|
|
|
|
|
National Australia B |
18.939 |
12/08/24 |
1.01 |
16.055 |
|
15.645 |
0.410 |
2.62 |
|
5.90 |
| | |
|
|
|
|
|
New Zealand Exchange |
0.617 |
12/08/24 |
0.80 |
0.524 |
|
0.625 |
-0.101 |
-16.15 |
|
-7.16 |
| | |
|
|
|
|
|
Woori Financial |
8.809 |
12/08/24 |
0.55 |
7.483 |
|
7.220 |
0.263 |
3.64 |
|
0.89 |
| | |
|
|
|
|
|
IBK |
8.050 |
12/08/24 |
0.37 |
6.856 |
|
6.264 |
0.592 |
9.45 |
|
4.79 |
| | |
|
|
|
|
|
Manulife Financial |
20.130 |
12/08/24 |
-0.35 |
17.156 |
|
15.164 |
1.992 |
13.14 |
|
11.90 |
| | |
|
|
|
|
|
Berkshire Hathaway |
337.294 |
12/08/24 |
-0.30 |
288.540 |
|
248.650 |
39.891 |
16.04 |
|
7.18 |
| | |
|
|
|
L |
|
Commonwealth Bank |
68.689 |
12/08/24 |
0.76 |
58.927 |
|
52.143 |
6.785 |
13.01 |
|
8.82 |
| | |
|
|
|
|
|
Sumitomo Mitsui Trst |
18.080 |
9/08/24 |
2.72 |
15.509 |
|
15.432 |
0.078 |
0.50 |
|
5.19 |
| | |
|
|
|
L |
|
Bank of China |
0.341 |
12/08/24 |
1.19 |
0.293 |
|
0.310 |
-0.017 |
-5.39 |
|
-1.96 |
| | |
|
|
|
|
|
Banca Mediolanum |
8.793 |
12/08/24 |
1.29 |
7.581 |
|
7.316 |
0.265 |
3.62 |
|
4.74 |
| | |
|
|
|
L |
|
Storebrand |
8.013 |
12/08/24 |
0.38 |
6.915 |
|
6.200 |
0.715 |
11.54 |
|
6.57 |
| | |
|
|
|
|
|
ING Groep |
13.092 |
12/08/24 |
0.21 |
11.375 |
|
10.334 |
1.041 |
10.07 |
|
5.51 |
| | |
|
|
|
L |
|
Münchener Rück |
377.492 |
12/08/24 |
1.01 |
329.189 |
|
276.384 |
52.804 |
19.11 |
|
9.51 |
| | |
|
|
|
L |
|
China Pacific Ins |
3.002 |
12/08/24 |
0.22 |
2.619 |
|
3.234 |
-0.615 |
-19.01 |
|
-15.59 |
| | |
|
|
|
|
|
Macquarie Group |
107.525 |
12/08/24 |
1.30 |
93.864 |
|
99.839 |
-5.975 |
-5.99 |
|
0.68 |
| | |
|
|
|
|
|
China Merchants Bank |
3.520 |
12/08/24 |
-0.65 |
3.083 |
|
4.203 |
-1.120 |
-26.65 |
|
-17.87 |
| | |
|
|
|
|
|
Concordia Financial |
4.158 |
9/08/24 |
3.82 |
3.654 |
|
3.312 |
0.342 |
10.33 |
|
7.34 |
| | |
|
|
|
|
|
FBD |
11.088 |
12/08/24 |
0.39 |
9.755 |
|
12.038 |
-2.282 |
-18.96 |
|
-9.35 |
| | |
|
|
|
|
|
Generali |
19.296 |
12/08/24 |
1.35 |
17.014 |
|
15.698 |
1.316 |
8.38 |
|
5.11 |
| | |
|
|
|
|
|
Banco BPM |
4.970 |
12/08/24 |
-0.31 |
4.401 |
|
3.256 |
1.145 |
35.16 |
|
19.56 |
| |
|
⇓instrument |
freshest |
⇓ Δday |
8/01/24 |
Δwk |
13/03/23 |
prc diff |
⇓ Δ43 |
|
⇓∅-RS |
| | |
|
|
|
L |
|
Verisk Analytics |
205.610 |
12/08/24 |
-0.67 |
182.373 |
|
148.559 |
33.814 |
22.76 |
|
5.95 |
| | |
|
|
|
|
|
National Bank CA |
67.112 |
12/08/24 |
0.39 |
59.587 |
|
58.789 |
0.797 |
1.36 |
|
3.59 |
| | |
|
|
|
L |
|
China Life |
3.232 |
12/08/24 |
0.44 |
2.876 |
|
4.235 |
-1.360 |
-32.10 |
|
-26.99 |
| | |
|
|
|
|
|
Credit Saison |
16.048 |
9/08/24 |
1.20 |
14.311 |
|
11.163 |
3.148 |
28.20 |
|
21.59 |
| | |
|
|
|
|
|
Mitsubishi UFJ |
7.681 |
9/08/24 |
1.22 |
6.851 |
|
5.553 |
1.298 |
23.37 |
|
14.55 |
| | |
|
|
|
L |
|
China Life Ins HK |
1.042 |
12/08/24 |
0.58 |
0.932 |
|
1.380 |
-0.448 |
-32.47 |
|
-27.36 |
| | |
|
|
|
|
|
ABN AMRO |
13.142 |
12/08/24 |
0.92 |
11.754 |
|
13.475 |
-1.722 |
-12.78 |
|
-3.99 |
| | |
|
|
|
L |
|
Bank of America |
29.914 |
12/08/24 |
-0.29 |
26.771 |
|
23.405 |
3.366 |
14.38 |
|
11.76 |
| | |
|
|
|
|
|
Aviva |
484.200 |
12/08/24 |
0.35 |
435.900 |
|
424.300 |
11.600 |
2.73 |
|
6.26 |
| | |
|
|
|
|
|
Standard Chartered |
722.000 |
12/08/24 |
0.92 |
650.000 |
|
688.800 |
-38.800 |
-5.63 |
|
-4.45 |
| | |
|
|
|
|
|
Banca Generali |
32.730 |
12/08/24 |
0.74 |
29.481 |
|
25.831 |
3.650 |
14.13 |
|
6.26 |
| | |
|
|
|
L |
|
flatexDEGIRO |
10.533 |
12/08/24 |
0.20 |
9.497 |
|
7.117 |
2.381 |
33.45 |
|
23.96 |
| | |
|
|
|
|
|
Swiss Life |
603.551 |
12/08/24 |
0.62 |
544.695 |
|
504.195 |
40.500 |
8.03 |
|
9.75 |
| | |
|
|
|
L |
|
Industrial Bank |
1.784 |
12/08/24 |
-0.55 |
1.611 |
|
1.986 |
-0.375 |
-18.87 |
|
-12.50 |
| | |
|
|
|
L |
|
Bank of China (HK) |
2.240 |
12/08/24 |
|
2.024 |
|
2.806 |
-0.783 |
-27.89 |
|
-15.26 |
| | |
|
|
|
|
|
Hiscox |
1,189.000 |
12/08/24 |
1.89 |
1,075.000 |
|
1,113.500 |
-38.500 |
-3.46 |
|
0.76 |
| | |
|
|
|
|
|
Vienna Insurance |
25.613 |
12/08/24 |
1.36 |
23.164 |
|
21.959 |
1.204 |
5.49 |
|
6.00 |
| | |
|
|
|
|
|
Nomura |
4.029 |
9/08/24 |
2.06 |
3.644 |
|
3.262 |
0.382 |
11.72 |
|
15.60 |
| | |
|
|
|
|
|
Japan Exchange |
18.069 |
9/08/24 |
4.70 |
16.364 |
|
12.493 |
3.872 |
30.99 |
|
19.25 |
| | |
|
|
|
L |
|
LSE Group |
9,938.000 |
12/08/24 |
1.12 |
9,008.000 |
|
7,294.000 |
1,714.000 |
23.50 |
|
10.24 |
| | |
|
|
|
|
|
F&C Investment Trust |
1,026.000 |
12/08/24 |
|
931.000 |
|
917.000 |
14.000 |
1.53 |
|
3.67 |
| | |
|
|
|
|
|
ANZ Banking AU |
14.850 |
12/08/24 |
0.93 |
13.503 |
|
12.822 |
0.681 |
5.31 |
|
3.59 |
| | |
|
|
|
|
|
KBC |
57.226 |
12/08/24 |
-0.21 |
52.034 |
|
54.924 |
-2.890 |
-5.26 |
|
-2.40 |
| | |
|
|
|
L |
|
Royal Bank CA |
87.254 |
12/08/24 |
-0.72 |
79.359 |
|
78.556 |
0.804 |
1.02 |
|
5.34 |
| | |
|
|
|
|
|
Mizuho |
15.136 |
9/08/24 |
2.38 |
13.876 |
|
12.400 |
1.475 |
11.90 |
|
9.34 |
| |
|
⇓instrument |
freshest |
⇓ Δday |
8/01/24 |
Δwk |
13/03/23 |
prc diff |
⇓ Δ43 |
|
⇓∅-RS |
| | |
|
|
|
|
|
Travelers Companies |
164.364 |
12/08/24 |
-1.29 |
150.712 |
|
141.384 |
9.328 |
6.60 |
|
7.61 |
| | |
|
|
|
|
|
ANZ Banking NZ |
14.709 |
12/08/24 |
0.13 |
13.495 |
|
12.979 |
0.516 |
3.98 |
|
3.56 |
| | |
|
|
|
|
|
Cdn Imp Bk Comm |
40.876 |
12/08/24 |
-0.36 |
37.574 |
|
34.003 |
3.571 |
10.50 |
|
11.82 |
| | |
|
|
|
|
|
HDFC Life |
6.632 |
12/08/24 |
0.01 |
6.097 |
|
4.780 |
1.318 |
27.57 |
|
6.12 |
| | |
|
|
|
|
|
Axa |
27.805 |
12/08/24 |
-0.77 |
25.708 |
|
24.406 |
1.301 |
5.33 |
|
5.77 |
| | |
|
|
|
|
|
OCBC |
8.164 |
12/08/24 |
0.29 |
7.556 |
|
7.416 |
0.139 |
1.88 |
|
0.09 |
| | |
|
|
|
|
|
Mastercard |
357.121 |
12/08/24 |
-0.24 |
330.703 |
|
282.990 |
47.713 |
16.86 |
|
6.61 |
| | |
|
|
|
|
|
Swiss Re |
96.242 |
12/08/24 |
0.10 |
89.635 |
|
82.464 |
7.171 |
8.70 |
|
8.09 |
| | |
|
|
|
L |
|
QBE Insurance |
8.520 |
12/08/24 |
0.87 |
7.941 |
|
8.014 |
-0.074 |
-0.92 |
|
0.23 |
| | |
|
|
|
L |
|
MLP |
4.959 |
12/08/24 |
0.87 |
4.624 |
|
4.224 |
0.400 |
9.47 |
|
4.67 |
| | |
|
|
|
|
|
Citigroup |
45.329 |
12/08/24 |
|
42.327 |
|
36.729 |
5.598 |
15.24 |
|
15.09 |
| | |
|
|
|
L |
|
St. James´s Place |
691.000 |
12/08/24 |
-1.22 |
647.800 |
|
1,156.000 |
-508.200 |
-43.96 |
|
-30.78 |
| | |
|
|
|
|
|
Ageas |
36.426 |
12/08/24 |
0.33 |
34.174 |
|
36.537 |
-2.363 |
-6.47 |
|
-0.19 |
| | |
|
|
|
|
|
Lowe´s |
181.088 |
12/08/24 |
-2.02 |
170.171 |
|
162.179 |
7.992 |
4.93 |
|
1.10 |
| | |
|
|
|
L |
|
Zurich Insurance |
430.037 |
12/08/24 |
0.85 |
404.588 |
|
381.572 |
23.016 |
6.03 |
|
5.34 |
| | |
|
|
|
|
|
Bank of Ireland |
8.090 |
12/08/24 |
-0.93 |
7.612 |
|
8.140 |
-0.528 |
-6.49 |
|
-3.79 |
| | |
|
|
|
|
|
S.E.B |
11.542 |
12/08/24 |
-0.10 |
10.864 |
|
9.199 |
1.665 |
18.10 |
|
16.07 |
| | |
|
|
|
L |
|
Hang Seng Bank |
9.229 |
12/08/24 |
0.38 |
8.717 |
|
12.471 |
-3.754 |
-30.10 |
|
-19.64 |
| | |
|
|
|
L |
|
Ping An Ins |
4.452 |
12/08/24 |
0.02 |
4.214 |
|
5.576 |
-1.362 |
-24.43 |
|
-21.22 |
| | |
|
|
|
|
|
Fukuoka |
19.817 |
9/08/24 |
5.30 |
18.771 |
|
16.973 |
1.798 |
10.59 |
|
6.45 |
| | |
|
|
|
S |
|
Grenke |
21.874 |
12/08/24 |
-2.12 |
20.757 |
|
21.412 |
-0.655 |
-3.06 |
|
-4.35 |
| | |
|
|
|
S |
|
UnitedHealth |
443.014 |
12/08/24 |
1.17 |
420.467 |
|
380.658 |
39.809 |
10.46 |
|
4.76 |
| | |
|
|
|
|
|
Mapfre |
1.834 |
12/08/24 |
|
1.743 |
|
1.680 |
0.063 |
3.75 |
|
5.14 |
| | |
|
|
|
|
|
Commerzbank |
10.675 |
12/08/24 |
0.89 |
10.164 |
|
8.784 |
1.380 |
15.71 |
|
14.17 |
| | |
|
|
|
|
|
FinecoBank |
12.407 |
12/08/24 |
0.94 |
11.818 |
|
12.219 |
-0.400 |
-3.28 |
|
3.31 |
| |
|
⇓instrument |
freshest |
⇓ Δday |
8/01/24 |
Δwk |
13/03/23 |
prc diff |
⇓ Δ43 |
|
⇓∅-RS |
| | |
|
|
|
|
|
AIG |
56.120 |
12/08/24 |
-0.62 |
53.464 |
|
41.105 |
12.359 |
30.07 |
|
13.60 |
| | |
|
|
|
|
|
Medibank Private |
2.042 |
12/08/24 |
0.52 |
1.947 |
|
1.787 |
0.160 |
8.95 |
|
7.30 |
| | |
|
|
|
|
|
Aegon |
4.781 |
12/08/24 |
0.22 |
4.564 |
|
3.845 |
0.719 |
18.70 |
|
13.20 |
| | |
|
|
|
|
|
Deutsche Bank |
11.438 |
12/08/24 |
0.14 |
10.926 |
|
8.949 |
1.977 |
22.09 |
|
21.50 |
| | |
|
|
|
|
|
Allianz |
219.946 |
12/08/24 |
|
210.191 |
|
185.947 |
24.244 |
13.04 |
|
10.05 |
| | |
|
|
|
|
|
Jyske Bank |
59.820 |
12/08/24 |
0.48 |
57.192 |
|
60.489 |
-3.297 |
-5.45 |
|
-1.62 |
| | |
|
|
|
S |
|
ASX |
34.268 |
12/08/24 |
0.73 |
32.858 |
|
36.289 |
-3.431 |
-9.46 |
|
-1.33 |
| | |
|
|
|
|
|
Wells Fargo |
40.799 |
12/08/24 |
-1.33 |
39.122 |
|
31.533 |
7.589 |
24.07 |
|
14.78 |
| | |
|
|
|
|
|
Banco Santander |
3.514 |
12/08/24 |
-0.24 |
3.377 |
|
2.949 |
0.428 |
14.51 |
|
12.86 |
| | |
|
|
|
|
|
Danske Bank |
22.873 |
12/08/24 |
0.15 |
22.009 |
|
17.154 |
4.855 |
28.30 |
|
21.09 |
| | |
|
|
|
L |
|
Axis Bank |
10.992 |
12/08/24 |
1.89 |
10.593 |
|
8.307 |
2.286 |
27.52 |
|
14.74 |
| | |
|
|
|
|
|
Banco Bilbao Viz |
7.670 |
12/08/24 |
0.27 |
7.393 |
|
5.705 |
1.688 |
29.60 |
|
20.46 |
| | |
|
|
|
|
|
DBS Bank |
20.058 |
12/08/24 |
1.22 |
19.391 |
|
19.944 |
-0.553 |
-2.77 |
|
-1.45 |
| | |
|
|
|
L |
|
Ping An |
3.379 |
12/08/24 |
0.45 |
3.269 |
|
5.466 |
-2.197 |
-40.19 |
|
-33.26 |
| | |
|
|
|
L |
|
United Overseas Bank |
17.289 |
12/08/24 |
0.58 |
16.764 |
|
17.254 |
-0.490 |
-2.84 |
|
-1.69 |
| | |
|
|
|
|
|
PayPal |
49.733 |
12/08/24 |
-1.95 |
48.385 |
|
59.609 |
-11.224 |
-18.83 |
|
-8.48 |
| | |
|
|
|
|
|
Chiba Bank |
5.843 |
9/08/24 |
3.22 |
5.688 |
|
5.650 |
0.038 |
0.68 |
|
2.26 |
| | |
|
|
|
L |
|
HSBC |
6.462 |
12/08/24 |
0.63 |
6.292 |
|
5.895 |
0.397 |
6.73 |
|
4.15 |
| | |
|
|
|
|
|
Uniqa |
6.601 |
12/08/24 |
0.26 |
6.446 |
|
7.037 |
-0.591 |
-8.40 |
|
-3.32 |
| | |
|
|
|
|
|
Mandatum |
3.627 |
12/08/24 |
|
3.543 |
|
|
|
|
|
-na- |
| | |
|
|
|
|
|
Phoenix |
538.000 |
12/08/24 |
0.47 |
525.800 |
|
592.000 |
-66.200 |
-11.18 |
|
-2.48 |
| | |
|
|
|
|
|
Sampo |
34.801 |
12/08/24 |
0.40 |
34.118 |
|
37.569 |
-3.451 |
-9.18 |
|
-6.19 |
| | |
|
|
|
|
|
Talanx |
57.157 |
12/08/24 |
1.92 |
56.039 |
|
37.057 |
18.982 |
51.22 |
|
22.73 |
| | |
|
|
|
L |
|
Morgan Stanley |
74.325 |
12/08/24 |
0.13 |
73.283 |
|
72.235 |
1.048 |
1.45 |
|
6.32 |
| | |
|
|
|
|
|
Quálitas |
7.673 |
12/08/24 |
-2.49 |
7.570 |
|
4.882 |
2.688 |
55.06 |
|
34.79 |
| |
|
⇓instrument |
freshest |
⇓ Δday |
8/01/24 |
Δwk |
13/03/23 |
prc diff |
⇓ Δ43 |
|
⇓∅-RS |
| | |
|
|
|
|
|
Tryg |
17.128 |
12/08/24 |
0.61 |
16.932 |
|
17.462 |
-0.530 |
-3.04 |
|
-0.39 |
| | |
|
|
|
|
|
Hannover Rück |
195.450 |
12/08/24 |
5.23 |
193.473 |
|
148.202 |
45.272 |
30.55 |
|
14.32 |
| | |
|
|
|
|
|
ASR |
37.689 |
12/08/24 |
0.46 |
37.388 |
|
35.055 |
2.333 |
6.66 |
|
7.87 |
| | |
|
|
|
L |
|
HSBC |
643.900 |
12/08/24 |
0.22 |
640.000 |
|
568.100 |
71.900 |
12.66 |
|
5.92 |
| | |
|
|
|
|
|
MetLife |
54.741 |
12/08/24 |
-0.40 |
54.482 |
|
48.403 |
6.079 |
12.56 |
|
10.37 |
| | |
|
|
|
|
|
Swedbank |
15.861 |
12/08/24 |
-0.86 |
15.846 |
|
14.953 |
0.893 |
5.97 |
|
10.81 |
| | |
|
|
|
|
|
Shizuoka Financial |
6.780 |
9/08/24 |
2.17 |
6.788 |
|
6.199 |
0.590 |
9.51 |
|
7.27 |
| | |
|
|
|
L |
|
HDFC Bank |
15.673 |
12/08/24 |
0.60 |
15.705 |
|
15.654 |
0.051 |
0.32 |
|
0.29 |
| | |
|
|
|
L |
|
Singapore Exchange |
5.767 |
12/08/24 |
-0.51 |
5.791 |
|
5.263 |
0.527 |
10.02 |
|
2.67 |
| | |
|
|
|
L |
|
Julius Bär |
44.123 |
12/08/24 |
0.87 |
44.355 |
|
50.780 |
-6.425 |
-12.65 |
|
-12.82 |
| | |
|
|
|
S |
|
DNB |
16.230 |
12/08/24 |
0.14 |
16.358 |
|
14.877 |
1.481 |
9.96 |
|
7.35 |
| | |
|
|
|
|
|
Admiral Group |
2,698.000 |
12/08/24 |
0.86 |
2,721.000 |
|
1,912.000 |
809.000 |
42.31 |
|
18.89 |
| | |
|
|
|
|
|
Deutsche Börse |
159.136 |
12/08/24 |
0.54 |
160.684 |
|
146.129 |
14.554 |
9.96 |
|
9.79 |
| | |
|
|
|
|
|
Credit Agricole |
11.350 |
12/08/24 |
0.57 |
11.466 |
|
9.420 |
2.045 |
21.71 |
|
16.97 |
| | |
|
|
|
|
|
Visa |
203.674 |
12/08/24 |
0.05 |
205.751 |
|
176.069 |
29.682 |
16.86 |
|
8.99 |
| | |
|
|
|
|
|
Capital One |
103.542 |
12/08/24 |
-1.56 |
104.788 |
|
76.611 |
28.177 |
36.78 |
|
25.09 |
| | |
|
|
|
S |
|
Citic Secs |
2.068 |
12/08/24 |
-0.11 |
2.128 |
|
2.414 |
-0.286 |
-11.83 |
|
-11.98 |
| | |
|
|
|
L |
|
Kotak Mahindra Bank |
16.735 |
12/08/24 |
0.16 |
17.240 |
|
16.705 |
0.535 |
3.20 |
|
-1.96 |
| | |
|
|
|
|
|
UBS |
22.996 |
12/08/24 |
0.44 |
23.690 |
|
15.968 |
7.722 |
48.36 |
|
31.65 |
| | |
|
|
|
|
|
Daiwa Securities |
5.271 |
9/08/24 |
0.70 |
5.473 |
|
3.916 |
1.556 |
39.74 |
|
30.30 |
| | |
|
|
|
|
|
Adyen |
943.731 |
12/08/24 |
1.14 |
983.440 |
|
1,152.630 |
-169.190 |
-14.68 |
|
0.03 |
| | |
|
|
|
S |
|
Sun Life Financial |
38.677 |
12/08/24 |
-0.11 |
40.307 |
|
37.462 |
2.846 |
7.60 |
|
1.76 |
| | |
|
|
|
|
|
Bank Nova Scotia |
36.066 |
12/08/24 |
-3.42 |
37.650 |
|
39.353 |
-1.702 |
-4.33 |
|
-2.58 |
| | |
|
|
|
|
|
Inbursa |
2.061 |
12/08/24 |
-2.28 |
2.167 |
|
1.698 |
0.469 |
27.60 |
|
21.24 |
| | |
|
|
|
|
|
U.S. Bancorp |
32.500 |
12/08/24 |
-1.43 |
34.451 |
|
29.998 |
4.454 |
14.85 |
|
17.31 |
| |
|
⇓instrument |
freshest |
⇓ Δday |
8/01/24 |
Δwk |
13/03/23 |
prc diff |
⇓ Δ43 |
|
⇓∅-RS |
| | |
|
|
|
|
|
Man Group |
214.000 |
12/08/24 |
0.28 |
227.700 |
|
268.800 |
-41.100 |
-15.29 |
|
1.07 |
| | |
|
|
|
|
|
BNP Paribas |
50.925 |
12/08/24 |
|
54.269 |
|
49.518 |
4.751 |
9.59 |
|
6.82 |
| | |
|
|
|
S |
|
DWS |
28.484 |
12/08/24 |
0.61 |
30.461 |
|
25.381 |
5.080 |
20.01 |
|
15.07 |
| | |
|
|
|
L |
|
HK Exchgs & Clrg |
23.259 |
12/08/24 |
0.96 |
24.886 |
|
33.967 |
-9.082 |
-26.74 |
|
-20.69 |
| | |
|
|
|
|
|
Nordea Bank |
9.175 |
12/08/24 |
-0.13 |
9.875 |
|
9.524 |
0.351 |
3.68 |
|
10.29 |
| | |
|
|
|
S |
|
Svenska Handelsbank |
7.823 |
12/08/24 |
0.29 |
8.463 |
|
7.889 |
0.574 |
7.27 |
|
15.88 |
| | |
|
|
|
|
|
Bajaj Finserv |
14.719 |
12/08/24 |
-0.08 |
16.015 |
|
12.931 |
3.084 |
23.85 |
|
11.38 |
| | |
|
|
|
L |
|
Nordea Bank |
8.956 |
12/08/24 |
-0.19 |
9.889 |
|
9.517 |
0.372 |
3.91 |
|
10.41 |
| | |
|
|
|
S |
|
Toronto-Dominion |
46.049 |
12/08/24 |
0.19 |
50.965 |
|
48.413 |
2.552 |
5.27 |
|
2.75 |
| | |
|
|
|
L |
|
W&W |
10.400 |
12/08/24 |
-0.49 |
11.552 |
|
14.904 |
-3.352 |
-22.49 |
|
-13.36 |
| | |
|
|
|
S |
|
Legal & General |
225.600 |
12/08/24 |
0.53 |
250.600 |
|
241.300 |
9.300 |
3.85 |
|
7.23 |
| | |
|
|
|
L |
|
DFV |
5.329 |
12/08/24 |
-0.80 |
5.931 |
|
7.849 |
-1.918 |
-24.44 |
|
-11.03 |
| | |
|
|
|
S |
|
M&G |
203.900 |
12/08/24 |
1.09 |
227.400 |
|
206.600 |
20.800 |
10.07 |
|
13.91 |
| | |
|
|
|
S |
|
Molina Healthcare |
264.630 |
12/08/24 |
-0.15 |
296.056 |
|
216.477 |
79.579 |
36.76 |
|
19.08 |
| | |
|
|
|
|
|
permanent tsb |
1.328 |
12/08/24 |
1.31 |
1.487 |
|
2.152 |
-0.665 |
-30.90 |
|
-18.48 |
| | |
|
|
|
|
|
Raiffeisen Bank Int |
14.276 |
12/08/24 |
1.59 |
16.107 |
|
13.017 |
3.090 |
23.74 |
|
27.68 |
| | |
|
|
|
L |
|
Abrdn |
152.950 |
12/08/24 |
2.51 |
172.750 |
|
211.200 |
-38.450 |
-18.21 |
|
-9.02 |
| | |
|
|
|
S |
|
Banco del Bajio |
2.425 |
12/08/24 |
0.64 |
2.778 |
|
2.890 |
-0.112 |
-3.89 |
|
5.09 |
| | |
|
|
|
S |
|
Bolsa Mexicana |
1.382 |
12/08/24 |
-0.17 |
1.596 |
|
1.580 |
0.016 |
1.01 |
|
-0.67 |
| | |
|
|
|
|
|
Azimut |
17.964 |
12/08/24 |
1.41 |
20.800 |
|
17.545 |
3.255 |
18.55 |
|
14.62 |
| | |
|
|
|
L |
|
Bajaj Finance |
62.388 |
12/08/24 |
-0.15 |
73.036 |
|
58.218 |
14.818 |
25.45 |
|
10.20 |
| | |
|
|
|
S |
|
Bank Montreal |
65.605 |
12/08/24 |
-0.10 |
77.247 |
|
71.590 |
5.658 |
7.90 |
|
8.67 |
| | |
|
|
|
S |
|
KakaoBank |
13.049 |
12/08/24 |
1.39 |
15.498 |
|
15.454 |
0.044 |
0.28 |
|
0.76 |
| | |
|
|
|
|
|
Societe Generale |
17.637 |
12/08/24 |
0.44 |
21.217 |
|
21.108 |
0.109 |
0.52 |
|
3.90 |
| | |
|
|
|
|
|
IndusInd Bank |
12.753 |
12/08/24 |
0.08 |
15.361 |
|
10.580 |
4.782 |
45.20 |
|
21.72 |
| |
|
⇓instrument |
freshest |
⇓ Δday |
8/01/24 |
Δwk |
13/03/23 |
prc diff |
⇓ Δ43 |
|
⇓∅-RS |
| | |
|
|
|
S |
|
Banorte |
6.419 |
12/08/24 |
0.58 |
7.755 |
|
6.483 |
1.273 |
19.63 |
|
12.79 |
| | |
|
|
|
L |
|
AIA |
5.212 |
12/08/24 |
-1.33 |
6.327 |
|
8.843 |
-2.516 |
-28.45 |
|
-18.33 |
| | |
|
|
|
S |
|
Regional |
5.915 |
12/08/24 |
-0.39 |
7.353 |
|
6.463 |
0.890 |
13.77 |
|
17.30 |
| | |
|
|
|
L |
|
Deutsche Pfandbrief |
4.249 |
12/08/24 |
0.20 |
5.290 |
|
8.003 |
-2.713 |
-33.90 |
|
-16.12 |
| | |
|
|
|
L |
|
Schroders |
337.200 |
12/08/24 |
-0.12 |
427.600 |
|
446.300 |
-18.700 |
-4.19 |
|
-2.07 |
| | |
|
|
|
S |
|
Nexi |
4.879 |
12/08/24 |
0.46 |
6.240 |
|
6.459 |
-0.219 |
-3.39 |
|
1.35 |
| | |
|
|
|
|
|
Prudential |
635.400 |
12/08/24 |
0.41 |
841.600 |
|
1,159.000 |
-317.400 |
-27.39 |
|
-18.71 |
| | |
|
|
|
L |
|
Aozora Bank |
12.879 |
9/08/24 |
3.28 |
17.208 |
|
15.438 |
1.771 |
11.47 |
|
10.00 |
| | |
|
|
|
S |
|
Heartland |
0.519 |
12/08/24 |
0.95 |
0.710 |
|
0.850 |
-0.140 |
-16.49 |
|
-13.94 |
| | |
|
|
|
L |
|
Umweltbank |
4.848 |
12/08/24 |
-1.40 |
6.962 |
|
10.098 |
-3.136 |
-31.05 |
|
-20.14 |
| | |
|
|
|
S |
|
Edenred |
30.847 |
12/08/24 |
-0.25 |
47.307 |
|
45.488 |
1.819 |
4.00 |
|
-1.03 |
| | |
|
|
|
S |
|
Scor |
14.723 |
12/08/24 |
1.06 |
22.957 |
|
17.567 |
5.390 |
30.68 |
|
3.82 |
| | |
|
|
|
L |
|
Worldline |
6.711 |
12/08/24 |
-0.79 |
12.501 |
|
33.856 |
-21.354 |
-63.07 |
|
-46.35 |
| | |
|
|
|
S |
|
KakaoPay |
14.900 |
12/08/24 |
2.67 |
27.830 |
|
38.445 |
-10.615 |
-27.61 |
|
-9.85 |
| | |
|
|
|
S |
|
creditshelf |
0.043 |
12/08/24 |
|
3.799 |
|
17.020 |
-13.221 |
-77.68 |
|
-43.69 |
| Finance - 213 out of 214 instruments rated - 8/01/24 / 13/03/23 - 146 did rise, Market-Ratio(43) in GBP = 68.54 % |
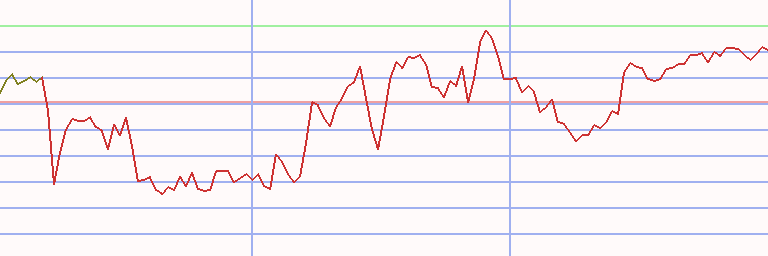
Technical Chart
Transactions Finance in Pound sterling * A43 - 90/60 (1)
|
⇐ |
| |
| L/S | date buy | date sell | days | | instrument | spl | pieces | | prc buy | prc sell | ps short | prc diff | d % | asset | yield | |
| 2/01/06 |
9/01/06 |
7 |
|
- cash - |
| long |
9/01/06 |
6/08/07 |
574 |
|
|
|
Sberbank |
100 |
2,620 |
|
3.816 |
8.060 |
|
4.244 |
111 |
21,118 |
61 |
|
| short |
6/08/07 |
16/11/09 |
833 |
|
|
|
Shinsei Bank |
100 |
125,292 |
|
0.169 |
0.072 |
0.393 |
0.225 |
133 |
49,252 |
45 |
|
| long |
16/11/09 |
24/05/10 |
189 |
|
|
|
Natixis |
100 |
13,762 |
|
3.579 |
3.038 |
|
-0.541 |
-15 |
41,813 |
-27 |
|
| short |
24/05/10 |
11/03/13 |
1022 |
|
|
|
Piraeus Financial |
100 |
0 |
|
685,659.173 |
58,943.445 |
7,975,925.086 |
7,290,265.913 |
1,063 |
41,813 |
0 |
|
| long |
11/03/13 |
24/02/14 |
350 |
|
|
|
Banco BPI |
100 |
40,806 |
|
1.025 |
1.408 |
|
0.384 |
37 |
57,466 |
39 |
|
| short |
24/02/14 |
24/04/17 |
1155 |
|
|
|
Eurobank Ergasias |
100 |
1,422 |
|
40.401 |
0.518 |
3,150.151 |
3,109.751 |
7,697 |
4,479,531 |
296 |
|
| long |
24/04/17 |
26/03/18 |
336 |
|
|
|
Caixabank |
100 |
1,286,282 |
|
3.483 |
3.329 |
|
-0.154 |
-4 |
4,281,974 |
-5 |
|
| short |
26/03/18 |
18/01/21 |
1029 |
|
|
|
Gentera |
100 |
8,430,136 |
|
0.508 |
0.342 |
0.755 |
0.247 |
49 |
6,363,067 |
15 |
|
| long |
18/01/21 |
28/02/22 |
406 |
|
|
|
Hanwha Life |
100 |
3228,033,674 |
|
0.002 |
0.002 |
|
-0.000 |
-7 |
5,926,888 |
-6 |
|
| short |
28/02/22 |
12/08/24 |
896 |
|
|
|
PayPal |
100 |
70,932 |
|
83.557 |
50.198 |
139.082 |
55.525 |
66 |
9,865,406 |
23 |
|
| accum | 9/01/06 |
12/08/24 | 7461 |
days out of 7468 invested (100%) |
98,554 |
9,865,406 |
40 |
|
Instrument Related Contribution
| instrument | L/S | date buy | date sell | days | prc buy | prc sell | ps short | prc diff | d % | | | total |
| Eurobank Ergasias | short | 24/02/14 | 24/04/17 | 1155 | 40.40 | 0.52 | 3,150.15 | 3,109.75 | 7,697.31 | | | 7,697.31 |
| Piraeus Financial | short | 24/05/10 | 11/03/13 | 1022 | 685,659.17 | 58,943.45 | 7,975,925.09 | 7,290,265.91 | 1,063.25 | | | 1,063.25 |
| Shinsei Bank | short | 6/08/07 | 16/11/09 | 833 | 0.17 | 0.07 | 0.39 | 0.22 | 133.22 | | | 133.22 |
| Sberbank | long | 9/01/06 | 6/08/07 | 574 | 3.82 | 8.06 | | 4.24 | 111.21 | | | 111.21 |
| PayPal | short | 28/02/22 | 12/08/24 | 896 | 83.56 | 50.20 | 139.08 | 55.53 | 66.45 | | | 66.45 |
| Gentera | short | 26/03/18 | 18/01/21 | 1029 | 0.51 | 0.34 | 0.75 | 0.25 | 48.60 | | | 48.60 |
| Banco BPI | long | 11/03/13 | 24/02/14 | 350 | 1.02 | 1.41 | | 0.38 | 37.44 | | | 37.44 |
| Caixabank | long | 24/04/17 | 26/03/18 | 336 | 3.48 | 3.33 | | -0.15 | -4.41 | | | -4.41 |
| Hanwha Life | long | 18/01/21 | 28/02/22 | 406 | 0.00 | 0.00 | | -0.00 | -6.85 | | | -6.85 |
| Natixis | long | 16/11/09 | 24/05/10 | 189 | 3.58 | 3.04 | | -0.54 | -15.11 | | | -15.11 |
Annotations
| 28/03/24 | MS&AD Insurance | | | stock split 1:3 (three for one) |
| | Sompo | | | stock split 1:3 (three for one) |
| 26/09/22 | Schroders | | | split 1:5 (five for one) + 3 bonus shares for 17 (is equivalent to a 17:20 split) |
| 16/05/22 | Cdn Imp Bk Comm | | | stock split 1:2 (two for one) |
| 2/09/21 | flatexDEGIRO | | | stock split 1:4 (four for one) |
| 18/09/17 | Umweltbank | | | stock split 1:5 (five for one) |
| 14/08/17 | Standard Life | | | merger with Aberdeen Asset Management completed |
| 10/07/17 | Bank of Ireland | | | reverse split 30:1 (one for thirty) |
| | Grenkeleasing | | | stock split 1:3 (three for one) |
| 23/01/17 | Unicredit | | | reverse stock split 10:1 (one for ten) |
| 24/10/16 | Banco Comercial | | | reverse stock split 75:1 (one for seventyfive) |
| 10/03/16 | W&W | | | recording started (SDAX) |
| 13/01/16 | Finanzen | | | Banca MPS, Banif, Alpha Bank, Eurobank Ergasias
Piraeus Bank and National Bank of Greece excluded |
| 31/12/15 | Heartland | | | name change from Heartland New Zealand to Heartland Bank,
ticker changes from HNZ to HBL |
| 21/12/15 | Hypoport | | | entry (SDAX) |
| 21/09/15 | Unipol | | | re-joins the MIB as replacement for Autogrill |
| 4/09/15 | Deutsche Pfandbrief | | | recording started (MDAX) |
| 25/08/15 | NN | | | recording started |
| 27/07/15 | Ping An HK | | | forward stock split 10:20 (twenty for ten) |
| | Ping An Ins | | | forward stock split 10:20 (twenty for ten) |
| 20/07/15 | PayPal | | | recording started |
| 21/06/15 | Ferratum | | | recording started |
| 19/05/15 | Svenska Handelsbank | | | ex Split 1:3 (three for one) |
| 18/05/15 | Tryg | | | forward stock split 1:5 (five for one) |
| 19/03/15 | Visa | | | forward stock split 1:4 (four for one) |
| 11/03/15 | Finance | | | neu analysis, fine performing Mixed Cut |
|
|