| | Tue, 30th Jun 2026, 8:55UTC |
| | |

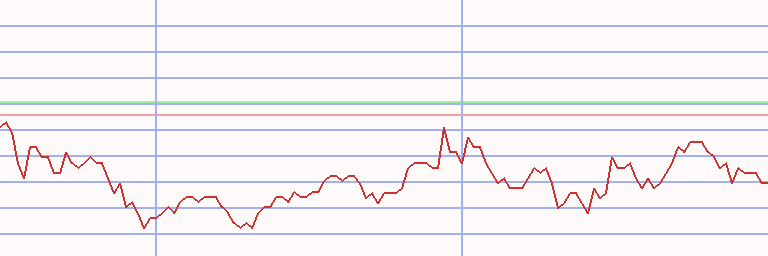
Assessment - NZX 50 Index in Pound sterling - 1/07/24 - RS = 51
⇐
| |
|
⇓instrument |
freshest |
⇓ Δday |
1/07/24 |
Δwk |
10/07/23 |
prc diff |
⇓ Δ51 |
|
⇓∅-RS |
| |  |
 |
 |
|
|
 |
NZX 50 |
5,896.363 |
12/08/24 |
0.31 |
5,660.243 |
4.17 |
5,760.093 |
-99.850 |
-1.73 |
|
1.04 |
| | |
|
|
|
S |
|
Arvida |
0.783 |
12/08/24 |
0.62 |
0.437 |
79.12 |
0.595 |
-0.158 |
-26.54 |
|
-17.77 |
| | |
|
|
|
S |
|
Oceania Healthcare |
0.370 |
12/08/24 |
|
0.259 |
42.59 |
0.367 |
-0.108 |
-29.45 |
|
-20.08 |
| | |
|
|
|
L |
|
Vista |
1.450 |
12/08/24 |
5.23 |
1.080 |
34.22 |
0.866 |
0.215 |
24.81 |
|
35.91 |
| | |
|
|
|
S |
|
Ryman Healthcare |
2.237 |
12/08/24 |
0.65 |
1.700 |
31.64 |
3.351 |
-1.651 |
-49.28 |
|
-32.80 |
| | |
|
|
|
S |
|
Skellerup |
2.161 |
12/08/24 |
3.21 |
1.772 |
21.95 |
2.229 |
-0.457 |
-20.52 |
|
-17.97 |
| | |
|
|
|
S |
|
Warehouse |
0.571 |
12/08/24 |
-0.83 |
0.471 |
21.43 |
0.909 |
-0.439 |
-48.24 |
|
-36.46 |
| | |
|
|
|
|
|
New Zealand Exchange |
0.605 |
12/08/24 |
0.80 |
0.504 |
20.00 |
0.585 |
-0.081 |
-13.84 |
|
-3.97 |
| | |
|
|
|
S |
|
Tourism |
0.999 |
12/08/24 |
1.96 |
0.859 |
16.20 |
1.726 |
-0.867 |
-50.21 |
|
-42.94 |
| | |
|
|
|
S |
|
Summerset |
5.233 |
12/08/24 |
-0.73 |
4.532 |
15.47 |
4.898 |
-0.366 |
-7.47 |
|
-7.96 |
| | |
|
|
|
S |
|
Freightways |
4.297 |
12/08/24 |
1.24 |
3.754 |
14.45 |
4.124 |
-0.370 |
-8.97 |
|
-6.69 |
| | |
|
|
|
S |
|
KMD Brands |
0.197 |
12/08/24 |
2.50 |
0.173 |
13.89 |
0.503 |
-0.330 |
-65.63 |
|
-46.43 |
| | |
|
|
|
S |
|
Investore Property |
0.557 |
12/08/24 |
|
0.490 |
13.73 |
0.687 |
-0.197 |
-28.68 |
|
-13.88 |
| | |
|
|
|
|
|
Port of Tauranga |
2.602 |
12/08/24 |
-0.91 |
2.309 |
12.68 |
2.998 |
-0.689 |
-22.97 |
|
-11.86 |
| | |
|
|
|
S |
|
Ebos |
17.337 |
12/08/24 |
0.11 |
15.436 |
12.32 |
18.108 |
-2.672 |
-14.76 |
|
-10.40 |
| | |
|
|
|
S |
|
Serko |
1.752 |
12/08/24 |
0.27 |
1.560 |
12.31 |
1.920 |
-0.359 |
-18.71 |
|
-15.63 |
| | |
|
|
|
|
|
Stride Property |
0.624 |
12/08/24 |
|
0.562 |
11.11 |
0.701 |
-0.139 |
-19.88 |
|
-12.88 |
| | |
|
|
|
|
|
Turners Automotive |
2.069 |
12/08/24 |
1.17 |
1.877 |
10.23 |
1.765 |
0.112 |
6.37 |
|
-5.78 |
| | |
|
|
|
S |
|
Precinct Properties |
0.600 |
12/08/24 |
0.81 |
0.545 |
10.13 |
0.626 |
-0.081 |
-12.97 |
|
-6.09 |
| | |
|
|
|
|
|
Kiwi Property |
0.432 |
12/08/24 |
|
0.394 |
9.76 |
0.445 |
-0.051 |
-11.50 |
|
-4.19 |
| | |
|
|
|
L |
|
Fisher & Paykel HC |
15.743 |
12/08/24 |
0.89 |
14.379 |
9.48 |
11.605 |
2.775 |
23.91 |
|
23.82 |
| | |
|
|
|
S |
|
Heartland |
0.509 |
12/08/24 |
0.95 |
0.466 |
9.28 |
0.851 |
-0.385 |
-45.28 |
|
-30.42 |
| | |
|
|
|
S |
|
Sky Network Telev. |
1.272 |
12/08/24 |
-1.85 |
1.171 |
8.61 |
1.156 |
0.016 |
1.37 |
|
-7.71 |
| | |
|
|
|
S |
|
Vital Healthcare |
0.907 |
12/08/24 |
-1.05 |
0.852 |
6.48 |
1.146 |
-0.294 |
-25.63 |
|
-17.24 |
| | |
|
|
|
S |
|
Argosy Property |
0.521 |
12/08/24 |
0.93 |
0.490 |
6.37 |
0.563 |
-0.074 |
-13.06 |
|
-9.69 |
| |
|
⇓instrument |
freshest |
⇓ Δday |
1/07/24 |
Δwk |
10/07/23 |
prc diff |
⇓ Δ51 |
|
⇓∅-RS |
| | |
|
|
|
S |
|
Spark New Zealand |
2.074 |
12/08/24 |
|
1.964 |
5.62 |
2.422 |
-0.459 |
-18.94 |
|
-16.69 |
| | |
|
|
|
S |
|
Hallenstein Glasson |
2.761 |
12/08/24 |
0.70 |
2.617 |
5.50 |
2.925 |
-0.309 |
-10.55 |
|
-6.67 |
| | |
|
|
|
L |
|
Mainfreight |
34.856 |
12/08/24 |
-0.55 |
33.248 |
4.84 |
35.118 |
-1.871 |
-5.33 |
|
2.67 |
| | |
|
|
|
S |
|
Skycity Entertainm. |
0.744 |
12/08/24 |
-0.64 |
0.711 |
4.73 |
1.102 |
-0.392 |
-35.55 |
|
-23.21 |
| | |
|
|
|
|
|
Westpac Banking |
14.653 |
12/08/24 |
0.07 |
14.067 |
4.16 |
10.894 |
3.173 |
29.13 |
|
16.46 |
| | |
|
|
|
S |
|
Air New Zealand |
0.266 |
12/08/24 |
0.91 |
0.257 |
3.74 |
0.380 |
-0.123 |
-32.33 |
|
-18.03 |
| | |
|
|
|
S |
|
Fletcher Building |
1.498 |
12/08/24 |
0.65 |
1.445 |
3.65 |
2.592 |
-1.147 |
-44.24 |
|
-30.18 |
| | |
|
|
|
L |
|
Sanford |
1.968 |
12/08/24 |
-0.49 |
1.911 |
3.02 |
1.963 |
-0.052 |
-2.66 |
|
-0.16 |
| | |
|
|
|
S |
|
Genesis Energy |
1.071 |
12/08/24 |
-1.11 |
1.039 |
3.00 |
1.303 |
-0.264 |
-20.23 |
|
-11.61 |
| | |
|
|
|
L |
|
Fonterra Shs Fund |
2.012 |
12/08/24 |
2.20 |
1.954 |
2.95 |
1.683 |
0.271 |
16.13 |
|
19.01 |
| | |
|
|
|
L |
|
a2 Milk |
3.577 |
12/08/24 |
0.95 |
3.481 |
2.76 |
2.592 |
0.889 |
34.31 |
|
36.79 |
| | |
|
|
|
|
|
Channel Infra |
0.730 |
12/08/24 |
0.66 |
0.711 |
2.70 |
0.759 |
-0.049 |
-6.40 |
|
-2.55 |
| | |
|
|
|
|
|
Chorus |
3.793 |
12/08/24 |
0.13 |
3.711 |
2.20 |
3.967 |
-0.256 |
-6.45 |
|
-0.44 |
| | |
|
|
|
S |
|
Property for Indust. |
1.051 |
12/08/24 |
0.69 |
1.032 |
1.86 |
1.156 |
-0.123 |
-10.68 |
|
-4.98 |
| | |
|
|
|
S |
|
Goodman Property |
0.975 |
12/08/24 |
-1.46 |
0.963 |
1.25 |
1.076 |
-0.113 |
-10.52 |
|
-8.10 |
| | |
|
|
|
L |
|
Manawa Energy |
1.997 |
12/08/24 |
2.46 |
1.978 |
0.97 |
2.393 |
-0.415 |
-17.36 |
|
-7.03 |
| | |
|
|
|
|
|
Vector |
1.762 |
12/08/24 |
|
1.776 |
-0.81 |
1.958 |
-0.182 |
-9.29 |
|
-3.32 |
| | |
|
|
|
S |
|
Vulcan Steel |
3.370 |
12/08/24 |
0.14 |
3.409 |
-1.13 |
4.376 |
-0.967 |
-22.10 |
|
-13.34 |
| | |
|
|
|
|
|
Gentrack |
4.849 |
12/08/24 |
2.02 |
4.945 |
-1.94 |
1.987 |
2.958 |
148.84 |
|
73.97 |
| | |
|
|
|
|
|
ANZ Banking NZ |
14.427 |
12/08/24 |
0.13 |
14.787 |
-2.44 |
12.257 |
2.530 |
20.64 |
|
8.32 |
| | |
|
|
|
S |
|
Auckland Int Airport |
3.567 |
12/08/24 |
0.68 |
3.673 |
-2.88 |
3.989 |
-0.316 |
-7.93 |
|
-5.53 |
| | |
|
|
|
|
|
Mercury |
3.092 |
12/08/24 |
-2.13 |
3.222 |
-4.02 |
3.148 |
0.074 |
2.34 |
|
4.25 |
| | |
|
|
|
L |
|
Scales |
1.608 |
12/08/24 |
|
1.680 |
-4.29 |
1.605 |
0.075 |
4.68 |
|
9.06 |
| | |
|
|
|
L |
|
Meridian Energy (NS) |
3.025 |
12/08/24 |
1.29 |
3.169 |
-4.55 |
2.698 |
0.471 |
17.44 |
|
18.44 |
| | |
|
|
|
|
|
Infratil |
5.075 |
12/08/24 |
-0.75 |
5.353 |
-5.20 |
4.946 |
0.407 |
8.22 |
|
7.68 |
| |
|
⇓instrument |
freshest |
⇓ Δday |
1/07/24 |
Δwk |
10/07/23 |
prc diff |
⇓ Δ51 |
|
⇓∅-RS |
| | |
|
|
|
L |
|
Contact Energy |
4.023 |
12/08/24 |
0.84 |
4.379 |
-8.11 |
3.946 |
0.433 |
10.98 |
|
10.47 |
| NZX 50 - 50 out of 50 instruments rated - 1/07/24 / 10/07/23 - 14 did rise, Market-Ratio(51) in GBP = 28.00 % |
| Stock Exchange Currency: NZD $ New Zealand dollar |
Technical Chart
Transactions NZX 50 Index in Pound sterling * A51 - 60/55 (1)
|
⇐ |
| |
| L/S | date buy | date sell | days | | instrument | spl | pieces | | prc buy | prc sell | ps short | prc diff | d % | asset | yield | |
| 2/01/06 |
23/01/06 |
21 |
|
- cash - |
| short |
23/01/06 |
20/03/06 |
56 |
|
|
|
a2 Milk |
100 |
325,685 |
|
0.031 |
0.022 |
0.044 |
0.013 |
42 |
14,167 |
868 |
|
| long |
20/03/06 |
10/12/07 |
630 |
|
|
|
Mainfreight |
100 |
8,756 |
|
1.618 |
2.712 |
|
1.094 |
68 |
23,747 |
35 |
|
| short |
10/12/07 |
5/10/09 |
665 |
|
|
|
Comvita |
100 |
22,172 |
|
1.071 |
0.521 |
2.203 |
1.132 |
106 |
48,841 |
49 |
|
| long |
5/10/09 |
12/10/09 |
7 |
|
|
|
Restaurant Brands |
100 |
89,180 |
|
0.548 |
0.621 |
|
0.073 |
13 |
55,390 |
70,574 |
|
| short |
12/10/09 |
19/10/09 |
7 |
|
|
|
Channel Infra |
100 |
23,663 |
|
2.341 |
2.301 |
2.381 |
0.040 |
2 |
56,336 |
142 |
|
| long |
19/10/09 |
30/11/09 |
42 |
|
|
|
Restaurant Brands |
100 |
85,173 |
|
0.661 |
0.629 |
|
-0.032 |
-5 |
53,587 |
-35 |
|
| short |
30/11/09 |
7/12/09 |
7 |
|
|
|
Channel Infra |
100 |
27,633 |
|
1.939 |
1.806 |
2.082 |
0.143 |
7 |
57,545 |
4,007 |
|
| long |
7/12/09 |
19/07/10 |
224 |
|
|
|
Restaurant Brands |
100 |
82,654 |
|
0.696 |
1.054 |
|
0.358 |
51 |
87,136 |
97 |
|
| short |
19/07/10 |
1/11/10 |
105 |
|
|
|
New Zealand Exchange |
100 |
293,164 |
|
0.297 |
0.320 |
0.274 |
-0.023 |
-8 |
80,444 |
-24 |
|
| long |
1/11/10 |
8/11/10 |
7 |
|
|
|
Restaurant Brands |
100 |
60,139 |
|
1.338 |
1.342 |
|
0.004 |
0 |
80,713 |
19 |
|
| short |
8/11/10 |
31/01/11 |
84 |
|
|
|
Fisher & Paykel HC |
100 |
56,226 |
|
1.435 |
1.551 |
1.320 |
-0.116 |
-8 |
74,208 |
-31 |
|
| long |
31/01/11 |
28/02/11 |
28 |
|
|
|
Xero |
100 |
56,342 |
|
1.317 |
1.222 |
|
-0.095 |
-7 |
68,831 |
-62 |
|
| short |
28/02/11 |
25/04/11 |
56 |
|
|
|
Heartland |
100 |
189,252 |
|
0.364 |
0.345 |
0.384 |
0.020 |
5 |
72,597 |
42 |
|
| long |
25/04/11 |
3/10/11 |
161 |
|
|
|
a2 Milk |
100 |
1,067,792 |
|
0.068 |
0.103 |
|
0.035 |
51 |
109,573 |
154 |
|
| short |
3/10/11 |
17/10/11 |
14 |
|
|
|
Heartland |
100 |
457,625 |
|
0.239 |
0.260 |
0.219 |
-0.020 |
-8 |
100,357 |
-90 |
|
| long |
17/10/11 |
31/10/11 |
14 |
|
|
|
a2 Milk |
100 |
821,677 |
|
0.122 |
0.122 |
|
0.000 |
0 |
100,415 |
2 |
|
| short |
31/10/11 |
5/03/12 |
126 |
|
|
|
Heartland |
100 |
379,235 |
|
0.265 |
0.230 |
0.304 |
0.039 |
15 |
115,363 |
49 |
|
| long |
5/03/12 |
21/05/12 |
77 |
|
|
|
a2 Milk |
100 |
595,197 |
|
0.194 |
0.215 |
|
0.021 |
11 |
128,136 |
65 |
|
| short |
21/05/12 |
30/07/12 |
70 |
|
|
|
KMD Brands |
100 |
166,359 |
|
0.770 |
0.776 |
0.765 |
-0.006 |
-1 |
127,198 |
-4 |
|
| long |
30/07/12 |
20/01/14 |
539 |
|
|
|
Xero |
100 |
46,274 |
|
2.749 |
21.394 |
|
18.645 |
678 |
989,992 |
301 |
|
| short |
20/01/14 |
2/06/14 |
133 |
|
|
|
Chorus |
100 |
1,280,853 |
|
0.773 |
0.863 |
0.683 |
-0.090 |
-12 |
874,311 |
-29 |
|
| long |
2/06/14 |
21/07/14 |
49 |
|
|
|
Tourism |
100 |
1,546,464 |
|
0.565 |
0.600 |
|
0.035 |
6 |
928,236 |
56 |
|
| short |
21/07/14 |
28/07/14 |
7 |
|
|
|
a2 Milk |
100 |
2,991,520 |
|
0.310 |
0.317 |
0.304 |
-0.007 |
-2 |
907,927 |
-68 |
|
| long |
28/07/14 |
22/02/16 |
574 |
|
|
|
Tourism |
100 |
1,541,910 |
|
0.589 |
1.206 |
|
0.617 |
105 |
1,859,453 |
58 |
|
| short |
22/02/16 |
29/02/16 |
7 |
|
|
|
ANZ Banking NZ |
100 |
155,414 |
|
11.964 |
11.466 |
12.485 |
0.520 |
4 |
1,940,291 |
820 |
|
| L/S | date buy | date sell | days | | instrument | spl | pieces | | prc buy | prc sell | ps short | prc diff | d % | asset | yield | | | long |
29/02/16 |
22/05/17 |
448 |
|
|
|
a2 Milk |
100 |
2,328,716 |
|
0.833 |
1.878 |
|
1.045 |
125 |
4,374,132 |
94 |
|
| short |
22/05/17 |
12/06/17 |
21 |
|
|
|
Comvita |
100 |
1,446,124 |
|
3.025 |
2.961 |
3.090 |
0.065 |
2 |
4,468,814 |
45 |
|
| long |
12/06/17 |
17/07/17 |
35 |
|
|
|
a2 Milk |
100 |
2,281,633 |
|
1.959 |
2.260 |
|
0.301 |
15 |
5,156,328 |
345 |
|
| short |
17/07/17 |
2/10/17 |
77 |
|
|
|
Comvita |
100 |
1,522,348 |
|
3.387 |
4.064 |
2.711 |
-0.677 |
-20 |
4,126,324 |
-65 |
|
| long |
2/10/17 |
5/03/18 |
154 |
|
|
|
a2 Milk |
100 |
1,141,780 |
|
3.614 |
6.691 |
|
3.077 |
85 |
7,639,859 |
331 |
|
| short |
5/03/18 |
12/03/18 |
7 |
|
|
|
Metro Perf Glass |
100 |
17,635,688 |
|
0.433 |
0.420 |
0.447 |
0.014 |
3 |
7,884,916 |
419 |
|
| long |
12/03/18 |
16/04/18 |
35 |
|
|
|
a2 Milk |
100 |
1,081,946 |
|
7.288 |
6.401 |
|
-0.887 |
-12 |
6,925,059 |
-74 |
|
| short |
16/04/18 |
21/05/18 |
35 |
|
|
|
Tegel |
100 |
16,453,498 |
|
0.421 |
0.585 |
0.257 |
-0.164 |
-39 |
4,228,549 |
-99 |
|
| long |
21/05/18 |
16/07/18 |
56 |
|
|
|
a2 Milk |
100 |
740,188 |
|
5.713 |
5.777 |
|
0.064 |
1 |
4,276,283 |
8 |
|
| short |
16/07/18 |
20/08/18 |
35 |
|
|
|
Comvita |
100 |
1,399,786 |
|
3.055 |
2.957 |
3.157 |
0.102 |
3 |
4,418,567 |
41 |
|
| |