| | |
| | |

Assessment - Dow Jones Transportation Average in Pound sterling - 1/07/24 - RS = 21
⇐
| |
|
⇓instrument |
freshest |
⇓ Δday |
1/07/24 |
Δwk |
5/02/24 |
prc diff |
⇓ Δ21 |
|
⇓∅-RS |
| |  |
 |
 |
|
S |
 |
DJTA |
12,062.113 |
12/08/24 |
-0.56 |
12,101.269 |
-0.32 |
12,509.649 |
-408.380 |
-3.26 |
|
-1.30 |
| | |
|
|
|
L |
|
C.H. Robinson |
78.074 |
12/08/24 |
0.20 |
68.669 |
13.70 |
59.045 |
9.624 |
16.30 |
|
3.89 |
| | |
|
|
|
|
|
Norfolk Southern |
187.615 |
12/08/24 |
-1.02 |
169.327 |
10.80 |
198.156 |
-28.829 |
-14.55 |
|
-5.23 |
| | |
|
|
|
|
|
Ryder System |
104.289 |
12/08/24 |
-1.29 |
97.051 |
7.46 |
91.885 |
5.166 |
5.62 |
|
13.95 |
| | |
|
|
|
S |
|
Old Dominion FL |
150.785 |
12/08/24 |
-1.35 |
141.356 |
6.67 |
165.252 |
-23.896 |
-14.46 |
|
-10.29 |
| | |
|
|
|
S |
|
Union Pacific |
187.275 |
12/08/24 |
-0.32 |
177.870 |
5.29 |
196.689 |
-18.819 |
-9.57 |
|
-1.66 |
| | |
|
|
|
S |
|
J.B. Hunt |
128.755 |
12/08/24 |
-0.20 |
125.520 |
2.58 |
164.862 |
-39.342 |
-23.86 |
|
-15.06 |
| | |
|
|
|
|
|
Landstar System |
146.427 |
12/08/24 |
-1.04 |
145.074 |
0.93 |
153.641 |
-8.567 |
-5.58 |
|
-1.29 |
| | |
|
|
|
|
|
Matson |
102.936 |
12/08/24 |
0.73 |
102.106 |
0.81 |
89.979 |
12.127 |
13.48 |
|
28.80 |
| | |
|
|
|
S |
|
CSX |
26.499 |
12/08/24 |
-1.47 |
26.571 |
-0.27 |
29.291 |
-2.721 |
-9.29 |
|
0.26 |
| | |
|
|
|
|
|
Expeditors Wash |
94.219 |
12/08/24 |
0.03 |
95.611 |
-1.46 |
99.341 |
-3.730 |
-3.75 |
|
0.67 |
| | |
|
|
|
|
|
Uber Technologies |
54.786 |
12/08/24 |
1.05 |
56.242 |
-2.59 |
55.018 |
1.224 |
2.23 |
|
25.53 |
| | |
|
|
|
L |
|
Kirby |
92.162 |
12/08/24 |
-0.14 |
95.754 |
-3.75 |
66.996 |
28.758 |
42.92 |
|
40.62 |
| | |
|
|
|
S |
|
FedEx |
220.815 |
12/08/24 |
0.63 |
236.264 |
-6.54 |
190.046 |
46.218 |
24.32 |
|
16.74 |
| | |
|
|
|
S |
|
UPS |
98.767 |
12/08/24 |
-0.76 |
107.540 |
-8.16 |
110.913 |
-3.373 |
-3.04 |
|
-12.57 |
| | |
|
|
|
|
|
Southwest Airlines |
20.076 |
12/08/24 |
0.20 |
22.236 |
-9.71 |
23.725 |
-1.489 |
-6.28 |
|
-4.29 |
| | |
|
|
|
S |
|
American Airlines |
7.602 |
12/08/24 |
-2.54 |
8.733 |
-12.95 |
11.372 |
-2.639 |
-23.21 |
|
-21.05 |
| | |
|
|
|
|
|
Alaska Air Group |
27.362 |
12/08/24 |
-0.26 |
31.712 |
-13.72 |
28.135 |
3.577 |
12.72 |
|
0.29 |
| | |
|
|
|
|
|
United Airlines |
31.973 |
12/08/24 |
-2.51 |
38.230 |
-16.37 |
31.907 |
6.323 |
19.82 |
|
6.73 |
| | |
|
|
|
|
|
Delta Air Lines |
30.897 |
12/08/24 |
-0.61 |
37.115 |
-16.75 |
31.293 |
5.822 |
18.61 |
|
11.49 |
| | |
|
|
|
|
|
Avis Budget |
65.742 |
12/08/24 |
-4.43 |
80.115 |
-17.94 |
124.318 |
-44.203 |
-35.56 |
|
-34.63 |
| DJTA - 20 out of 20 instruments rated - 1/07/24 / 5/02/24 - 9 did rise, Market-Ratio(21) in GBP = 45.00 % |
| Stock Exchange Currency: USD $ Dollar |
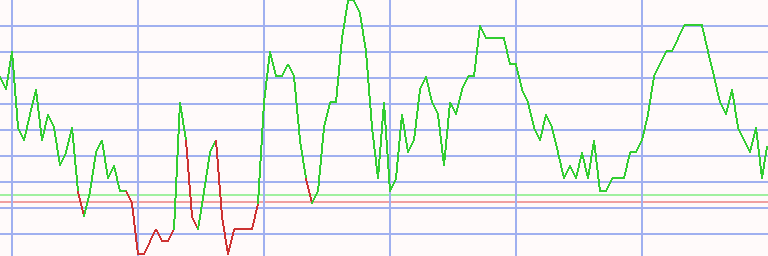
Technical Chart
Transactions Dow Jones Transportation Average in Pound sterling * A21 - 24/21 (1)
|
⇐ |
| |
| L/S | date buy | date sell | days | | instrument | spl | pieces | | prc buy | prc sell | ps short | prc diff | d % | asset | yield | |
| 2/01/06 |
7/08/06 |
217 |
|
- cash - |
| short |
7/08/06 |
14/08/06 |
7 |
|
|
|
JetBlue Airways |
100 |
1,766 |
|
5.660 |
5.324 |
6.017 |
0.357 |
6 |
10,630 |
2,327 |
|
| long |
14/08/06 |
21/08/06 |
7 |
|
|
|
C.H. Robinson |
100 |
445 |
|
23.873 |
25.503 |
|
1.631 |
7 |
11,356 |
3,036 |
|
| short |
21/08/06 |
11/09/06 |
21 |
|
|
|
JetBlue Airways |
100 |
2,117 |
|
5.363 |
5.206 |
5.525 |
0.162 |
3 |
11,699 |
68 |
|
| long |
11/09/06 |
25/09/06 |
14 |
|
|
|
United Airlines |
100 |
869 |
|
13.462 |
14.973 |
|
1.510 |
11 |
13,012 |
1,499 |
|
| short |
25/09/06 |
2/10/06 |
7 |
|
|
|
JetBlue Airways |
100 |
2,538 |
|
5.126 |
4.950 |
5.308 |
0.182 |
4 |
13,474 |
517 |
|
| long |
2/10/06 |
5/11/07 |
399 |
|
|
|
United Airlines |
100 |
904 |
|
14.899 |
21.703 |
|
6.804 |
46 |
19,625 |
41 |
|
| short |
5/11/07 |
17/12/07 |
42 |
|
|
|
JetBlue Airways |
100 |
4,794 |
|
4.094 |
3.415 |
4.906 |
0.813 |
20 |
23,522 |
383 |
|
| long |
17/12/07 |
31/12/07 |
14 |
|
|
|
Kirby |
100 |
993 |
|
23.680 |
23.278 |
|
-0.402 |
-2 |
23,123 |
-36 |
|
| short |
31/12/07 |
21/01/08 |
21 |
|
|
|
JetBlue Airways |
100 |
7,825 |
|
2.955 |
2.403 |
3.633 |
0.678 |
23 |
28,428 |
3,525 |
|
| long |
21/01/08 |
22/09/08 |
245 |
|
|
|
CSX |
100 |
11,531 |
|
2.465 |
3.414 |
|
0.949 |
38 |
39,370 |
62 |
|
| short |
22/09/08 |
1/12/08 |
70 |
|
|
|
Avis Budget |
100 |
10,452 |
|
3.767 |
0.410 |
34.615 |
30.848 |
819 |
361,797 |
> 999,999 |
|
| long |
1/12/08 |
26/01/09 |
56 |
|
|
|
Alaska Air Group |
100 |
105,083 |
|
3.443 |
4.732 |
|
1.289 |
37 |
497,204 |
694 |
|
| short |
26/01/09 |
6/04/09 |
70 |
|
|
|
Avis Budget |
100 |
868,866 |
|
0.572 |
0.539 |
0.607 |
0.035 |
6 |
527,749 |
36 |
|
| long |
6/04/09 |
1/08/11 |
847 |
|
|
|
Alaska Air Group |
100 |
155,386 |
|
3.396 |
9.142 |
|
5.746 |
169 |
1,420,547 |
53 |
|
| short |
1/08/11 |
24/10/11 |
84 |
|
|
|
Delta Air Lines |
100 |
299,157 |
|
4.748 |
5.580 |
3.917 |
-0.832 |
-18 |
1,171,772 |
-57 |
|
| long |
24/10/11 |
21/11/11 |
28 |
|
|
|
Kansas City Southern |
100 |
30,404 |
|
38.540 |
41.784 |
|
3.244 |
8 |
1,270,401 |
187 |
|
| short |
21/11/11 |
5/12/11 |
14 |
|
|
|
JetBlue Airways |
100 |
559,215 |
|
2.272 |
3.013 |
1.531 |
-0.741 |
-33 |
856,104 |
-100 |
|
| long |
5/12/11 |
25/06/12 |
203 |
|
|
|
Kirby |
100 |
20,768 |
|
41.222 |
29.166 |
|
-12.056 |
-29 |
605,723 |
-46 |
|
| short |
25/06/12 |
2/07/12 |
7 |
|
|
|
Ryder System |
100 |
27,487 |
|
22.036 |
22.482 |
21.590 |
-0.446 |
-2 |
593,461 |
-66 |
|
| long |
2/07/12 |
17/09/12 |
77 |
|
|
|
Delta Air Lines |
100 |
83,818 |
|
7.080 |
5.690 |
|
-1.390 |
-20 |
476,968 |
-65 |
|
| short |
17/09/12 |
24/09/12 |
7 |
|
|
|
Expeditors Wash |
100 |
20,105 |
|
23.724 |
22.712 |
24.780 |
1.056 |
4 |
498,202 |
869 |
|
| long |
24/09/12 |
20/07/15 |
1029 |
|
|
|
Avis Budget |
100 |
50,157 |
|
9.933 |
27.066 |
|
17.133 |
172 |
1,357,541 |
43 |
|
| short |
20/07/15 |
3/08/15 |
14 |
|
|
|
Avis Budget |
100 |
50,157 |
|
27.066 |
27.767 |
26.365 |
-0.701 |
-3 |
1,322,387 |
-50 |
|
| long |
3/08/15 |
24/08/15 |
21 |
|
|
|
JetBlue Airways |
100 |
87,376 |
|
15.134 |
13.450 |
|
-1.684 |
-11 |
1,175,238 |
-87 |
|
| short |
24/08/15 |
31/08/15 |
7 |
|
|
|
Norfolk Southern |
100 |
24,807 |
|
47.374 |
50.770 |
43.978 |
-3.396 |
-7 |
1,090,982 |
-98 |
|
| L/S | date buy | date sell | days | | instrument | spl | pieces | | prc buy | prc sell | ps short | prc diff | d % | asset | yield | | | long |
31/08/15 |
4/01/16 |
126 |
|
|
|
JetBlue Airways |
100 |
75,007 |
|
14.545 |
14.866 |
|
0.321 |
2 |
1,115,074 |
7 |
|
| short |
4/01/16 |
22/02/16 |
49 |
|
|
|
Ryder System |
100 |
28,843 |
|
38.660 |
41.466 |
35.854 |
-2.806 |
-7 |
1,034,142 |
-43 |
|
| long |
22/02/16 |
7/03/16 |
14 |
|
|
|
Delta Air Lines |
100 |
29,894 |
|
34.593 |
33.915 |
|
-0.678 |
-2 |
1,013,885 |
-40 |
|
| short |
7/03/16 |
14/03/16 |
7 |
|
|
|
Avis Budget |
100 |
51,389 |
|
19.730 |
18.887 |
20.610 |
0.881 |
4 |
1,059,136 |
875 |
|
| long |
14/03/16 |
29/10/18 |
959 |
|
|
|
Alaska Air Group |
100 |
18,983 |
|
55.793 |
47.636 |
|
-8.157 |
-15 |
904,290 |
-6 |
|
| short |
29/10/18 |
5/11/18 |
7 |
|
|
|
Avis Budget |
100 |
41,789 |
|
21.639 |
23.843 |
19.435 |
-2.204 |
-10 |
812,173 |
-100 |
|
| long |
5/11/18 |
17/12/18 |
42 |
|
|
|
United Airlines |
100 |
11,821 |
|
68.704 |
68.330 |
|
-0.374 |
-1 |
807,749 |
-5 |
|
| short |
17/12/18 |
11/03/19 |
84 |
|
|
|
Avis Budget |
100 |
40,425 |
|
19.981 |
27.664 |
12.299 |
-7.682 |
-38 |
497,196 |
-88 |
|
| long |
11/03/19 |
9/03/20 |
364 |
|
|
|
Union Pacific |
100 |
3,917 |
|
126.920 |
103.501 |
|
-23.419 |
-18 |
405,464 |
-18 |
|
| short |
9/03/20 |
8/06/20 |
91 |
|
|
|
American Airlines |
100 |
36,077 |
|
11.239 |
15.986 |
6.491 |
-4.748 |
-42 |
234,176 |
-89 |
|
| long |
8/06/20 |
15/06/20 |
7 |
|
|
|
Avis Budget |
100 |
9,216 |
|
25.408 |
20.964 |
|
-4.444 |
-17 |
193,219 |
-100 |
|
| short |
15/06/20 |
6/07/20 |
21 |
|
|
|
United Airlines |
100 |
6,227 |
|
31.028 |
28.175 |
34.171 |
3.143 |
10 |
212,789 |
435 |
|
| long |
6/07/20 |
4/10/21 |
455 |
|
|
|
J.B. Hunt |
100 |
2,200 |
|
96.695 |
121.549 |
|
24.854 |
26 |
267,468 |
20 |
|
| short |
4/10/21 |
18/10/21 |
14 |
|
|
|
FedEx |
100 |
1,671 |
|
160.031 |
165.964 |
154.098 |
-5.933 |
-4 |
257,554 |
-63 |
|
| long |
18/10/21 |
11/04/22 |
175 |
|
|
|
Avis Budget |
100 |
2,234 |
|
115.253 |
196.829 |
|
81.576 |
71 |
439,795 |
205 |
|
| short |
11/04/22 |
18/04/22 |
7 |
|
|
|
JetBlue Airways |
100 |
47,654 |
|
9.229 |
9.721 |
8.736 |
-0.493 |
-5 |
416,322 |
-94 |
|
| long |
18/04/22 |
6/06/22 |
49 |
|
|
|
Avis Budget |
100 |
2,034 |
|
204.627 |
152.780 |
|
-51.847 |
-25 |
310,865 |
-89 |
|
| short |
6/06/22 |
1/08/22 |
56 |
|
|
|
JetBlue Airways |
100 |
36,463 |
|
8.525 |
6.995 |
10.391 |
1.866 |
22 |
378,888 |
263 |
|
| long |
1/08/22 |
15/08/22 |
14 |
|
|
|
C.H. Robinson |
100 |
4,241 |
|
89.329 |
97.529 |
|
8.200 |
9 |
413,664 |
887 |
|
| short |
15/08/22 |
29/08/22 |
14 |
|
|
|
JetBlue Airways |
100 |
54,528 |
|
7.586 |
6.781 |
8.487 |
0.901 |
12 |
462,804 |
1,766 |
|
| long |
29/08/22 |
19/09/22 |
21 |
|
|
|
C.H. Robinson |
100 |
4,717 |
|
98.111 |
92.785 |
|
-5.327 |
-5 |
437,677 |
-62 |
|
| short |
19/09/22 |
7/11/22 |
49 |
|
|
|
JetBlue Airways |
100 |
61,259 |
|
7.145 |
6.664 |
7.660 |
0.515 |
7 |
469,226 |
68 |
|
| long |
7/11/22 |
2/01/23 |
56 |
|
|
|
Avis Budget |
100 |
2,252 |
|
208.319 |
135.991 |
|
-72.328 |
-35 |
306,343 |
-94 |
|
| short |
2/01/23 |
9/01/23 |
7 |
|
|
|
JetBlue Airways |
100 |
56,987 |
|
5.376 |
5.992 |
4.759 |
-0.616 |
-11 |
271,218 |
-100 |
|
| long |
9/01/23 |
12/08/24 |
581 |
|
|
|
Landstar System |
100 |
1,928 |
|
140.659 |
146.427 |
|
5.768 |
4 |
282,338 |
3 |
|
| accum | 7/08/06 |
12/08/24 | 7266 |
days out of 7483 invested (97%) |
2,723 |
282,338 |
18 |
|
Instrument Related Contribution
| instrument | L/S | date buy | date sell | days | prc buy | prc sell | ps short | prc diff | d % | | | total |
| Avis Budget | short | 22/09/08 | 1/12/08 | 70 | 3.77 | 0.41 | 34.62 | 30.85 | 818.98 | | | |
| | short | 26/01/09 | 6/04/09 | 70 | 0.57 | 0.54 | 0.61 | 0.04 | 6.14 | | | |
| | long | 24/09/12 | 20/07/15 | 1029 | 9.93 | 27.07 | | 17.13 | 172.49 | | | |
| | short | 20/07/15 | 3/08/15 | 14 | 27.07 | 27.77 | 26.36 | -0.70 | -2.59 | | | |
| | short | 7/03/16 | 14/03/16 | 7 | 19.73 | 18.89 | 20.61 | 0.88 | 4.46 | | | |
| | short | 29/10/18 | 5/11/18 | 7 | 21.64 | 23.84 | 19.43 | -2.20 | -10.19 | | | |
| | short | 17/12/18 | 11/03/19 | 84 | 19.98 | 27.66 | 12.30 | -7.68 | -38.45 | | | |
| | long | 8/06/20 | 15/06/20 | 7 | 25.41 | 20.96 | | -4.44 | -17.49 | | | |
| | long | 18/10/21 | 11/04/22 | 175 | 115.25 | 196.83 | | 81.58 | 70.78 | | | |
| | long | 18/04/22 | 6/06/22 | 49 | 204.63 | 152.78 | | -51.85 | -25.34 | | | |
| | long | 7/11/22 | 2/01/23 | 56 | 208.32 | 135.99 | | -72.33 | -34.72 | | | 926.91 |
| Alaska Air Group | long | 1/12/08 | 26/01/09 | 56 | 3.44 | 4.73 | | 1.29 | 37.43 | | | |
| | long | 6/04/09 | 1/08/11 | 847 | 3.40 | 9.14 | | 5.75 | 169.17 | | | |
| | long | 14/03/16 | 29/10/18 | 959 | 55.79 | 47.64 | | -8.16 | -14.62 | | | 215.83 |
| United Airlines | long | 11/09/06 | 25/09/06 | 14 | 13.46 | 14.97 | | 1.51 | 11.22 | | | |
| | long | 2/10/06 | 5/11/07 | 399 | 14.90 | 21.70 | | 6.80 | 45.67 | | | |
| | long | 5/11/18 | 17/12/18 | 42 | 68.70 | 68.33 | | -0.37 | -0.54 | | | |
| | short | 15/06/20 | 6/07/20 | 21 | 31.03 | 28.17 | 34.17 | 3.14 | 10.13 | | | 77.45 |
| CSX | long | 21/01/08 | 22/09/08 | 245 | 2.47 | 3.41 | | 0.95 | 38.49 | | | 38.49 |
| J.B. Hunt | long | 6/07/20 | 4/10/21 | 455 | 96.70 | 121.55 | | 24.85 | 25.70 | | | 25.70 |
| JetBlue Airways | short | 7/08/06 | 14/08/06 | 7 | 5.66 | 5.32 | 6.02 | 0.36 | 6.31 | | | |
| | short | 21/08/06 | 11/09/06 | 21 | 5.36 | 5.21 | 5.53 | 0.16 | 3.02 | | | |
| | short | 25/09/06 | 2/10/06 | 7 | 5.13 | 4.95 | 5.31 | 0.18 | 3.55 | | | |
| | short | 5/11/07 | 17/12/07 | 42 | 4.09 | 3.42 | 4.91 | 0.81 | 19.86 | | | |
| | short | 31/12/07 | 21/01/08 | 21 | 2.95 | 2.40 | 3.63 | 0.68 | 22.95 | | | |
| | short | 21/11/11 | 5/12/11 | 14 | 2.27 | 3.01 | 1.53 | -0.74 | -32.61 | | | |
| | long | 3/08/15 | 24/08/15 | 21 | 15.13 | 13.45 | | -1.68 | -11.13 | | | |
| | long | 31/08/15 | 4/01/16 | 126 | 14.54 | 14.87 | | 0.32 | 2.21 | | | |
| | short | 11/04/22 | 18/04/22 | 7 | 9.23 | 9.72 | 8.74 | -0.49 | -5.34 | | | |
| | short | 6/06/22 | 1/08/22 | 56 | 8.53 | 6.99 | 10.39 | 1.87 | 21.88 | | | |
| | short | 15/08/22 | 29/08/22 | 14 | 7.59 | 6.78 | 8.49 | 0.90 | 11.88 | | | |
| | short | 19/09/22 | 7/11/22 | 49 | 7.14 | 6.66 | 7.66 | 0.52 | 7.21 | | | |
| | short | 2/01/23 | 9/01/23 | 7 | 5.38 | 5.99 | 4.76 | -0.62 | -11.47 | | | 25.33 |
| instrument | L/S | date buy | date sell | days | prc buy | prc sell | ps short | prc diff | d % | | | total |
| C.H. Robinson | long | 14/08/06 | 21/08/06 | 7 | 23.87 | 25.50 | | 1.63 | 6.83 | | | |
| | long | 1/08/22 | 15/08/22 | 14 | 89.33 | 97.53 | | 8.20 | 9.18 | | | |
| | long | 29/08/22 | 19/09/22 | 21 | 98.11 | 92.78 | | -5.33 | -5.43 | | | 10.30 |
| Kansas City Southern | long | 24/10/11 | 21/11/11 | 28 | 38.54 | 41.78 | | 3.24 | 8.42 | | | 8.42 |
| Expeditors Wash | short | 17/09/12 | 24/09/12 | 7 | 23.72 | 22.71 | 24.78 | 1.06 | 4.45 | | | 4.45 |
| Landstar System | long | 9/01/23 | 12/08/24 | 581 | 140.66 | 146.43 | | 5.77 | 4.10 | | | 4.10 |
| FedEx | short | 4/10/21 | 18/10/21 | 14 | 160.03 | 165.96 | 154.10 | -5.93 | -3.71 | | | -3.71 |
| Norfolk Southern | short | 24/08/15 | 31/08/15 | 7 | 47.37 | 50.77 | 43.98 | -3.40 | -7.17 | | | -7.17 |
| Ryder System | short | 25/06/12 | 2/07/12 | 7 | 22.04 | 22.48 | 21.59 | -0.45 | -2.02 | | | |
| | short | 4/01/16 | 22/02/16 | 49 | 38.66 | 41.47 | 35.85 | -2.81 | -7.26 | | | -9.14 |
| Union Pacific | long | 11/03/19 | 9/03/20 | 364 | 126.92 | 103.50 | | -23.42 | -18.45 | | | -18.45 |
| Kirby | long | 17/12/07 | 31/12/07 | 14 | 23.68 | 23.28 | | -0.40 | -1.70 | | | |
| | long | 5/12/11 | 25/06/12 | 203 | 41.22 | 29.17 | | -12.06 | -29.25 | | | -30.45 |
| Delta Air Lines | short | 1/08/11 | 24/10/11 | 84 | 4.75 | 5.58 | 3.92 | -0.83 | -17.51 | | | |
| | long | 2/07/12 | 17/09/12 | 77 | 7.08 | 5.69 | | -1.39 | -19.63 | | | |
| | long | 22/02/16 | 7/03/16 | 14 | 34.59 | 33.92 | | -0.68 | -1.96 | | | -35.00 |
| American Airlines | short | 9/03/20 | 8/06/20 | 91 | 11.24 | 15.99 | 6.49 | -4.75 | -42.25 | | | -42.25 |
Annotations
| 14/03/24 | DJTA | | | Component update: Uber Technologies replaces JetBlue Airways |
| 2/01/22 | DJTA | | | Old Dominion Freight Line replaces Kansas City Southern (acquired by CP) |
| 29/06/21 | CSX | | | stock split 1:3 (three for one) |
| 15/10/15 | DJTA | | | American Airlines replaces Con-Way |
|
|