| | Mon, 3rd Aug 2026, 4:04UTC |
| | |

Assessment - STOXX Europe 50 - 27/03/23 - RS = 22
⇐
| |
|
⇓instrument |
freshest |
⇓ Δday |
27/03/23 |
Δwk |
24/10/22 |
prc diff |
⇓ Δ22 |
Curr |
⇓∅-RS |
| |  |
 |
 |
|
|
 |
Stoxx 50 |
4,344.220 |
12/08/24 |
-0.16 |
3,840.320 |
|
3,453.240 |
387.080 |
11.21 |
EUR |
5.31 |
| | |
|
|
|
|
|
Novo Nordisk |
892.900 |
12/08/24 |
-2.80 |
533.500 |
|
397.650 |
135.850 |
34.16 |
DKK |
27.62 |
| | |
|
|
|
|
|
SAP |
189.300 |
12/08/24 |
-0.33 |
114.360 |
|
91.340 |
23.020 |
25.20 |
EUR |
19.14 |
| | |
|
|
|
L |
|
ABB |
45.510 |
12/08/24 |
0.55 |
29.430 |
|
27.390 |
2.040 |
7.45 |
CHF |
3.22 |
| | |
|
|
|
|
|
Schneider Electric |
211.250 |
12/08/24 |
0.38 |
144.980 |
|
127.600 |
17.380 |
13.62 |
EUR |
9.44 |
| | |
|
|
|
|
|
ING Groep |
15.232 |
12/08/24 |
0.21 |
10.542 |
|
9.845 |
0.697 |
7.08 |
EUR |
3.16 |
| | |
|
|
|
|
|
UBS |
24.850 |
12/08/24 |
0.44 |
17.445 |
|
15.135 |
2.310 |
15.26 |
CHF |
3.59 |
| | |
|
|
|
|
|
Safran |
192.200 |
12/08/24 |
-0.18 |
135.140 |
|
109.480 |
25.660 |
23.44 |
EUR |
24.60 |
| | |
|
|
|
L |
|
Münchener Rück |
439.200 |
12/08/24 |
1.01 |
317.000 |
|
262.900 |
54.100 |
20.58 |
EUR |
22.46 |
| | |
|
|
|
|
|
RELX |
3,531.000 |
12/08/24 |
0.57 |
2,586.000 |
|
2,262.000 |
324.000 |
14.32 |
GBP |
10.98 |
| | |
|
|
|
|
|
ASML |
784.600 |
12/08/24 |
0.08 |
605.200 |
|
477.950 |
127.250 |
26.62 |
EUR |
15.18 |
| | |
|
|
|
|
|
Shell |
33.025 |
12/08/24 |
0.93 |
25.540 |
|
26.810 |
-1.270 |
-4.74 |
EUR |
-3.61 |
| | |
|
|
|
|
|
EssilorLuxottica |
207.300 |
12/08/24 |
-0.58 |
162.600 |
|
160.050 |
2.550 |
1.59 |
EUR |
2.03 |
| | |
|
|
|
|
|
Allianz |
255.900 |
12/08/24 |
|
205.600 |
|
176.680 |
28.920 |
16.37 |
EUR |
6.26 |
| | |
|
|
|
|
|
Banco Santander |
4.089 |
12/08/24 |
-0.24 |
3.290 |
|
2.724 |
0.566 |
20.78 |
EUR |
17.24 |
| | |
|
|
|
|
|
Axa |
32.350 |
12/08/24 |
-0.77 |
26.960 |
|
24.835 |
2.125 |
8.56 |
EUR |
7.79 |
| | |
|
|
|
L |
|
HSBC |
643.900 |
12/08/24 |
0.22 |
541.100 |
|
475.100 |
66.000 |
13.89 |
GBP |
3.14 |
| | |
|
|
|
|
|
TotalEnergies |
61.720 |
12/08/24 |
0.60 |
52.130 |
|
53.500 |
-1.370 |
-2.56 |
EUR |
-1.50 |
| | |
|
|
|
|
|
Enel |
6.438 |
12/08/24 |
0.44 |
5.464 |
|
4.294 |
1.171 |
27.26 |
EUR |
4.65 |
| | |
|
|
|
L |
|
Novartis |
96.740 |
12/08/24 |
0.16 |
82.250 |
|
77.980 |
4.270 |
5.48 |
CHF |
0.52 |
| | |
|
|
|
|
|
BNP Paribas |
59.250 |
12/08/24 |
|
51.790 |
|
46.965 |
4.825 |
10.27 |
EUR |
1.70 |
| | |
|
|
|
L |
|
AstraZeneca |
12,780.000 |
12/08/24 |
0.63 |
11,252.000 |
|
9,782.000 |
1,470.000 |
15.03 |
GBP |
5.32 |
| | |
|
|
|
L |
|
Deutsche Telekom |
24.730 |
12/08/24 |
0.49 |
21.830 |
|
18.306 |
3.524 |
19.25 |
EUR |
15.36 |
| | |
|
|
|
|
|
Airbus |
133.760 |
12/08/24 |
-0.45 |
119.080 |
|
102.540 |
16.540 |
16.13 |
EUR |
11.79 |
| | |
|
|
|
L |
|
Unilever Plc |
4,714.000 |
12/08/24 |
-0.34 |
4,220.500 |
|
3,921.500 |
299.000 |
7.62 |
GBP |
7.99 |
| |
|
⇓instrument |
freshest |
⇓ Δday |
27/03/23 |
Δwk |
24/10/22 |
prc diff |
⇓ Δ22 |
Curr |
⇓∅-RS |
| | |
|
|
|
|
|
Hermes International |
2,006.000 |
12/08/24 |
-0.50 |
1,806.000 |
|
1,292.000 |
514.000 |
39.78 |
EUR |
37.22 |
| | |
|
|
|
|
|
Siemens |
157.200 |
12/08/24 |
0.01 |
141.660 |
|
109.840 |
31.820 |
28.97 |
EUR |
20.14 |
| | |
|
|
|
|
|
GSK |
1,572.000 |
12/08/24 |
0.42 |
1,423.600 |
|
1,387.400 |
36.200 |
2.61 |
GBP |
-6.18 |
| | |
|
|
|
L |
|
Zurich Insurance |
464.700 |
12/08/24 |
0.85 |
421.400 |
|
417.200 |
4.200 |
1.01 |
CHF |
-2.45 |
| | |
|
|
|
S |
|
Air Liquide |
162.300 |
12/08/24 |
-0.79 |
149.860 |
|
124.220 |
25.640 |
20.64 |
EUR |
8.17 |
| | |
|
|
|
L |
|
Iberdrola |
12.105 |
12/08/24 |
0.29 |
11.185 |
|
9.682 |
1.503 |
15.52 |
EUR |
6.53 |
| | |
|
|
|
L |
|
Roche |
277.800 |
12/08/24 |
0.25 |
256.900 |
|
327.150 |
-70.250 |
-21.47 |
CHF |
-18.33 |
| | |
|
|
|
L |
|
Prosus |
32.850 |
12/08/24 |
1.77 |
30.700 |
|
18.630 |
12.070 |
64.79 |
EUR |
17.19 |
| | |
|
|
|
S |
|
Vinci |
102.650 |
12/08/24 |
-0.77 |
102.180 |
|
88.630 |
13.550 |
15.29 |
EUR |
9.22 |
| | |
|
|
|
|
|
Sanofi |
95.670 |
12/08/24 |
-0.60 |
98.440 |
|
82.190 |
16.250 |
19.77 |
EUR |
8.80 |
| | |
|
|
|
L |
|
BAT |
2,801.000 |
12/08/24 |
|
2,885.500 |
|
3,379.500 |
-494.000 |
-14.62 |
GBP |
-13.16 |
| | |
|
|
|
|
|
Anheuser-Busch InBev |
55.200 |
12/08/24 |
-0.47 |
58.140 |
|
47.155 |
10.985 |
23.30 |
EUR |
9.87 |
| | |
|
|
|
|
|
Rio Tinto |
4,942.000 |
12/08/24 |
0.56 |
5,232.000 |
|
4,750.000 |
482.000 |
10.15 |
GBP |
-2.32 |
| | |
|
|
|
|
|
L´Oreal |
376.650 |
12/08/24 |
-1.59 |
400.650 |
|
316.100 |
84.550 |
26.75 |
EUR |
15.69 |
| | |
|
|
|
S |
|
National Grid |
978.400 |
12/08/24 |
-0.04 |
1,068.000 |
|
921.000 |
147.000 |
15.96 |
GBP |
0.45 |
| | |
|
|
|
|
|
Glencore |
410.250 |
12/08/24 |
1.27 |
449.600 |
|
501.900 |
-52.300 |
-10.42 |
GBP |
-9.40 |
| | |
|
|
|
L |
|
Richemont |
128.200 |
12/08/24 |
1.22 |
141.150 |
|
100.650 |
40.500 |
40.24 |
CHF |
24.63 |
| | |
|
|
|
S |
|
BASF |
41.280 |
12/08/24 |
-0.22 |
45.930 |
|
46.595 |
-0.665 |
-1.43 |
EUR |
-2.00 |
| | |
|
|
|
|
|
BP |
439.600 |
12/08/24 |
1.35 |
496.400 |
|
470.000 |
26.400 |
5.62 |
GBP |
11.72 |
| | |
|
|
|
|
|
Deutsche Post |
36.040 |
12/08/24 |
-0.36 |
41.480 |
|
34.675 |
6.805 |
19.63 |
EUR |
10.23 |
| | |
|
|
|
L |
|
Nestlé |
88.640 |
12/08/24 |
-0.40 |
109.540 |
|
107.120 |
2.420 |
2.26 |
CHF |
-2.89 |
| | |
|
|
|
S |
|
Mercedes-Benz |
57.480 |
12/08/24 |
-0.57 |
71.480 |
|
58.440 |
13.040 |
22.31 |
EUR |
15.81 |
| | |
|
|
|
S |
|
LVMH |
635.100 |
12/08/24 |
-0.14 |
817.000 |
|
635.900 |
181.100 |
28.48 |
EUR |
23.33 |
| | |
|
|
|
S |
|
Diageo |
2,451.500 |
12/08/24 |
1.03 |
3,583.000 |
|
3,608.500 |
-25.500 |
-0.71 |
GBP |
-3.36 |
| | |
|
|
|
|
|
Reckitt Benckiser |
4,180.000 |
12/08/24 |
|
6,136.000 |
|
5,950.000 |
186.000 |
3.13 |
GBP |
1.44 |
| |
|
⇓instrument |
freshest |
⇓ Δday |
27/03/23 |
Δwk |
24/10/22 |
prc diff |
⇓ Δ22 |
Curr |
⇓∅-RS |
| | |
|
|
|
L |
|
Bayer |
25.960 |
12/08/24 |
-0.04 |
56.000 |
|
51.000 |
5.000 |
9.80 |
EUR |
0.06 |
| Europe 50 - 50 out of 50 instruments rated - 27/03/23 / 24/10/22 - 43 did rise, Market-Ratio(22) = 86.00 % |
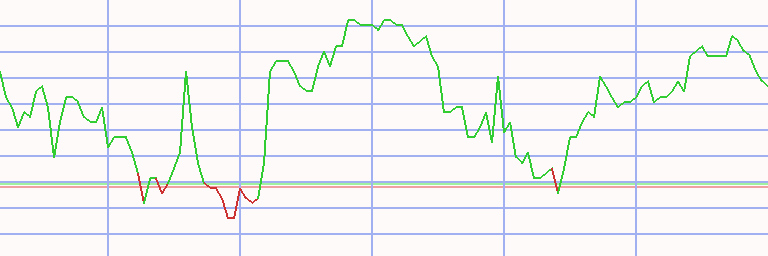
Technical Chart
Transactions STOXX Europe 50 * A22 - 28/27 (1)
|
⇐ |
| |
| L/S | date buy | date sell | days | | instrument | spl | pieces | Curr | prc buy | prc sell | ps short | prc diff | d % | asset | yield | |
| 2/01/06 |
12/06/06 |
161 |
|
- cash - |
| short |
12/06/06 |
26/06/06 |
14 |
|
|
|
Vodafone |
100 |
8,510 |
GBP |
1.175 |
1.153 |
1.198 |
0.023 |
2 |
10,195 |
65 |
|
| long |
26/06/06 |
21/01/08 |
574 |
|
|
|
ABB |
100 |
668 |
CHF |
15.250 |
23.800 |
|
8.550 |
56 |
15,906 |
33 |
|
| short |
21/01/08 |
21/04/08 |
91 |
|
|
|
UBS |
100 |
394 |
CHF |
40.300 |
35.940 |
45.189 |
4.889 |
12 |
17,833 |
58 |
|
| long |
21/04/08 |
28/04/08 |
7 |
|
|
|
Rio Tinto |
100 |
346 |
GBP |
51.524 |
51.433 |
|
-0.091 |
0 |
17,801 |
-9 |
|
| short |
28/04/08 |
23/06/08 |
56 |
|
|
|
UBS |
100 |
489 |
CHF |
36.340 |
22.060 |
59.864 |
23.524 |
65 |
29,304 |
2,488 |
|
| long |
23/06/08 |
30/06/08 |
7 |
|
|
|
Rio Tinto |
100 |
593 |
GBP |
49.352 |
49.641 |
|
0.289 |
1 |
29,476 |
36 |
|
| short |
30/06/08 |
11/08/08 |
42 |
|
|
|
UBS |
100 |
1,374 |
CHF |
21.440 |
23.180 |
19.700 |
-1.740 |
-8 |
27,085 |
-52 |
|
| long |
11/08/08 |
8/09/08 |
28 |
|
|
|
AstraZeneca |
100 |
1,049 |
GBP |
25.810 |
26.090 |
|
0.280 |
1 |
27,379 |
15 |
|
| short |
8/09/08 |
30/03/09 |
203 |
|
|
|
UBS |
100 |
1,128 |
CHF |
24.260 |
10.140 |
58.042 |
33.782 |
139 |
65,485 |
380 |
|
| long |
30/03/09 |
6/04/09 |
7 |
|
|
|
AstraZeneca |
100 |
2,784 |
GBP |
23.520 |
23.750 |
|
0.230 |
1 |
66,125 |
66 |
|
| short |
6/04/09 |
13/04/09 |
7 |
|
|
|
Lloyds Bank |
100 |
82,967 |
GBP |
0.797 |
0.879 |
0.715 |
-0.082 |
-10 |
59,322 |
-100 |
|
| long |
13/04/09 |
30/08/10 |
504 |
|
|
|
Deutsche Bank |
100 |
1,973 |
EUR |
30.053 |
38.566 |
|
8.513 |
28 |
76,118 |
20 |
|
| short |
30/08/10 |
6/09/10 |
7 |
|
|
|
BP |
100 |
19,999 |
GBP |
3.806 |
4.065 |
3.547 |
-0.259 |
-7 |
70,939 |
-97 |
|
| long |
6/09/10 |
8/08/11 |
336 |
|
|
|
Novo Nordisk |
100 |
1,400 |
DKK |
50.650 |
57.050 |
|
6.400 |
13 |
79,899 |
14 |
|
| short |
8/08/11 |
19/12/11 |
133 |
|
|
|
Lloyds Bank |
100 |
243,519 |
GBP |
0.328 |
0.235 |
0.459 |
0.131 |
40 |
111,727 |
151 |
|
| long |
19/12/11 |
20/10/14 |
1036 |
|
|
|
Roche |
100 |
705 |
CHF |
158.400 |
268.600 |
|
110.200 |
70 |
189,418 |
20 |
|
| short |
20/10/14 |
10/11/14 |
21 |
|
|
|
Deutsche Bank |
100 |
8,791 |
EUR |
21.545 |
21.563 |
21.527 |
-0.018 |
0 |
189,260 |
-1 |
|
| long |
10/11/14 |
24/08/15 |
287 |
|
|
|
Novartis |
100 |
2,541 |
CHF |
74.460 |
74.670 |
|
0.210 |
0 |
189,794 |
0 |
|
| short |
24/08/15 |
26/10/15 |
63 |
|
|
|
Rio Tinto |
100 |
8,809 |
GBP |
21.545 |
24.875 |
18.215 |
-3.330 |
-15 |
160,460 |
-62 |
|
| long |
26/10/15 |
14/12/15 |
49 |
|
|
|
SAP |
100 |
2,288 |
EUR |
70.130 |
69.400 |
|
-0.730 |
-1 |
158,790 |
-7 |
|
| short |
14/12/15 |
28/12/15 |
14 |
|
|
|
Rio Tinto |
100 |
8,592 |
GBP |
18.480 |
20.065 |
16.895 |
-1.585 |
-9 |
145,171 |
-90 |
|
| long |
28/12/15 |
4/01/16 |
7 |
|
|
|
SAP |
100 |
1,992 |
EUR |
72.860 |
70.580 |
|
-2.280 |
-3 |
140,630 |
-81 |
|
| short |
4/01/16 |
25/01/16 |
21 |
|
|
|
Rio Tinto |
100 |
7,391 |
GBP |
19.025 |
16.090 |
22.495 |
3.470 |
18 |
166,279 |
1,740 |
|
| long |
25/01/16 |
28/03/16 |
63 |
|
|
|
SAP |
100 |
2,287 |
EUR |
72.680 |
70.840 |
|
-1.840 |
-3 |
162,071 |
-14 |
|
| short |
28/03/16 |
18/04/16 |
21 |
|
|
|
Credit Suisse |
100 |
11,618 |
CHF |
13.950 |
14.540 |
13.360 |
-0.590 |
-4 |
155,217 |
-53 |
|
| L/S | date buy | date sell | days | | instrument | spl | pieces | Curr | prc buy | prc sell | ps short | prc diff | d % | asset | yield | | | long |
18/04/16 |
25/04/16 |
7 |
|
|
|
BAT |
100 |
3,626 |
GBP |
42.805 |
41.625 |
|
-1.180 |
-3 |
150,938 |
-77 |
|
| short |
25/04/16 |
16/05/16 |
21 |
|
|
|
Credit Suisse |
100 |
10,240 |
CHF |
14.740 |
13.390 |
16.226 |
1.486 |
10 |
166,156 |
431 |
|
| long |
16/05/16 |
5/03/18 |
658 |
|
|
|
BAT |
100 |
3,946 |
GBP |
42.097 |
42.210 |
|
0.113 |
0 |
166,601 |
0 |
|
| short |
5/03/18 |
23/04/18 |
49 |
|
|
|
Imperial Brands |
100 |
6,456 |
GBP |
25.805 |
23.955 |
27.798 |
1.993 |
8 |
179,467 |
74 |
|
| long |
23/04/18 |
15/10/18 |
175 |
|
|
|
LVMH |
100 |
638 |
EUR |
281.050 |
260.450 |
|
-20.600 |
-7 |
166,325 |
-15 |
|
| short |
15/10/18 |
12/11/18 |
28 |
|
|
|
Intesa Sanpaolo |
100 |
81,471 |
EUR |
2.042 |
1.960 |
2.126 |
0.085 |
4 |
173,225 |
70 |
|
| long |
12/11/18 |
10/12/18 |
28 |
|
|
|
AstraZeneca |
100 |
2,771 |
GBP |
62.510 |
60.070 |
|
-2.440 |
-4 |
166,464 |
-40 |
|
| short |
10/12/18 |
11/02/19 |
63 |
|
|
|
Bayer |
100 |
2,737 |
EUR |
60.800 |
68.170 |
53.430 |
-7.370 |
-12 |
146,292 |
-53 |
|
| long |
11/02/19 |
2/03/20 |
385 |
|
|
|
Roche |
100 |
536 |
CHF |
272.550 |
314.700 |
|
42.150 |
15 |
168,885 |
15 |
|
| short |
2/03/20 |
22/06/20 |
112 |
|
|
|
Anheuser-Busch InBev |
100 |
3,247 |
EUR |
52.000 |
44.950 |
60.156 |
8.156 |
16 |
195,366 |
61 |
|
| long |
22/06/20 |
29/06/20 |
7 |
|
|
|
ASML |
100 |
605 |
EUR |
322.550 |
322.200 |
|
-0.350 |
0 |
195,154 |
-6 |
|
| short |
29/06/20 |
27/07/20 |
28 |
|
|
|
Airbus |
100 |
3,080 |
EUR |
63.350 |
61.920 |
64.813 |
1.463 |
2 |
199,660 |
35 |
|
| long |
27/07/20 |
20/06/22 |
693 |
|
|
|
ASML |
100 |
616 |
EUR |
323.950 |
457.250 |
|
133.300 |
41 |
281,773 |
20 |
|
| short |
20/06/22 |
27/06/22 |
7 |
|
|
|
Adyen |
100 |
227 |
EUR |
1,238.600 |
1,419.800 |
1,057.400 |
-181.200 |
-15 |
240,641 |
-100 |
|
| long |
27/06/22 |
11/07/22 |
14 |
|
|
|
BAT |
100 |
6,737 |
GBP |
35.715 |
33.890 |
|
-1.825 |
-5 |
228,346 |
-75 |
|
| short |
11/07/22 |
25/07/22 |
14 |
|
|
|
Adidas |
100 |
1,400 |
EUR |
163.080 |
176.020 |
150.140 |
-12.940 |
-8 |
210,230 |
-88 |
|
| long |
25/07/22 |
5/09/22 |
42 |
|
|
|
Novo Nordisk |
100 |
502 |
DKK |
418.450 |
391.400 |
|
-27.050 |
-6 |
196,651 |
-44 |
|
| short |
5/09/22 |
7/11/22 |
63 |
|
|
|
Adidas |
100 |
1,354 |
EUR |
145.200 |
114.960 |
183.395 |
38.195 |
26 |
248,366 |
287 |
|
| long |
7/11/22 |
23/10/23 |
350 |
|
|
|
BP |
100 |
49,495 |
GBP |
5.018 |
5.322 |
|
0.304 |
6 |
263,413 |
6 |
|
| short |
23/10/23 |
30/10/23 |
7 |
|
|
|
Adyen |
100 |
386 |
EUR |
682.200 |
633.000 |
735.224 |
53.024 |
8 |
283,880 |
4,855 |
|
| long |
30/10/23 |
12/08/24 |
287 |
|
|
|
Novo Nordisk |
100 |
418 |
DKK |
677.700 |
892.900 |
|
215.200 |
32 |
373,834 |
42 |
|
| accum | 12/06/06 |
12/08/24 | 7357 |
days out of 7518 invested (98%) |
3,638 |
373,834 |
20 |
|
Instrument Related Contribution
| instrument | L/S | date buy | date sell | days | prc buy | prc sell | ps short | prc diff | d % | | | total |
| UBS | short | 21/01/08 | 21/04/08 | 91 | 40.30 | 35.94 | 45.19 | 4.89 | 12.13 | | | |
| | short | 28/04/08 | 23/06/08 | 56 | 36.34 | 22.06 | 59.86 | 23.52 | 64.73 | | | |
| | short | 30/06/08 | 11/08/08 | 42 | 21.44 | 23.18 | 19.70 | -1.74 | -8.12 | | | |
| | short | 8/09/08 | 30/03/09 | 203 | 24.26 | 10.14 | 58.04 | 33.78 | 139.25 | | | 306.07 |
| Roche | long | 19/12/11 | 20/10/14 | 1036 | 158.40 | 268.60 | | 110.20 | 69.57 | | | |
| | long | 11/02/19 | 2/03/20 | 385 | 272.55 | 314.70 | | 42.15 | 15.47 | | | 95.79 |
| ABB | long | 26/06/06 | 21/01/08 | 574 | 15.25 | 23.80 | | 8.55 | 56.07 | | | 56.07 |
| ASML | long | 22/06/20 | 29/06/20 | 7 | 322.55 | 322.20 | | -0.35 | -0.11 | | | |
| | long | 27/07/20 | 20/06/22 | 693 | 323.95 | 457.25 | | 133.30 | 41.15 | | | 41.00 |
| Novo Nordisk | long | 6/09/10 | 8/08/11 | 336 | 50.65 | 57.05 | | 6.40 | 12.64 | | | |
| | long | 25/07/22 | 5/09/22 | 42 | 418.45 | 391.40 | | -27.05 | -6.46 | | | |
| | long | 30/10/23 | 12/08/24 | 287 | 677.70 | 892.90 | | 215.20 | 31.75 | | | 38.81 |
| Deutsche Bank | long | 13/04/09 | 30/08/10 | 504 | 30.05 | 38.57 | | 8.51 | 28.33 | | | |
| | short | 20/10/14 | 10/11/14 | 21 | 21.55 | 21.56 | 21.53 | -0.02 | -0.08 | | | 28.22 |
| Lloyds Bank | short | 6/04/09 | 13/04/09 | 7 | 0.80 | 0.88 | 0.72 | -0.08 | -10.29 | | | |
| | short | 8/08/11 | 19/12/11 | 133 | 0.33 | 0.23 | 0.46 | 0.13 | 39.84 | | | 25.45 |
| Adidas | short | 11/07/22 | 25/07/22 | 14 | 163.08 | 176.02 | 150.14 | -12.94 | -7.93 | | | |
| | short | 5/09/22 | 7/11/22 | 63 | 145.20 | 114.96 | 183.39 | 38.19 | 26.30 | | | 16.28 |
| Anheuser-Busch InBev | short | 2/03/20 | 22/06/20 | 112 | 52.00 | 44.95 | 60.16 | 8.16 | 15.68 | | | 15.68 |
| Imperial Brands | short | 5/03/18 | 23/04/18 | 49 | 25.81 | 23.96 | 27.80 | 1.99 | 7.72 | | | 7.72 |
| Credit Suisse | short | 28/03/16 | 18/04/16 | 21 | 13.95 | 14.54 | 13.36 | -0.59 | -4.23 | | | |
| | short | 25/04/16 | 16/05/16 | 21 | 14.74 | 13.39 | 16.23 | 1.49 | 10.08 | | | 5.43 |
| Intesa Sanpaolo | short | 15/10/18 | 12/11/18 | 28 | 2.04 | 1.96 | 2.13 | 0.08 | 4.15 | | | 4.15 |
| Airbus | short | 29/06/20 | 27/07/20 | 28 | 63.35 | 61.92 | 64.81 | 1.46 | 2.31 | | | 2.31 |
| Vodafone | short | 12/06/06 | 26/06/06 | 14 | 1.18 | 1.15 | 1.20 | 0.02 | 1.95 | | | 1.95 |
| instrument | L/S | date buy | date sell | days | prc buy | prc sell | ps short | prc diff | d % | | | total |
| Novartis | long | 10/11/14 | 24/08/15 | 287 | 74.46 | 74.67 | | 0.21 | 0.28 | | | 0.28 |
| BP | short | 30/08/10 | 6/09/10 | 7 | 3.81 | 4.07 | 3.55 | -0.26 | -6.81 | | | |
| | long | 7/11/22 | 23/10/23 | 350 | 5.02 | 5.32 | | 0.30 | 6.06 | | | -1.16 |
| AstraZeneca | long | 11/08/08 | 8/09/08 | 28 | 25.81 | 26.09 | | 0.28 | 1.08 | | | |
| | long | 30/03/09 | 6/04/09 | 7 | 23.52 | 23.75 | | 0.23 | 0.98 | | | |
| | long | 12/11/18 | 10/12/18 | 28 | 62.51 | 60.07 | | -2.44 | -3.90 | | | -1.91 |
| SAP | long | 26/10/15 | 14/12/15 | 49 | 70.13 | 69.40 | | -0.73 | -1.04 | | | |
| | long | 28/12/15 | 4/01/16 | 7 | 72.86 | 70.58 | | -2.28 | -3.13 | | | |
| | long | 25/01/16 | 28/03/16 | 63 | 72.68 | 70.84 | | -1.84 | -2.53 | | | -6.56 |
| LVMH | long | 23/04/18 | 15/10/18 | 175 | 281.05 | 260.45 | | -20.60 | -7.33 | | | -7.33 |
| BAT | long | 18/04/16 | 25/04/16 | 7 | 42.81 | 41.63 | | -1.18 | -2.76 | | | |
| | long | 16/05/16 | 5/03/18 | 658 | 42.10 | 42.21 | | 0.11 | 0.27 | | | |
| | long | 27/06/22 | 11/07/22 | 14 | 35.72 | 33.89 | | -1.83 | -5.11 | | | -7.48 |
| Adyen | short | 20/06/22 | 27/06/22 | 7 | 1,238.60 | 1,419.80 | 1,057.40 | -181.20 | -14.63 | | | |
| | short | 23/10/23 | 30/10/23 | 7 | 682.20 | 633.00 | 735.22 | 53.02 | 7.77 | | | -7.99 |
| Rio Tinto | long | 21/04/08 | 28/04/08 | 7 | 51.52 | 51.43 | | -0.09 | -0.18 | | | |
| | long | 23/06/08 | 30/06/08 | 7 | 49.35 | 49.64 | | 0.29 | 0.59 | | | |
| | short | 24/08/15 | 26/10/15 | 63 | 21.55 | 24.88 | 18.22 | -3.33 | -15.46 | | | |
| | short | 14/12/15 | 28/12/15 | 14 | 18.48 | 20.07 | 16.90 | -1.59 | -8.58 | | | |
| | short | 4/01/16 | 25/01/16 | 21 | 19.03 | 16.09 | 22.50 | 3.47 | 18.24 | | | -8.23 |
| Bayer | short | 10/12/18 | 11/02/19 | 63 | 60.80 | 68.17 | 53.43 | -7.37 | -12.12 | | | -12.12 |
Annotations
| 19/02/24 | Stoxx 50 | | | Component update: Glencore, ING and Munich Re replace Adidas, Adyen and Kering |
| 14/09/23 | Prosus | | | stock split 1:2.1796 (two-point-onesevenninesix for one) |
| 13/09/23 | Novo Nordisk | | | stock split 1:2 (two for one) |
| 18/07/22 | GlaxoSmithKline | | | demergers OTC business -> Haleon |
| 24/09/18 | Europe 50 | | | Safran replaces Imperial Brands |
| 31/05/17 | Europe 50 | | | Glencore replaces Syngenta (acquired by ChemChina) |
| 4/10/16 | AB InBev | | | acquisition of SAB Miller completed |
| 19/09/16 | Europe 50 | | | Syngenta replaces Richemont |
| 8/08/16 | Europe 50 | | | ASML and Vinci replace Credit Suisse and Deutsche Bank |
| 21/09/15 | Europe 50 | | | Imperial Tobacco and Intesa Sanpaolo replace BHP Biliton and Glencore |
| 14/09/15 | Europe 50 | | | complete analysis
ex BHP Biliton, Glencore - in Imperial Tobacco, Intesa Sanpaolo |
| 5/09/15 | Europe 50 | | | complete analysis |
| 9/07/15 | Europe 50 | | | market adjustment to index: Novo Nordisk replaces Standard Chartered |
| 22/09/14 | Europe 50 | | | BT Group and Prudential replace Ericsson and Tesco. |
|
|