| | Freitag, 26. Juni 2026, 22:02UTC |
| | |

Auswertung - OMX Copenhagen 20 in Pfund Sterling - 1.07.24 - RS = 17
⇐
| |
|
⇓Wertpapier |
jüngster |
⇓ ΔTag |
1.07.24 |
ΔWo |
4.03.24 |
K-Diff |
⇓ Δ17 |
|
⇓∅-RS |
| |  |
 |
 |
|
|
 |
OMXC 20 |
303,806 |
12.08.24 |
-2,06 |
329,462 |
-7,79 |
304,430 |
25,032 |
8,22 |
|
22,54 |
| | |
|
|
|
L |
|
Ørsted |
47,501 |
12.08.24 |
0,63 |
42,780 |
11,04 |
42,282 |
0,498 |
1,18 |
|
-6,45 |
| | |
|
|
|
L |
|
DSV |
138,294 |
12.08.24 |
|
130,102 |
6,30 |
125,181 |
4,921 |
3,93 |
|
-3,61 |
| | |
|
|
|
|
|
Coloplast |
100,623 |
12.08.24 |
0,25 |
94,707 |
6,25 |
106,869 |
-12,162 |
-11,38 |
|
0,92 |
| | |
|
|
|
|
|
Genmab |
207,185 |
12.08.24 |
0,89 |
197,343 |
4,99 |
224,202 |
-26,859 |
-11,98 |
|
-21,61 |
| | |
|
|
|
|
|
ISS |
14,302 |
12.08.24 |
0,48 |
13,755 |
3,97 |
14,256 |
-0,501 |
-3,51 |
|
-3,53 |
| | |
|
|
|
|
|
Pandora |
118,440 |
12.08.24 |
1,56 |
114,799 |
3,17 |
130,517 |
-15,717 |
-12,04 |
|
13,07 |
| | |
|
|
|
|
|
Novonesis |
48,832 |
12.08.24 |
0,12 |
48,059 |
1,61 |
45,735 |
2,323 |
5,08 |
|
19,01 |
| | |
|
|
|
L |
|
Ambu |
15,667 |
12.08.24 |
-0,40 |
15,536 |
0,84 |
13,975 |
1,561 |
11,17 |
|
36,04 |
| | |
|
|
|
L |
|
Rockwool |
312,199 |
12.08.24 |
-0,22 |
321,301 |
-2,83 |
252,543 |
68,759 |
27,23 |
|
44,07 |
| | |
|
|
|
|
|
Tryg |
16,907 |
12.08.24 |
0,61 |
17,419 |
-2,94 |
16,798 |
0,621 |
3,70 |
|
7,45 |
| | |
|
|
|
L |
|
Carlsberg B |
91,202 |
12.08.24 |
|
96,026 |
-5,02 |
107,695 |
-11,669 |
-10,83 |
|
-10,00 |
| | |
|
|
|
|
|
Danske Bank |
22,579 |
12.08.24 |
0,15 |
23,790 |
-5,09 |
23,659 |
0,131 |
0,55 |
|
14,65 |
| | |
|
|
|
|
|
Jyske Bank |
59,049 |
12.08.24 |
0,48 |
62,804 |
-5,98 |
64,805 |
-2,001 |
-3,09 |
|
4,80 |
| | |
|
|
|
|
|
Vestas Wind Systems |
17,322 |
12.08.24 |
-7,76 |
18,443 |
-6,08 |
22,388 |
-3,945 |
-17,62 |
|
-9,78 |
| | |
|
|
|
L |
|
GN Store Nord |
145,937 |
12.08.24 |
-0,98 |
163,161 |
-10,56 |
132,976 |
30,185 |
22,70 |
|
18,35 |
| | |
|
|
|
|
|
Novo Nordisk |
101,590 |
12.08.24 |
-2,80 |
114,299 |
-11,12 |
100,650 |
13,649 |
13,56 |
|
37,83 |
| | |
|
|
|
|
|
Demant |
29,536 |
12.08.24 |
-1,44 |
34,337 |
-13,98 |
41,077 |
-6,740 |
-16,41 |
|
-1,15 |
| | |
|
|
|
L |
|
Møller-Mærsk A |
1.203,742 |
12.08.24 |
1,93 |
1.424,466 |
-15,50 |
1.067,655 |
356,811 |
33,42 |
|
10,32 |
| | |
|
|
|
L |
|
Møller-Mærsk B |
1.225,360 |
12.08.24 |
1,99 |
1.463,150 |
-16,25 |
1.098,291 |
364,859 |
33,22 |
|
11,27 |
| OMXC 20 - 19 von 19 Wertpapieren bewertet - 1.07.24 / 4.03.24 - 11 davon sind besser, Markt-Kennzahl(17) in GBP = 57,89 % |
| Börsenplatz-Währung: DKK kr Dänische Krone |
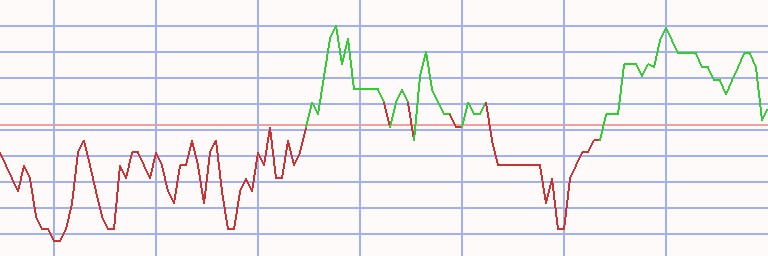
Technischer Chart
Transaktionen OMX Copenhagen 20 in Pfund Sterling * S17 - 51 ex 3 (1)
|
⇐ |
| |
| L/S | K-Datum | V-Datum | Tage | | Wertpapier | Spl | Stück | | K-Kurs | V-Kurs | S-V-Kurs | K-Diff | D % | Kapital | Rdte | |
| 2.01.06 |
10.07.06 |
189 |
|
- cash - |
| short |
10.07.06 |
18.09.06 |
70 |
|
|
|
Møller-Mærsk B |
100 |
1.245 |
|
8,026 |
8,557 |
7,495 |
-0,531 |
-7 |
9.339 |
-30 |
|
| 18.09.06 |
20.08.07 |
336 |
|
- cash - |
| |
20.08.07 |
27.08.07 |
7 |
|
|
|
GN Store Nord |
100 |
257 |
|
36,221 |
35,303 |
37,162 |
0,942 |
3 |
9.581 |
281 |
|
| 27.08.07 |
10.09.07 |
14 |
|
- cash - |
| |
10.09.07 |
24.09.07 |
14 |
|
|
|
GN Store Nord |
100 |
261 |
|
36,650 |
37,491 |
35,809 |
-0,841 |
-2 |
9.361 |
-45 |
|
| 24.09.07 |
29.10.07 |
35 |
|
- cash - |
| |
29.10.07 |
5.05.08 |
189 |
|
|
|
GN Store Nord |
100 |
242 |
|
38,577 |
21,122 |
70,456 |
31,879 |
83 |
17.076 |
220 |
|
| 5.05.08 |
16.06.08 |
42 |
|
- cash - |
| |
16.06.08 |
20.10.08 |
126 |
|
|
|
Rockwool |
100 |
218 |
|
78,061 |
42,373 |
143,806 |
65,745 |
84 |
31.409 |
487 |
|
| |
20.10.08 |
15.12.08 |
56 |
|
|
|
Carlsberg B |
100 |
1.289 |
|
24,362 |
23,512 |
25,243 |
0,881 |
4 |
32.544 |
26 |
|
| |
15.12.08 |
13.04.09 |
119 |
|
|
|
Danske Bank |
100 |
4.927 |
|
6,605 |
5,915 |
7,376 |
0,771 |
12 |
36.341 |
40 |
|
| 13.04.09 |
28.06.10 |
441 |
|
- cash - |
| |
28.06.10 |
12.07.10 |
14 |
|
|
|
Genmab |
100 |
7.173 |
|
5,066 |
6,657 |
3,476 |
-1,590 |
-31 |
24.934 |
-100 |
|
| 12.07.10 |
23.08.10 |
42 |
|
- cash - |
| |
23.08.10 |
6.09.10 |
14 |
|
|
|
Genmab |
100 |
4.010 |
|
6,217 |
6,390 |
6,043 |
-0,174 |
-3 |
24.238 |
-52 |
|
| 6.09.10 |
4.10.10 |
28 |
|
- cash - |
| |
4.10.10 |
25.10.10 |
21 |
|
|
|
Vestas Wind Systems |
100 |
5.055 |
|
4,795 |
4,773 |
4,816 |
0,021 |
0 |
24.345 |
8 |
|
| 25.10.10 |
25.04.11 |
182 |
|
- cash - |
| |
25.04.11 |
16.05.11 |
21 |
|
|
|
Vestas Wind Systems |
100 |
5.740 |
|
4,241 |
3,647 |
4,932 |
0,691 |
16 |
28.312 |
1.279 |
|
| 16.05.11 |
23.05.11 |
7 |
|
- cash - |
| |
23.05.11 |
28.11.11 |
189 |
|
|
|
Vestas Wind Systems |
100 |
7.582 |
|
3,734 |
1,697 |
8,214 |
4,481 |
120 |
62.284 |
358 |
|
| 28.11.11 |
21.05.12 |
175 |
|
- cash - |
| |
21.05.12 |
6.08.12 |
77 |
|
|
|
Vestas Wind Systems |
100 |
75.222 |
|
0,828 |
0,598 |
1,146 |
0,318 |
38 |
86.213 |
367 |
|
| 6.08.12 |
24.06.13 |
322 |
|
- cash - |
| |
24.06.13 |
1.07.13 |
7 |
|
|
|
Novo Nordisk |
100 |
8.666 |
|
9,948 |
10,451 |
9,444 |
-0,503 |
-5 |
81.851 |
-93 |
|
| 1.07.13 |
8.09.14 |
434 |
|
- cash - |
| |
8.09.14 |
15.09.14 |
7 |
|
|
|
Rockwool |
100 |
871 |
|
93,935 |
92,462 |
95,432 |
1,497 |
2 |
83.154 |
128 |
|
| 15.09.14 |
29.09.14 |
14 |
|
- cash - |
| |
29.09.14 |
22.12.14 |
84 |
|
|
|
Rockwool |
100 |
930 |
|
89,387 |
74,421 |
107,361 |
17,975 |
20 |
99.871 |
122 |
|
| 22.12.14 |
19.01.15 |
28 |
|
- cash - |
| |
19.01.15 |
26.01.15 |
7 |
|
|
|
Rockwool |
100 |
1.430 |
|
69,811 |
70,465 |
69,157 |
-0,654 |
-1 |
98.936 |
-39 |
|
| 26.01.15 |
10.08.15 |
196 |
|
- cash - |
| |
10.08.15 |
19.10.15 |
70 |
|
|
|
Møller-Mærsk B |
100 |
8.757 |
|
11,298 |
10,481 |
12,178 |
0,880 |
8 |
106.644 |
48 |
|
| 19.10.15 |
2.11.15 |
14 |
|
- cash - |
| |
2.11.15 |
7.12.15 |
35 |
|
|
|
Møller-Mærsk B |
100 |
11.159 |
|
9,556 |
9,594 |
9,518 |
-0,038 |
0 |
106.223 |
-4 |
|
| 7.12.15 |
14.12.15 |
7 |
|
- cash - |
| |
14.12.15 |
21.12.15 |
7 |
|
|
|
Møller-Mærsk B |
100 |
11.930 |
|
8,903 |
8,703 |
9,109 |
0,205 |
2 |
108.672 |
228 |
|
| 21.12.15 |
18.01.16 |
28 |
|
- cash - |
| |
18.01.16 |
25.01.16 |
7 |
|
|
|
Møller-Mærsk B |
100 |
13.651 |
|
7,960 |
8,445 |
7,475 |
-0,485 |
-6 |
102.051 |
-96 |
|
| 25.01.16 |
8.02.16 |
14 |
|
- cash - |
| |
8.02.16 |
15.02.16 |
7 |
|
|
|
Møller-Mærsk B |
100 |
11.460 |
|
8,904 |
8,837 |
8,972 |
0,068 |
1 |
102.826 |
48 |
|
| 15.02.16 |
7.03.16 |
21 |
|
- cash - |
| |
7.03.16 |
14.03.16 |
7 |
|
|
|
Møller-Mærsk A |
100 |
10.672 |
|
9,635 |
9,181 |
10,112 |
0,477 |
5 |
107.913 |
1.140 |
|
| 14.03.16 |
21.03.16 |
7 |
|
- cash - |
| |
21.03.16 |
18.04.16 |
28 |
|
|
|
Møller-Mærsk A |
100 |
11.791 |
|
9,152 |
9,161 |
9,143 |
-0,009 |
0 |
107.811 |
-1 |
|
| 18.04.16 |
20.06.16 |
63 |
|
- cash - |
| |
20.06.16 |
18.07.16 |
28 |
|
|
|
Møller-Mærsk A |
100 |
13.385 |
|
8,054 |
9,051 |
7,057 |
-0,997 |
-12 |
94.464 |
-82 |
|
| L/S | K-Datum | V-Datum | Tage | | Wertpapier | Spl | Stück | | K-Kurs | V-Kurs | S-V-Kurs | K-Diff | D % | Kapital | Rdte | |
| 18.07.16 |
21.11.16 |
126 |
|
- cash - |
| |
21.11.16 |
6.02.17 |
77 |
|
|
|
Novo Nordisk |
100 |
7.270 |
|
12,992 |
13,474 |
12,509 |
-0,483 |
-4 |
90.956 |
-16 |
|
| 6.02.17 |
2.10.17 |
238 |
|
- cash - |
| |
2.10.17 |
9.10.17 |
7 |
|
|
|
Pandora |
100 |
1.226 |
|
74,140 |
74,140 |
74,140 |
0,000 |
0 |
90.956 |
0 |
|
| 9.10.17 |
29.01.18 |
112 |
|
- cash - |
| |
29.01.18 |
26.02.18 |
28 |
|
|
|
Vestas Wind Systems |
100 |
9.645 |
|
9,430 |
10,611 |
8,250 |
-1,180 |
-13 |
79.572 |
-83 |
|
| 26.02.18 |
5.03.18 |
7 |
|
- cash - |
| |
5.03.18 |
12.03.18 |
7 |
|
|
|
Møller-Mærsk B |
100 |
6.959 |
|
11,433 |
11,164 |
11,708 |
0,275 |
2 |
81.486 |
246 |
|
| 12.03.18 |
19.03.18 |
7 |
|
- cash - |
| |
19.03.18 |
2.04.18 |
14 |
|
|
|
Møller-Mærsk A |
100 |
7.656 |
|
10,643 |
10,583 |
10,704 |
0,061 |
1 |
81.953 |
16 |
|
| 2.04.18 |
16.04.18 |
14 |
|
- cash - |
| |
16.04.18 |
23.04.18 |
7 |
|
|
|
Møller-Mærsk A |
100 |
8.298 |
|
9,875 |
10,529 |
9,221 |
-0,654 |
-7 |
76.526 |
-97 |
|
| 23.04.18 |
14.05.18 |
21 |
|
- cash - |
| |
14.05.18 |
21.05.18 |
7 |
|
|
|
ISS |
100 |
3.016 |
|
25,372 |
25,289 |
25,456 |
0,084 |
0 |
76.778 |
19 |
|
| 21.05.18 |
28.05.18 |
7 |
|
- cash - |
| |
28.05.18 |
4.06.18 |
7 |
|
|
|
Genmab |
100 |
686 |
|
111,771 |
115,438 |
108,103 |
-3,667 |
-3 |
74.262 |
-82 |
|
| 4.06.18 |
25.06.18 |
21 |
|
- cash - |
| |
25.06.18 |
2.07.18 |
7 |
|
|
|
Pandora |
100 |
1.304 |
|
56,938 |
52,216 |
62,088 |
5,150 |
9 |
80.977 |
9.038 |
|
| 2.07.18 |
8.10.18 |
98 |
|
- cash - |
| |
8.10.18 |
11.02.19 |
126 |
|
|
|
Danske Bank |
100 |
4.802 |
|
16,860 |
14,585 |
19,491 |
2,630 |
16 |
93.609 |
52 |
|
| 11.02.19 |
5.08.19 |
175 |
|
- cash - |
| |
5.08.19 |
2.09.19 |
28 |
|
|
|
Ambu |
100 |
7.872 |
|
11,890 |
14,428 |
9,353 |
-2,537 |
-21 |
73.634 |
-96 |
|
| |
2.09.19 |
16.09.19 |
14 |
|
|
|
Danske Bank |
100 |
6.860 |
|
10,732 |
12,010 |
9,454 |
-1,278 |
-12 |
64.866 |
-96 |
|
| 16.09.19 |
4.11.19 |
49 |
|
- cash - |
| |
4.11.19 |
11.11.19 |
7 |
|
|
|
Ambu |
100 |
5.405 |
|
12,000 |
11,674 |
12,335 |
0,335 |
3 |
66.677 |
320 |
|
| 11.11.19 |
9.03.20 |
119 |
|
- cash - |
| |
9.03.20 |
22.06.20 |
105 |
|
|
|
ISS |
100 |
5.518 |
|
12,083 |
14,323 |
9,843 |
-2,240 |
-19 |
54.316 |
-51 |
|
| 22.06.20 |
2.11.20 |
133 |
|
- cash - |
| |
2.11.20 |
9.11.20 |
7 |
|
|
|
ISS |
100 |
5.152 |
|
10,542 |
13,046 |
8,038 |
-2,504 |
-24 |
41.415 |
-100 |
|
| 9.11.20 |
4.10.21 |
329 |
|
- cash - |
| |
4.10.21 |
18.10.21 |
14 |
|
|
|
Ambu |
100 |
1.977 |
|
20,948 |
20,056 |
21,881 |
0,932 |
4 |
43.258 |
211 |
|
| 18.10.21 |
8.11.21 |
21 |
|
- cash - |
| |
8.11.21 |
15.11.21 |
7 |
|
|
|
Ambu |
100 |
2.158 |
|
20,039 |
21,771 |
18,306 |
-1,732 |
-9 |
39.520 |
-99 |
|
| 15.11.21 |
29.11.21 |
14 |
|
- cash - |
| |
29.11.21 |
27.12.21 |
28 |
|
|
|
GN Store Nord |
100 |
120 |
|
326,873 |
346,855 |
306,891 |
-19,982 |
-6 |
37.122 |
-56 |
|
| 27.12.21 |
10.01.22 |
14 |
|
- cash - |
| |
10.01.22 |
15.08.22 |
217 |
|
|
|
Ambu |
100 |
2.171 |
|
17,092 |
8,836 |
33,061 |
15,969 |
93 |
71.791 |
203 |
|
| 15.08.22 |
22.08.22 |
7 |
|
- cash - |
| |
22.08.22 |
12.09.22 |
21 |
|
|
|
Ambu |
100 |
8.854 |
|
8,108 |
8,902 |
7,313 |
-0,795 |
-10 |
64.755 |
-83 |
|
| 12.09.22 |
19.09.22 |
7 |
|
- cash - |
| |
19.09.22 |
31.10.22 |
42 |
|
|
|
Rockwool |
100 |
435 |
|
148,788 |
173,699 |
123,877 |
-24,911 |
-17 |
53.918 |
-80 |
|
| |
31.10.22 |
14.11.22 |
14 |
|
|
|
GN Store Nord |
100 |
390 |
|
138,116 |
166,198 |
110,035 |
-28,082 |
-20 |
42.966 |
-100 |
|
| 14.11.22 |
21.11.22 |
7 |
|
- cash - |
| |
21.11.22 |
5.12.22 |
14 |
|
|
|
GN Store Nord |
100 |
300 |
|
143,149 |
152,570 |
133,728 |
-9,421 |
-7 |
40.140 |
-83 |
|
| 5.12.22 |
12.12.22 |
7 |
|
- cash - |
| |
12.12.22 |
2.01.23 |
21 |
|
|
|
GN Store Nord |
100 |
290 |
|
138,318 |
151,265 |
125,371 |
-12,947 |
-9 |
36.386 |
-82 |
|
| 2.01.23 |
10.04.23 |
98 |
|
- cash - |
| |
10.04.23 |
17.04.23 |
7 |
|
|
|
Møller-Mærsk B |
100 |
2.696 |
|
13,495 |
16,433 |
10,558 |
-2,938 |
-22 |
28.466 |
-100 |
|
| L/S | K-Datum | V-Datum | Tage | | Wertpapier | Spl | Stück | | K-Kurs | V-Kurs | S-V-Kurs | K-Diff | D % | Kapital | Rdte | |
| 17.04.23 |
8.05.23 |
21 |
|
- cash - |
| |
8.05.23 |
15.05.23 |
7 |
|
|
|
Møller-Mærsk B |
100 |
2.013 |
|
14,141 |
14,237 |
14,044 |
-0,097 |
-1 |
28.272 |
-30 |
|
| 15.05.23 |
19.06.23 |
35 |
|
- cash - |
| |
19.06.23 |
3.07.23 |
14 |
|
|
|
Møller-Mærsk B |
100 |
2.058 |
|
13,732 |
14,315 |
13,149 |
-0,583 |
-4 |
27.072 |
-68 |
|
| 3.07.23 |
14.08.23 |
42 |
|
- cash - |
| |
14.08.23 |
11.09.23 |
28 |
|
|
|
Tryg |
100 |
1.792 |
|
15,100 |
15,450 |
14,751 |
-0,350 |
-2 |
26.445 |
-26 |
|
| |
11.09.23 |
18.12.23 |
98 |
|
|
|
Ørsted |
100 |
597 |
|
44,232 |
38,930 |
50,256 |
6,024 |
14 |
30.041 |
61 |
|
| 18.12.23 |
26.06.26 |
921 |
|
- cash - |
| kum | 10.07.06 |
18.12.23 | 2191 |
Tage von 7480 investiert (29%) |
200 |
30.041 |
20 |
|
Anteil der Einzelwerte
| Wertpapier | L/S | K-Datum | V-Datum | Tage | K-Kurs | V-Kurs | S-V-Kurs | K-Diff | D % | | | Summe |
| Vestas Wind Systems | short | 4.10.10 | 25.10.10 | 21 | 4,79 | 4,77 | 4,82 | 0,02 | 0,44 | | | |
| | | 25.04.11 | 16.05.11 | 21 | 4,24 | 3,65 | 4,93 | 0,69 | 16,29 | | | |
| | | 23.05.11 | 28.11.11 | 189 | 3,73 | 1,70 | 8,21 | 4,48 | 120,01 | | | |
| | | 21.05.12 | 6.08.12 | 77 | 0,83 | 0,60 | 1,15 | 0,32 | 38,42 | | | |
| | | 29.01.18 | 26.02.18 | 28 | 9,43 | 10,61 | 8,25 | -1,18 | -12,52 | | | 211,20 |
| Rockwool | | 16.06.08 | 20.10.08 | 126 | 78,06 | 42,37 | 143,81 | 65,74 | 84,22 | | | |
| | | 8.09.14 | 15.09.14 | 7 | 93,94 | 92,46 | 95,43 | 1,50 | 1,59 | | | |
| | | 29.09.14 | 22.12.14 | 84 | 89,39 | 74,42 | 107,36 | 17,97 | 20,11 | | | |
| | | 19.01.15 | 26.01.15 | 7 | 69,81 | 70,47 | 69,16 | -0,65 | -0,94 | | | |
| | | 19.09.22 | 31.10.22 | 42 | 148,79 | 173,70 | 123,88 | -24,91 | -16,74 | | | 85,40 |
| Ambu | | 5.08.19 | 2.09.19 | 28 | 11,89 | 14,43 | 9,35 | -2,54 | -21,34 | | | |
| | | 4.11.19 | 11.11.19 | 7 | 12,00 | 11,67 | 12,33 | 0,34 | 2,79 | | | |
| | | 4.10.21 | 18.10.21 | 14 | 20,95 | 20,06 | 21,88 | 0,93 | 4,45 | | | |
| | | 8.11.21 | 15.11.21 | 7 | 20,04 | 21,77 | 18,31 | -1,73 | -8,65 | | | |
| | | 10.01.22 | 15.08.22 | 217 | 17,09 | 8,84 | 33,06 | 15,97 | 93,43 | | | |
| | | 22.08.22 | 12.09.22 | 21 | 8,11 | 8,90 | 7,31 | -0,79 | -9,80 | | | 34,61 |
| GN Store Nord | | 20.08.07 | 27.08.07 | 7 | 36,22 | 35,30 | 37,16 | 0,94 | 2,60 | | | |
| | | 10.09.07 | 24.09.07 | 14 | 36,65 | 37,49 | 35,81 | -0,84 | -2,29 | | | |
| | | 29.10.07 | 5.05.08 | 189 | 38,58 | 21,12 | 70,46 | 31,88 | 82,64 | | | |
| | | 29.11.21 | 27.12.21 | 28 | 326,87 | 346,86 | 306,89 | -19,98 | -6,11 | | | |
| | | 31.10.22 | 14.11.22 | 14 | 138,12 | 166,20 | 110,03 | -28,08 | -20,33 | | | |
| | | 21.11.22 | 5.12.22 | 14 | 143,15 | 152,57 | 133,73 | -9,42 | -6,58 | | | |
| | | 12.12.22 | 2.01.23 | 21 | 138,32 | 151,26 | 125,37 | -12,95 | -9,36 | | | 15,96 |
| Danske Bank | | 15.12.08 | 13.04.09 | 119 | 6,61 | 5,91 | 7,38 | 0,77 | 11,67 | | | |
| | | 8.10.18 | 11.02.19 | 126 | 16,86 | 14,58 | 19,49 | 2,63 | 15,60 | | | |
| | | 2.09.19 | 16.09.19 | 14 | 10,73 | 12,01 | 9,45 | -1,28 | -11,91 | | | 13,72 |
| Wertpapier | L/S | K-Datum | V-Datum | Tage | K-Kurs | V-Kurs | S-V-Kurs | K-Diff | D % | | | Summe |
| Ørsted | | 11.09.23 | 18.12.23 | 98 | 44,23 | 38,93 | 50,26 | 6,02 | 13,62 | | | 13,62 |
| Pandora | | 2.10.17 | 9.10.17 | 7 | 74,14 | 74,14 | 74,14 | 0,00 | 0,00 | | | |
| | | 25.06.18 | 2.07.18 | 7 | 56,94 | 52,22 | 62,09 | 5,15 | 9,04 | | | 9,04 |
| Carlsberg B | | 20.10.08 | 15.12.08 | 56 | 24,36 | 23,51 | 25,24 | 0,88 | 3,61 | | | 3,61 |
| Tryg | | 14.08.23 | 11.09.23 | 28 | 15,10 | 15,45 | 14,75 | -0,35 | -2,32 | | | -2,32 |
| Novo Nordisk | | 24.06.13 | 1.07.13 | 7 | 9,95 | 10,45 | 9,44 | -0,50 | -5,06 | | | |
| | | 21.11.16 | 6.02.17 | 77 | 12,99 | 13,47 | 12,51 | -0,48 | -3,71 | | | -8,59 |
| Møller-Mærsk A | | 7.03.16 | 14.03.16 | 7 | 9,64 | 9,18 | 10,11 | 0,48 | 4,95 | | | |
| | | 21.03.16 | 18.04.16 | 28 | 9,15 | 9,16 | 9,14 | -0,01 | -0,09 | | | |
| | | 20.06.16 | 18.07.16 | 28 | 8,05 | 9,05 | 7,06 | -1,00 | -12,38 | | | |
| | | 19.03.18 | 2.04.18 | 14 | 10,64 | 10,58 | 10,70 | 0,06 | 0,57 | | | |
| | | 16.04.18 | 23.04.18 | 7 | 9,88 | 10,53 | 9,22 | -0,65 | -6,62 | | | -13,73 |
| Møller-Mærsk B | | 10.07.06 | 18.09.06 | 70 | 8,03 | 8,56 | 7,50 | -0,53 | -6,62 | | | |
| | | 10.08.15 | 19.10.15 | 70 | 11,30 | 10,48 | 12,18 | 0,88 | 7,79 | | | |
| | | 2.11.15 | 7.12.15 | 35 | 9,56 | 9,59 | 9,52 | -0,04 | -0,40 | | | |
| | | 14.12.15 | 21.12.15 | 7 | 8,90 | 8,70 | 9,11 | 0,21 | 2,31 | | | |
| | | 18.01.16 | 25.01.16 | 7 | 7,96 | 8,45 | 7,48 | -0,49 | -6,09 | | | |
| | | 8.02.16 | 15.02.16 | 7 | 8,90 | 8,84 | 8,97 | 0,07 | 0,76 | | | |
| | | 5.03.18 | 12.03.18 | 7 | 11,43 | 11,16 | 11,71 | 0,28 | 2,41 | | | |
| | | 10.04.23 | 17.04.23 | 7 | 13,50 | 16,43 | 10,56 | -2,94 | -21,77 | | | |
| | | 8.05.23 | 15.05.23 | 7 | 14,14 | 14,24 | 14,04 | -0,10 | -0,68 | | | |
| | | 19.06.23 | 3.07.23 | 14 | 13,73 | 14,32 | 13,15 | -0,58 | -4,25 | | | -26,05 |
| Genmab | | 28.06.10 | 12.07.10 | 14 | 5,07 | 6,66 | 3,48 | -1,59 | -31,39 | | | |
| | | 23.08.10 | 6.09.10 | 14 | 6,22 | 6,39 | 6,04 | -0,17 | -2,79 | | | |
| | | 28.05.18 | 4.06.18 | 7 | 111,77 | 115,44 | 108,10 | -3,67 | -3,28 | | | -35,49 |
| Wertpapier | L/S | K-Datum | V-Datum | Tage | K-Kurs | V-Kurs | S-V-Kurs | K-Diff | D % | | | Summe |
| ISS | | 14.05.18 | 21.05.18 | 7 | 25,37 | 25,29 | 25,46 | 0,08 | 0,33 | | | |
| | | 9.03.20 | 22.06.20 | 105 | 12,08 | 14,32 | 9,84 | -2,24 | -18,54 | | | |
| | | 2.11.20 | 9.11.20 | 7 | 10,54 | 13,05 | 8,04 | -2,50 | -23,75 | | | -37,68 |
Anmerkungen
| 13.09.23 | Novo Nordisk | | | Aktiensplit 1:2 (zwei für eine) |
| 18.06.18 | OMXC 20 | | | Ambu, FLSmidth und Tryg ersetzen Møller-Mærsk A, Nordea Bank und TDC |
| 14.02.18 | OMXC 20 | | | Nets (übernommen von Evergood 5) wird durch Nordea Bank ersetzt |
| 22.03.17 | OMXC 20 | | | Index-Anpassung: Dong Energy, Lundbeck und Nets für FlSmidth, Nordea und Tryg |
| 25.05.16 | William Demant | | | Aktien-Split 1:5 (fünf für eine) |
| 16.09.15 | OMXC 20 | | | vollständige Analyse
ein wirklich dankbarer kleiner Markt |
| 18.05.15 | Tryg | | | Aktiensplit 1:5 (fünf für eine) |
|
|