| | Sun, 2nd Aug 2026, 18:34UTC |
| | |

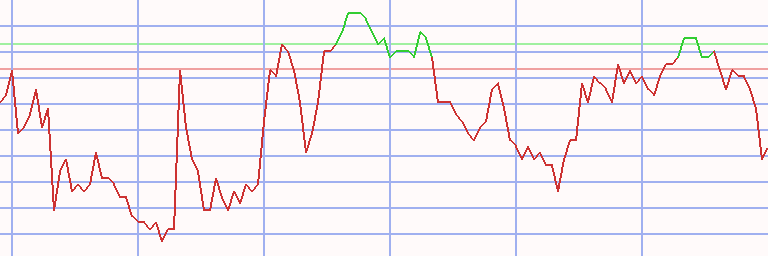
Assessment - Cotation Assistée en Continu in Dollar - 10/08/20 - RS = 21
⇐
| |
|
⇓instrument |
freshest |
⇓ Δday |
10/08/20 |
Δwk |
16/03/20 |
prc diff |
⇓ Δ21 |
|
⇓∅-RS |
| |  |
 |
 |
|
|
 |
CAC 40 |
8,523.163 |
12/08/24 |
-0.26 |
5,771.129 |
|
4,332.486 |
1,438.643 |
33.21 |
|
-0.17 |
| | |
|
|
|
|
|
Publicis |
107.629 |
12/08/24 |
0.68 |
35.077 |
|
25.572 |
9.505 |
37.17 |
|
-5.82 |
| | |
|
|
|
|
|
Hermes International |
2,358.053 |
12/08/24 |
-0.50 |
803.337 |
|
611.901 |
191.436 |
31.29 |
|
8.97 |
| | |
|
|
|
|
|
Thales |
172.857 |
12/08/24 |
-0.20 |
78.617 |
|
73.468 |
5.149 |
7.01 |
|
-14.50 |
| | |
|
|
|
|
|
Saint-Gobain |
86.470 |
12/08/24 |
-0.41 |
39.614 |
|
21.610 |
18.005 |
83.32 |
|
14.74 |
| | |
|
|
|
|
|
Schneider Electric |
248.324 |
12/08/24 |
0.38 |
120.430 |
|
78.603 |
41.827 |
53.21 |
|
26.31 |
| | |
|
|
|
|
|
ArcelorMittal |
23.651 |
12/08/24 |
0.30 |
12.108 |
|
8.023 |
4.084 |
50.91 |
|
-4.56 |
| | |
|
|
|
|
|
Safran |
225.931 |
12/08/24 |
-0.18 |
118.432 |
|
83.202 |
35.230 |
42.34 |
|
-1.54 |
| | |
|
|
|
|
|
EssilorLuxottica |
243.681 |
12/08/24 |
-0.58 |
127.894 |
|
107.044 |
20.851 |
19.48 |
|
-6.44 |
| | |
|
|
|
|
|
Axa |
38.027 |
12/08/24 |
-0.77 |
20.388 |
|
15.006 |
5.382 |
35.86 |
|
-7.91 |
| | |
|
|
|
|
|
TotalEnergies |
72.552 |
12/08/24 |
0.60 |
39.074 |
|
27.163 |
11.911 |
43.85 |
|
-10.50 |
| | |
|
|
|
|
|
Airbus |
157.235 |
12/08/24 |
-0.45 |
84.707 |
|
77.018 |
7.689 |
9.98 |
|
-13.01 |
| | |
|
|
|
S |
|
LVMH |
746.560 |
12/08/24 |
-0.14 |
436.757 |
|
332.181 |
104.576 |
31.48 |
|
4.76 |
| | |
|
|
|
|
|
Renault |
47.314 |
12/08/24 |
-0.72 |
28.306 |
|
16.241 |
12.065 |
74.29 |
|
-10.20 |
| | |
|
|
|
|
|
BNP Paribas |
69.648 |
12/08/24 |
|
42.101 |
|
30.629 |
11.472 |
37.46 |
|
-2.23 |
| | |
|
|
|
S |
|
Cap Gemini |
206.359 |
12/08/24 |
-0.40 |
129.952 |
|
69.941 |
60.010 |
85.80 |
|
19.55 |
| | |
|
|
|
|
|
Credit Agricole |
15.522 |
12/08/24 |
0.57 |
10.123 |
|
6.784 |
3.339 |
49.22 |
|
-4.10 |
| | |
|
|
|
|
|
UnibailRodaWestfield |
78.288 |
12/08/24 |
-0.60 |
52.039 |
|
64.829 |
-12.790 |
-19.73 |
|
-42.33 |
| | |
|
|
|
|
|
Societe Generale |
24.121 |
12/08/24 |
0.44 |
16.111 |
|
16.207 |
-0.096 |
-0.59 |
|
-26.54 |
| | |
|
|
|
|
|
Michelin |
40.367 |
12/08/24 |
0.41 |
27.136 |
|
19.807 |
7.329 |
37.00 |
|
1.45 |
| | |
|
|
|
|
|
Veolia |
32.632 |
12/08/24 |
-0.14 |
23.163 |
|
19.584 |
3.579 |
18.28 |
|
-3.58 |
| | |
|
|
|
|
|
L´Oreal |
442.752 |
12/08/24 |
-1.59 |
324.438 |
|
231.723 |
92.715 |
40.01 |
|
15.01 |
| | |
|
|
|
|
|
Legrand |
109.651 |
12/08/24 |
0.09 |
81.697 |
|
56.725 |
24.972 |
44.02 |
|
11.62 |
| | |
|
|
|
S |
|
Engie |
18.026 |
12/08/24 |
0.49 |
13.853 |
|
11.137 |
2.716 |
24.38 |
|
-0.05 |
| | |
|
|
|
S |
|
Vinci |
120.665 |
12/08/24 |
-0.77 |
94.205 |
|
65.900 |
28.304 |
42.95 |
|
-3.69 |
| |
|
⇓instrument |
freshest |
⇓ Δday |
10/08/20 |
Δwk |
16/03/20 |
prc diff |
⇓ Δ21 |
|
⇓∅-RS |
| | |
|
|
|
S |
|
Air Liquide |
190.784 |
12/08/24 |
-0.79 |
163.218 |
|
110.749 |
52.469 |
47.38 |
|
19.48 |
| | |
|
|
|
S |
|
Dassault Systèmes |
39.415 |
12/08/24 |
-0.03 |
35.347 |
|
24.166 |
11.182 |
46.27 |
|
13.95 |
| | |
|
|
|
|
|
STMicroelectronics |
31.568 |
12/08/24 |
0.47 |
28.424 |
|
18.356 |
10.068 |
54.85 |
|
20.04 |
| | |
|
|
|
|
|
Sanofi |
112.460 |
12/08/24 |
-0.60 |
101.939 |
|
85.501 |
16.438 |
19.23 |
|
7.50 |
| | |
|
|
|
|
|
Danone |
70.695 |
12/08/24 |
0.07 |
64.417 |
|
60.230 |
4.187 |
6.95 |
|
-14.78 |
| | |
|
|
|
S |
|
Orange |
11.890 |
12/08/24 |
-0.25 |
11.525 |
|
10.495 |
1.030 |
9.82 |
|
-15.55 |
| | |
|
|
|
|
|
Carrefour |
16.140 |
12/08/24 |
-0.36 |
15.746 |
|
14.365 |
1.380 |
9.61 |
|
-3.51 |
| | |
|
|
|
S |
|
Stellantis |
16.438 |
12/08/24 |
-0.61 |
|
|
|
|
|
|
-na- |
| | |
|
|
|
S |
|
Bouygues |
36.582 |
12/08/24 |
-0.54 |
38.110 |
|
27.057 |
11.053 |
40.85 |
|
4.89 |
| | |
|
|
|
S |
|
Pernod Ricard |
143.176 |
12/08/24 |
-0.33 |
169.096 |
|
136.232 |
32.863 |
24.12 |
|
0.81 |
| | |
|
|
|
S |
|
Edenred |
42.189 |
12/08/24 |
-0.25 |
51.146 |
|
35.506 |
15.640 |
44.05 |
|
8.70 |
| | |
|
|
|
S |
|
Eurofins Scientific |
61.949 |
12/08/24 |
-0.26 |
76.807 |
|
49.738 |
27.069 |
54.42 |
|
45.25 |
| | |
|
|
|
S |
|
Kering |
293.699 |
12/08/24 |
-1.85 |
566.709 |
|
421.477 |
145.231 |
34.46 |
|
3.87 |
| | |
|
|
|
|
|
Vivendi |
11.153 |
12/08/24 |
0.40 |
27.448 |
|
19.612 |
7.836 |
39.96 |
|
6.77 |
| | |
|
|
|
L |
|
Teleperformance |
119.254 |
12/08/24 |
-0.10 |
305.748 |
|
179.931 |
125.816 |
69.92 |
|
32.30 |
| | |
|
|
|
L |
|
Alstom |
20.089 |
12/08/24 |
0.12 |
55.002 |
|
40.183 |
14.818 |
36.88 |
|
22.18 |
| CAC 40 - 39 out of 40 instruments rated - 10/08/20 / 16/03/20 - 37 did rise, Market-Ratio(21) in USD = 94.87 % |
| Stock Exchange Currency: EUR € Euro |
Technical Chart
Transactions Cotation Assistée en Continu in Dollar * A21 - 83/73 (1)
|
⇐ |
| |
| L/S | date buy | date sell | days | | instrument | spl | pieces | | prc buy | prc sell | ps short | prc diff | d % | asset | yield | |
| 2/01/06 |
30/01/06 |
28 |
|
- cash - |
| long |
30/01/06 |
22/05/06 |
112 |
|
|
|
Alstom |
100 |
267 |
|
37.404 |
41.525 |
|
4.121 |
11 |
11,100 |
41 |
|
| short |
22/05/06 |
16/10/06 |
147 |
|
|
|
Orange |
100 |
525 |
|
21.133 |
23.735 |
18.531 |
-2.602 |
-12 |
9,734 |
-28 |
|
| long |
16/10/06 |
19/03/07 |
154 |
|
|
|
Klépierre |
100 |
197 |
|
49.172 |
59.766 |
|
10.594 |
22 |
11,821 |
59 |
|
| short |
19/03/07 |
9/04/07 |
21 |
|
|
|
Alcatel-Lucent |
100 |
1,045 |
|
11.310 |
11.845 |
10.774 |
-0.536 |
-5 |
11,262 |
-57 |
|
| long |
9/04/07 |
11/06/07 |
63 |
|
|
|
Michelin |
100 |
402 |
|
27.986 |
31.002 |
|
3.016 |
11 |
12,474 |
81 |
|
| short |
11/06/07 |
20/07/09 |
770 |
|
|
|
Credit Agricole |
100 |
313 |
|
39.785 |
14.074 |
112.466 |
72.681 |
183 |
35,223 |
64 |
|
| long |
20/07/09 |
25/01/10 |
189 |
|
|
|
Technip |
100 |
657 |
|
53.559 |
68.744 |
|
15.185 |
28 |
45,200 |
62 |
|
| short |
25/01/10 |
29/03/10 |
63 |
|
|
|
Orange |
100 |
1,899 |
|
23.794 |
23.819 |
23.769 |
-0.025 |
0 |
45,152 |
-1 |
|
| long |
29/03/10 |
19/04/10 |
21 |
|
|
|
Safran |
100 |
1,730 |
|
26.093 |
25.501 |
|
-0.593 |
-2 |
44,127 |
-33 |
|
| short |
19/04/10 |
18/10/10 |
182 |
|
|
|
Alstom |
100 |
691 |
|
63.850 |
50.464 |
80.785 |
16.936 |
27 |
55,830 |
60 |
|
| long |
18/10/10 |
15/11/10 |
28 |
|
|
|
Valeo |
100 |
3,470 |
|
16.085 |
17.941 |
|
1.856 |
12 |
62,269 |
315 |
|
| short |
15/11/10 |
29/11/10 |
14 |
|
|
|
Alstom |
100 |
1,347 |
|
46.217 |
40.996 |
52.104 |
5.887 |
13 |
70,198 |
2,177 |
|
| long |
29/11/10 |
27/12/10 |
28 |
|
|
|
Valeo |
100 |
3,950 |
|
17.770 |
18.411 |
|
0.641 |
4 |
72,730 |
59 |
|
| short |
27/12/10 |
17/01/11 |
21 |
|
|
|
Alstom |
100 |
1,540 |
|
47.209 |
52.845 |
41.574 |
-5.636 |
-12 |
64,051 |
-89 |
|
| long |
17/01/11 |
14/03/11 |
56 |
|
|
|
Valeo |
100 |
3,158 |
|
20.279 |
18.812 |
|
-1.467 |
-7 |
59,419 |
-39 |
|
| short |
14/03/11 |
25/04/11 |
42 |
|
|
|
Carrefour |
100 |
1,362 |
|
43.625 |
45.288 |
41.962 |
-1.663 |
-4 |
57,154 |
-29 |
|
| long |
25/04/11 |
9/05/11 |
14 |
|
|
|
Alcatel-Lucent |
100 |
9,551 |
|
5.984 |
5.934 |
|
-0.049 |
-1 |
56,683 |
-19 |
|
| short |
9/05/11 |
6/02/12 |
273 |
|
|
|
Carrefour |
100 |
1,290 |
|
43.912 |
24.126 |
79.927 |
36.015 |
82 |
103,142 |
123 |
|
| long |
6/02/12 |
9/04/12 |
63 |
|
|
|
Airbus |
100 |
2,880 |
|
35.810 |
38.928 |
|
3.118 |
9 |
112,121 |
62 |
|
| short |
9/04/12 |
17/09/12 |
161 |
|
|
|
Peugeot |
100 |
10,069 |
|
11.134 |
7.694 |
16.113 |
4.979 |
45 |
162,255 |
131 |
|
| long |
17/09/12 |
24/09/12 |
7 |
|
|
|
Credit Agricole |
100 |
20,655 |
|
7.855 |
7.417 |
|
-0.438 |
-6 |
153,199 |
-95 |
|
| short |
24/09/12 |
10/12/12 |
77 |
|
|
|
Alcatel-Lucent |
100 |
137,240 |
|
1.116 |
1.063 |
1.173 |
0.056 |
5 |
160,942 |
26 |
|
| long |
10/12/12 |
14/01/13 |
35 |
|
|
|
Societe Generale |
100 |
4,320 |
|
37.249 |
45.556 |
|
8.307 |
22 |
196,829 |
716 |
|
| short |
14/01/13 |
28/01/13 |
14 |
|
|
|
Engie |
100 |
9,559 |
|
20.590 |
20.720 |
20.460 |
-0.130 |
-1 |
195,589 |
-15 |
|
| long |
28/01/13 |
11/02/13 |
14 |
|
|
|
Credit Agricole |
100 |
18,716 |
|
10.450 |
9.910 |
|
-0.540 |
-5 |
185,474 |
-75 |
|
| L/S | date buy | date sell | days | | instrument | spl | pieces | | prc buy | prc sell | ps short | prc diff | d % | asset | yield | | | short |
11/02/13 |
25/02/13 |
14 |
|
|
|
Orange |
100 |
17,603 |
|
10.536 |
9.866 |
11.253 |
0.716 |
7 |
198,086 |
456 |
|
| long |
25/02/13 |
22/04/13 |
56 |
|
|
|
Credit Agricole |
100 |
20,089 |
|
9.860 |
8.223 |
|
-1.638 |
-17 |
165,190 |
-69 |
|
| short |
22/04/13 |
5/08/13 |
105 |
|
|
|
ArcelorMittal |
100 |
4,814 |
|
34.308 |
38.116 |
30.501 |
-3.808 |
-11 |
146,861 |
-34 |
|
| long |
5/08/13 |
16/12/13 |
133 |
|
|
|
Alcatel-Lucent |
100 |
60,456 |
|
2.429 |
4.501 |
|
2.072 |
85 |
272,127 |
443 |
|
| short |
16/12/13 |
23/02/15 |
434 |
|
|
|
Technip |
100 |
2,817 |
|
96.588 |
65.647 |
142.114 |
45.525 |
47 |
400,371 |
38 |
|
| long |
23/02/15 |
6/07/15 |
133 |
|
|
|
Peugeot |
100 |
24,227 |
|
16.525 |
20.557 |
|
4.032 |
24 |
498,045 |
82 |
|
| short |
6/07/15 |
27/03/17 |
630 |
|
|
|
ArcelorMittal |
100 |
17,856 |
|
27.892 |
24.770 |
31.407 |
3.515 |
13 |
560,815 |
7 |
|
| long |
27/03/17 |
31/07/17 |
126 |
|
|
|
ArcelorMittal |
100 |
22,640 |
|
24.770 |
26.263 |
|
1.493 |
6 |
594,626 |
18 |
|
| short |
31/07/17 |
22/01/18 |
175 |
|
|
|
Carrefour |
100 |
24,731 |
|
24.043 |
22.634 |
25.540 |
1.497 |
6 |
631,640 |
13 |
|
| long |
22/01/18 |
5/02/18 |
14 |
|
|
|
Kering |
100 |
1,258 |
|
501.716 |
482.687 |
|
-19.029 |
-4 |
607,701 |
-64 |
|
| short |
5/02/18 |
6/05/19 |
455 |
|
|
|
Sanofi |
100 |
7,093 |
|
85.665 |
85.978 |
85.352 |
-0.313 |
0 |
605,479 |
0 |
|
| long |
6/05/19 |
3/06/19 |
28 |
|
|
|
LVMH |
100 |
1,568 |
|
386.010 |
382.930 |
|
-3.081 |
-1 |
600,649 |
-10 |
|
| short |
3/06/19 |
28/10/19 |
147 |
|
|
|
ArcelorMittal |
100 |
40,055 |
|
14.996 |
15.833 |
14.158 |
-0.837 |
-6 |
567,117 |
-13 |
|
| long |
28/10/19 |
2/12/19 |
35 |
|
|
|
STMicroelectronics |
100 |
24,716 |
|
22.945 |
24.158 |
|
1.213 |
5 |
597,103 |
71 |
|
| short |
2/12/19 |
30/12/19 |
28 |
|
|
|
Renault |
100 |
12,468 |
|
47.889 |
47.731 |
48.048 |
0.158 |
0 |
599,079 |
4 |
|
| long |
30/12/19 |
27/01/20 |
28 |
|
|
|
STMicroelectronics |
100 |
22,296 |
|
26.868 |
28.808 |
|
1.939 |
7 |
642,315 |
148 |
|
| short |
27/01/20 |
10/08/20 |
196 |
|
|
|
Renault |
100 |
16,605 |
|
38.682 |
28.306 |
52.861 |
14.179 |
37 |
877,763 |
79 |
|
| long |
10/08/20 |
21/09/20 |
42 |
|
|
|
Schneider Electric |
100 |
7,288 |
|
120.430 |
118.673 |
|
-1.757 |
-1 |
864,959 |
-12 |
|
| short |
21/09/20 |
28/12/20 |
98 |
|
|
|
UnibailRodaWestfield |
100 |
24,140 |
|
35.831 |
79.897 |
0.000 |
-35.831 |
-100 |
0 |
-100 |
|
| long |
28/12/20 |
19/07/21 |
203 |
|
|
|
ArcelorMittal |
100 |
0 |
|
23.278 |
29.049 |
|
5.771 |
25 |
0 |
0 |
|
| short |
19/07/21 |
13/02/23 |
574 |
|
|
|
Atos |
100 |
0 |
|
47.698 |
12.872 |
176.756 |
129.058 |
271 |
0 |
0 |
|
| long |
13/02/23 |
5/06/23 |
112 |
|
|
|
Renault |
100 |
0 |
|
44.570 |
35.701 |
|
-8.869 |
-20 |
0 |
0 |
|
| short |
5/06/23 |
18/03/24 |
287 |
|
|
|
Teleperformance |
100 |
0 |
|
148.666 |
92.444 |
239.081 |
90.415 |
61 |
0 |
0 |
|
| long |
18/03/24 |
29/04/24 |
42 |
|
|
|
Stellantis |
100 |
0 |
|
28.427 |
24.893 |
|
-3.534 |
-12 |
0 |
0 |
|
| short |
29/04/24 |
12/08/24 |
105 |
|
|
|
Teleperformance |
100 |
0 |
|
95.989 |
108.817 |
83.160 |
-12.829 |
-13 |
0 |
0 |
|
| accum | 30/01/06 |
12/08/24 | 7489 |
days out of 7517 invested (100%) |
-100 |
0 |
-47 |
|
Instrument Related Contribution
| instrument | L/S | date buy | date sell | days | prc buy | prc sell | ps short | prc diff | d % | | | total |
| Atos | short | 19/07/21 | 13/02/23 | 574 | 47.70 | 12.87 | 176.76 | 129.06 | 270.57 | | | 270.57 |
| Credit Agricole | short | 11/06/07 | 20/07/09 | 770 | 39.78 | 14.07 | 112.47 | 72.68 | 182.69 | | | |
| | long | 17/09/12 | 24/09/12 | 7 | 7.86 | 7.42 | | -0.44 | -5.58 | | | |
| | long | 28/01/13 | 11/02/13 | 14 | 10.45 | 9.91 | | -0.54 | -5.17 | | | |
| | long | 25/02/13 | 22/04/13 | 56 | 9.86 | 8.22 | | -1.64 | -16.61 | | | 111.07 |
| Technip | long | 20/07/09 | 25/01/10 | 189 | 53.56 | 68.74 | | 15.18 | 28.35 | | | |
| | short | 16/12/13 | 23/02/15 | 434 | 96.59 | 65.65 | 142.11 | 45.53 | 47.13 | | | 88.85 |
| Carrefour | short | 14/03/11 | 25/04/11 | 42 | 43.62 | 45.29 | 41.96 | -1.66 | -3.81 | | | |
| | short | 9/05/11 | 6/02/12 | 273 | 43.91 | 24.13 | 79.93 | 36.02 | 82.02 | | | |
| | short | 31/07/17 | 22/01/18 | 175 | 24.04 | 22.63 | 25.54 | 1.50 | 6.22 | | | 85.98 |
| Alcatel-Lucent | short | 19/03/07 | 9/04/07 | 21 | 11.31 | 11.85 | 10.77 | -0.54 | -4.74 | | | |
| | long | 25/04/11 | 9/05/11 | 14 | 5.98 | 5.93 | | -0.05 | -0.82 | | | |
| | short | 24/09/12 | 10/12/12 | 77 | 1.12 | 1.06 | 1.17 | 0.06 | 5.05 | | | |
| | long | 5/08/13 | 16/12/13 | 133 | 2.43 | 4.50 | | 2.07 | 85.30 | | | 83.91 |
| Peugeot | short | 9/04/12 | 17/09/12 | 161 | 11.13 | 7.69 | 16.11 | 4.98 | 44.72 | | | |
| | long | 23/02/15 | 6/07/15 | 133 | 16.53 | 20.56 | | 4.03 | 24.40 | | | 80.02 |
| Alstom | long | 30/01/06 | 22/05/06 | 112 | 37.40 | 41.53 | | 4.12 | 11.02 | | | |
| | short | 19/04/10 | 18/10/10 | 182 | 63.85 | 50.46 | 80.79 | 16.94 | 26.52 | | | |
| | short | 15/11/10 | 29/11/10 | 14 | 46.22 | 41.00 | 52.10 | 5.89 | 12.74 | | | |
| | short | 27/12/10 | 17/01/11 | 21 | 47.21 | 52.85 | 41.57 | -5.64 | -11.94 | | | 39.45 |
| Teleperformance | short | 5/06/23 | 18/03/24 | 287 | 148.67 | 92.44 | 239.08 | 90.41 | 60.82 | | | |
| | short | 29/04/24 | 12/08/24 | 105 | 95.99 | 108.82 | 83.16 | -12.83 | -13.36 | | | 39.32 |
| ArcelorMittal | short | 22/04/13 | 5/08/13 | 105 | 34.31 | 38.12 | 30.50 | -3.81 | -11.10 | | | |
| | short | 6/07/15 | 27/03/17 | 630 | 27.89 | 24.77 | 31.41 | 3.52 | 12.60 | | | |
| | long | 27/03/17 | 31/07/17 | 126 | 24.77 | 26.26 | | 1.49 | 6.03 | | | |
| | short | 3/06/19 | 28/10/19 | 147 | 15.00 | 15.83 | 14.16 | -0.84 | -5.58 | | | |
| | long | 28/12/20 | 19/07/21 | 203 | 23.28 | 29.05 | | 5.77 | 24.79 | | | 25.06 |
| instrument | L/S | date buy | date sell | days | prc buy | prc sell | ps short | prc diff | d % | | | total |
| Societe Generale | long | 10/12/12 | 14/01/13 | 35 | 37.25 | 45.56 | | 8.31 | 22.30 | | | 22.30 |
| Klépierre | long | 16/10/06 | 19/03/07 | 154 | 49.17 | 59.77 | | 10.59 | 21.54 | | | 21.54 |
| STMicroelectronics | long | 28/10/19 | 2/12/19 | 35 | 22.94 | 24.16 | | 1.21 | 5.29 | | | |
| | long | 30/12/19 | 27/01/20 | 28 | 26.87 | 28.81 | | 1.94 | 7.22 | | | 12.89 |
| Michelin | long | 9/04/07 | 11/06/07 | 63 | 27.99 | 31.00 | | 3.02 | 10.78 | | | 10.78 |
| Renault | short | 2/12/19 | 30/12/19 | 28 | 47.89 | 47.73 | 48.05 | 0.16 | 0.33 | | | |
| | short | 27/01/20 | 10/08/20 | 196 | 38.68 | 28.31 | 52.86 | 14.18 | 36.66 | | | |
| | long | 13/02/23 | 5/06/23 | 112 | 44.57 | 35.70 | | -8.87 | -19.90 | | | 9.83 |
| Airbus | long | 6/02/12 | 9/04/12 | 63 | 35.81 | 38.93 | | 3.12 | 8.71 | | | 8.71 |
| Valeo | long | 18/10/10 | 15/11/10 | 28 | 16.09 | 17.94 | | 1.86 | 11.54 | | | |
| | long | 29/11/10 | 27/12/10 | 28 | 17.77 | 18.41 | | 0.64 | 3.61 | | | |
| | long | 17/01/11 | 14/03/11 | 56 | 20.28 | 18.81 | | -1.47 | -7.23 | | | 7.20 |
| Sanofi | short | 5/02/18 | 6/05/19 | 455 | 85.66 | 85.98 | 85.35 | -0.31 | -0.37 | | | -0.37 |
| Engie | short | 14/01/13 | 28/01/13 | 14 | 20.59 | 20.72 | 20.46 | -0.13 | -0.63 | | | -0.63 |
| LVMH | long | 6/05/19 | 3/06/19 | 28 | 386.01 | 382.93 | | -3.08 | -0.80 | | | -0.80 |
| Schneider Electric | long | 10/08/20 | 21/09/20 | 42 | 120.43 | 118.67 | | -1.76 | -1.46 | | | -1.46 |
| Safran | long | 29/03/10 | 19/04/10 | 21 | 26.09 | 25.50 | | -0.59 | -2.27 | | | -2.27 |
| Kering | long | 22/01/18 | 5/02/18 | 14 | 501.72 | 482.69 | | -19.03 | -3.79 | | | -3.79 |
| Orange | short | 22/05/06 | 16/10/06 | 147 | 21.13 | 23.74 | 18.53 | -2.60 | -12.31 | | | |
| | short | 25/01/10 | 29/03/10 | 63 | 23.79 | 23.82 | 23.77 | -0.02 | -0.10 | | | |
| | short | 11/02/13 | 25/02/13 | 14 | 10.54 | 9.87 | 11.25 | 0.72 | 6.80 | | | -6.45 |
| Stellantis | long | 18/03/24 | 29/04/24 | 42 | 28.43 | 24.89 | | -3.53 | -12.43 | | | -12.43 |
| UnibailRodaWestfield | short | 21/09/20 | 28/12/20 | 98 | 35.83 | 79.90 | 0.00 | -35.83 | -100.00 | | | -100.00 |
Annotations
| 20/02/24 | CAC 40 | | | Component update: Edenred replaces Worldline |
| 16/06/22 | Michelin | | | stock split 1:4 (four for one) |
| 7/07/21 | Dassault Systèmes | | | stock split 1:5 (five for one) |
| 19/11/20 | Eurofins Scientific | | | stock split 1:10 (ten for one) |
| 5/06/18 | Unibail-Rodamco | | | ISIN change from FR0000124711 to FR0013326246 following Westfield acquisition |
| 18/05/17 | ArcelorMittal | | | reverse stock split 3:1 (one for three)
ISIN change from LU0323134006 to LU1598757687 |
| 20/03/17 | CAC 40 | | | Atos replaces Klépierre |
| 21/03/16 | CAC 40 | | | Sodexo replaces Alstom |
| 14/01/16 | CAC 40 | | | Nokia replaces Alcatel-Lucent |
| 6/01/16 | CAC 40 | | | complete analysis |
| 21/12/15 | CAC 40 | | | Klépierre replaces EDF |
| 23/08/15 | CAC 40 | | | complete analysis |
| 24/04/15 | GDF Suez | | | changes name to Engie |
|
|