| | |
| | |

Assessment - Finance in Pound sterling - 1/05/17 - RS = 43
⇐
| |
|
⇓instrument |
freshest |
⇓ Δday |
1/05/17 |
Δwk |
4/07/16 |
prc diff |
⇓ Δ43 |
|
⇓∅-RS |
| |  |
 |
 |
|
|
 |
SOM Finance |
321.315 |
12/08/24 |
0.25 |
199.437 |
|
152.983 |
46.453 |
30.37 |
|
13.22 |
| | |
|
|
|
|
|
Gr Fin Galicia |
210.241 |
12/08/24 |
0.48 |
3.060 |
|
2.311 |
0.749 |
32.42 |
|
28.78 |
| | |
|
|
|
|
|
Banco Macro |
336.789 |
12/08/24 |
0.91 |
6.769 |
|
5.509 |
1.260 |
22.87 |
|
18.16 |
| | |
|
|
|
|
|
BBVA Banco Francés |
202.930 |
12/08/24 |
0.75 |
4.790 |
|
5.256 |
-0.466 |
-8.87 |
|
-3.29 |
| | |
|
|
|
|
|
Supervielle |
89.491 |
12/08/24 |
1.14 |
2.637 |
|
1.988 |
0.649 |
32.64 |
|
-na- |
| | |
|
|
|
S |
|
Molina Healthcare |
261.745 |
12/08/24 |
-0.15 |
39.378 |
|
37.499 |
1.879 |
5.01 |
|
-2.65 |
| | |
|
|
|
L |
|
Bajaj Finance |
79.739 |
12/08/24 |
-0.15 |
15.385 |
|
9.186 |
6.199 |
67.48 |
|
41.15 |
| | |
|
|
|
|
|
Quálitas |
6.821 |
12/08/24 |
-2.49 |
1.321 |
|
1.055 |
0.267 |
25.27 |
|
14.12 |
| | |
|
|
|
|
|
ICICI Bank |
14.152 |
12/08/24 |
0.10 |
3.353 |
|
2.786 |
0.568 |
20.37 |
|
12.64 |
| | |
|
|
|
|
|
Mastercard |
353.228 |
12/08/24 |
-0.24 |
90.204 |
|
66.863 |
23.342 |
34.91 |
|
14.78 |
| | |
|
|
|
|
|
Bajaj Finserv |
18.812 |
12/08/24 |
-0.08 |
5.510 |
|
2.633 |
2.877 |
109.24 |
|
71.95 |
| | |
|
|
|
L |
|
flatexDEGIRO |
10.359 |
12/08/24 |
0.20 |
3.066 |
|
2.742 |
0.324 |
11.81 |
|
-1.29 |
| | |
|
|
|
S |
|
UnitedHealth |
438.184 |
12/08/24 |
1.17 |
135.333 |
|
106.002 |
29.331 |
27.67 |
|
18.95 |
| | |
|
|
|
L |
|
Verisk Analytics |
203.368 |
12/08/24 |
-0.67 |
64.159 |
|
60.902 |
3.257 |
5.35 |
|
2.00 |
| | |
|
|
|
|
|
American Express |
183.749 |
12/08/24 |
-0.34 |
61.415 |
|
45.671 |
15.744 |
34.47 |
|
15.58 |
| | |
|
|
|
L |
|
LSE Group |
9,938.000 |
12/08/24 |
1.12 |
3,382.160 |
|
2,493.000 |
889.160 |
35.67 |
|
19.64 |
| | |
|
|
|
|
|
Visa |
201.453 |
12/08/24 |
0.05 |
70.740 |
|
56.049 |
14.691 |
26.21 |
|
12.06 |
| | |
|
|
|
L |
|
State Bank of India |
9.805 |
12/08/24 |
-1.42 |
3.492 |
|
2.496 |
0.996 |
39.92 |
|
25.49 |
| | |
|
|
|
|
|
Lowe´s |
179.114 |
12/08/24 |
-2.02 |
65.423 |
|
59.902 |
5.521 |
9.22 |
|
11.89 |
| | |
|
|
|
|
|
Berkshire Hathaway |
333.616 |
12/08/24 |
-0.30 |
128.241 |
|
108.335 |
19.906 |
18.37 |
|
8.67 |
| | |
|
|
|
|
|
Hypoport |
219.102 |
12/08/24 |
4.68 |
85.375 |
|
70.887 |
14.488 |
20.44 |
|
23.29 |
| | |
|
|
|
L |
|
Münchener Rück |
371.256 |
12/08/24 |
1.01 |
148.731 |
|
126.315 |
22.416 |
17.75 |
|
4.90 |
| | |
|
|
|
|
|
MS&AD Insurance |
20.900 |
9/08/24 |
-0.50 |
8.511 |
|
6.406 |
2.105 |
32.87 |
|
11.39 |
| | |
|
|
|
|
|
JP Morgan Chase |
159.828 |
12/08/24 |
0.19 |
67.484 |
|
46.100 |
21.384 |
46.39 |
|
20.33 |
| | |
|
|
|
|
|
Unicredit |
29.222 |
12/08/24 |
0.38 |
12.629 |
|
7.591 |
5.037 |
66.35 |
|
25.18 |
| |
|
⇓instrument |
freshest |
⇓ Δday |
1/05/17 |
Δwk |
4/07/16 |
prc diff |
⇓ Δ43 |
|
⇓∅-RS |
| | |
|
|
|
L |
|
Axis Bank |
14.049 |
12/08/24 |
1.89 |
6.142 |
|
6.080 |
0.062 |
1.02 |
|
4.62 |
| | |
|
|
|
|
|
FinecoBank |
12.202 |
12/08/24 |
0.94 |
5.520 |
|
4.667 |
0.853 |
18.29 |
|
16.50 |
| | |
|
|
|
L |
|
Unipol |
7.587 |
12/08/24 |
0.06 |
3.457 |
|
1.763 |
1.695 |
96.15 |
|
38.95 |
| | |
|
|
|
|
|
Sumitomo Mitsui FG |
62.206 |
9/08/24 |
3.71 |
28.599 |
|
21.500 |
7.099 |
33.02 |
|
7.20 |
| | |
|
|
|
|
|
Macquarie Group |
119.282 |
12/08/24 |
1.30 |
54.927 |
|
38.877 |
16.050 |
41.29 |
|
18.80 |
| | |
|
|
|
L |
|
Morgan Stanley |
73.515 |
12/08/24 |
0.13 |
33.905 |
|
19.506 |
14.399 |
73.82 |
|
30.29 |
| | |
|
|
|
|
|
Banco BPM |
4.888 |
12/08/24 |
-0.31 |
2.257 |
|
1.746 |
0.511 |
29.28 |
|
4.97 |
| | |
|
|
|
L |
|
Goldman Sachs |
376.335 |
12/08/24 |
-0.97 |
174.292 |
|
111.563 |
62.729 |
56.23 |
|
21.06 |
| | |
|
|
|
|
|
National Bank CA |
64.895 |
12/08/24 |
0.39 |
30.099 |
|
26.023 |
4.076 |
15.66 |
|
4.36 |
| | |
|
|
|
L |
|
HDFC Bank |
20.032 |
12/08/24 |
0.60 |
9.322 |
|
6.572 |
2.750 |
41.84 |
|
28.91 |
| | |
|
|
|
|
|
Japan Exchange |
23.015 |
9/08/24 |
4.70 |
10.779 |
|
8.726 |
2.053 |
23.53 |
|
-2.06 |
| | |
|
|
|
|
|
Sompo |
20.522 |
9/08/24 |
0.02 |
9.822 |
|
6.813 |
3.009 |
44.16 |
|
19.59 |
| | |
|
|
|
|
|
Hannover Rück |
192.221 |
12/08/24 |
5.23 |
93.068 |
|
79.272 |
13.796 |
17.40 |
|
11.10 |
| | |
|
|
|
|
|
Deutsche Börse |
156.507 |
12/08/24 |
0.54 |
75.950 |
|
60.698 |
15.252 |
25.13 |
|
18.87 |
| | |
|
|
|
|
|
Euronext |
78.233 |
12/08/24 |
1.26 |
38.064 |
|
26.983 |
11.080 |
41.06 |
|
17.80 |
| | |
|
|
|
|
|
Swiss Life |
507.834 |
12/08/24 |
0.62 |
252.126 |
|
174.324 |
77.802 |
44.63 |
|
22.14 |
| | |
|
|
|
|
|
Talanx |
56.212 |
12/08/24 |
1.92 |
27.971 |
|
22.535 |
5.436 |
24.12 |
|
12.49 |
| | |
|
|
|
|
|
Mitsubishi UFJ |
9.784 |
9/08/24 |
1.22 |
4.937 |
|
3.341 |
1.595 |
47.74 |
|
16.75 |
| | |
|
|
|
|
|
Dai-ichi Life |
26.379 |
9/08/24 |
3.15 |
13.328 |
|
8.194 |
5.134 |
62.66 |
|
18.07 |
| | |
|
|
|
L |
|
Kotak Mahindra Bank |
21.389 |
12/08/24 |
0.16 |
10.884 |
|
8.330 |
2.554 |
30.66 |
|
21.87 |
| | |
|
|
|
|
|
Orix |
23.133 |
9/08/24 |
4.68 |
11.809 |
|
9.849 |
1.960 |
19.90 |
|
4.06 |
| | |
|
|
|
L |
|
Storebrand |
9.575 |
12/08/24 |
0.38 |
5.113 |
|
2.796 |
2.316 |
82.84 |
|
36.10 |
| | |
|
|
|
|
|
Banco Comercial |
0.319 |
12/08/24 |
0.16 |
0.173 |
|
0.201 |
-0.027 |
-13.58 |
|
-2.47 |
| | |
|
|
|
|
|
F&C Investment Trust |
1,026.000 |
12/08/24 |
|
565.500 |
|
448.500 |
117.000 |
26.09 |
|
11.59 |
| | |
|
|
|
|
|
DBS Bank |
18.884 |
12/08/24 |
1.22 |
10.754 |
|
8.835 |
1.918 |
21.71 |
|
16.72 |
| |
|
⇓instrument |
freshest |
⇓ Δday |
1/05/17 |
Δwk |
4/07/16 |
prc diff |
⇓ Δ43 |
|
⇓∅-RS |
| | |
|
|
|
|
|
Travelers Companies |
162.572 |
12/08/24 |
-1.29 |
93.933 |
|
89.439 |
4.494 |
5.02 |
|
4.34 |
| | |
|
|
|
|
|
Sumitomo Mitsui Trst |
23.029 |
9/08/24 |
2.72 |
13.512 |
|
11.908 |
1.605 |
13.48 |
|
1.47 |
| | |
|
|
|
L |
|
Zurich Insurance |
361.838 |
12/08/24 |
0.85 |
214.440 |
|
184.479 |
29.961 |
16.24 |
|
7.79 |
| | |
|
|
|
|
|
China Merchants Bank |
3.615 |
12/08/24 |
-0.65 |
2.152 |
|
2.004 |
0.148 |
7.40 |
|
3.51 |
| | |
|
|
|
|
|
KB Financial |
56.353 |
12/08/24 |
0.73 |
34.222 |
|
21.361 |
12.861 |
60.21 |
|
27.49 |
| | |
|
|
|
|
|
Beazley |
732.000 |
12/08/24 |
1.24 |
447.900 |
|
366.200 |
81.700 |
22.31 |
|
15.22 |
| | |
|
|
|
|
|
Capital One |
102.413 |
12/08/24 |
-1.56 |
63.229 |
|
47.379 |
15.849 |
33.45 |
|
7.25 |
| | |
|
|
|
L |
|
Bank of America |
29.587 |
12/08/24 |
-0.29 |
18.301 |
|
9.858 |
8.443 |
85.65 |
|
35.85 |
| | |
|
|
|
L |
|
China Merchants B HK |
3.243 |
12/08/24 |
|
2.011 |
|
1.703 |
0.308 |
18.06 |
|
9.33 |
| | |
|
|
|
S |
|
DNB |
19.393 |
12/08/24 |
0.14 |
12.113 |
|
8.988 |
3.125 |
34.77 |
|
14.80 |
| | |
|
|
|
L |
|
Royal Bank CA |
84.371 |
12/08/24 |
-0.72 |
52.905 |
|
45.232 |
7.673 |
16.96 |
|
5.30 |
| | |
|
|
|
|
|
ASR |
37.066 |
12/08/24 |
0.46 |
23.246 |
|
15.829 |
7.417 |
46.85 |
|
-na- |
| | |
|
|
|
|
|
Mediobanca |
11.860 |
12/08/24 |
0.94 |
7.456 |
|
4.188 |
3.267 |
78.02 |
|
29.43 |
| | |
|
|
|
|
|
FBD |
10.904 |
12/08/24 |
0.39 |
6.889 |
|
4.849 |
2.041 |
42.09 |
|
20.92 |
| | |
|
|
|
|
|
Generali |
18.977 |
12/08/24 |
1.35 |
12.282 |
|
8.704 |
3.579 |
41.12 |
|
15.51 |
| | |
|
|
|
|
|
Hana Financial |
41.326 |
12/08/24 |
0.33 |
26.776 |
|
15.529 |
11.247 |
72.43 |
|
33.16 |
| | |
|
|
|
S |
|
Edenred |
30.338 |
12/08/24 |
-0.25 |
19.865 |
|
16.123 |
3.742 |
23.21 |
|
19.87 |
| | |
|
|
|
|
|
Resona |
6.269 |
9/08/24 |
3.93 |
4.115 |
|
2.752 |
1.363 |
49.51 |
|
18.69 |
| | |
|
|
|
L |
|
Commonwealth Bank |
76.200 |
12/08/24 |
0.76 |
51.057 |
|
41.622 |
9.435 |
22.67 |
|
12.84 |
| | |
|
|
|
|
|
S.E.B |
13.211 |
12/08/24 |
-0.10 |
8.942 |
|
6.446 |
2.496 |
38.72 |
|
15.65 |
| | |
|
|
|
|
|
Concordia Financial |
5.296 |
9/08/24 |
3.82 |
3.600 |
|
3.012 |
0.588 |
19.52 |
|
-0.41 |
| | |
|
|
|
|
|
NN |
37.751 |
12/08/24 |
0.74 |
25.731 |
|
20.152 |
5.579 |
27.69 |
|
7.34 |
| | |
|
|
|
|
|
Allianz |
216.312 |
12/08/24 |
|
147.758 |
|
105.878 |
41.881 |
39.56 |
|
20.40 |
| | |
|
|
|
|
|
UBS |
19.349 |
12/08/24 |
0.44 |
13.237 |
|
9.782 |
3.455 |
35.32 |
|
15.49 |
| | |
|
|
|
|
|
Credit Saison |
20.442 |
9/08/24 |
1.20 |
14.046 |
|
12.587 |
1.460 |
11.60 |
|
2.25 |
| |
|
⇓instrument |
freshest |
⇓ Δday |
1/05/17 |
Δwk |
4/07/16 |
prc diff |
⇓ Δ43 |
|
⇓∅-RS |
| | |
|
|
|
|
|
Banca Mediolanum |
8.647 |
12/08/24 |
1.29 |
5.942 |
|
4.977 |
0.965 |
19.40 |
|
6.89 |
| | |
|
|
|
|
|
Banca Generali |
32.189 |
12/08/24 |
0.74 |
22.307 |
|
14.436 |
7.872 |
54.53 |
|
25.19 |
| | |
|
|
|
|
|
Chiba Bank |
7.443 |
9/08/24 |
3.22 |
5.182 |
|
3.545 |
1.637 |
46.17 |
|
16.49 |
| | |
|
|
|
|
|
Daiwa Securities |
6.714 |
9/08/24 |
0.70 |
4.687 |
|
3.960 |
0.727 |
18.35 |
|
2.07 |
| | |
|
|
|
|
|
Fukuoka |
25.242 |
9/08/24 |
5.30 |
17.688 |
|
12.366 |
5.322 |
43.03 |
|
13.63 |
| | |
|
|
|
|
|
Manulife Financial |
19.465 |
12/08/24 |
-0.35 |
13.669 |
|
10.384 |
3.285 |
31.64 |
|
14.32 |
| | |
|
|
|
|
|
OCBC |
7.686 |
12/08/24 |
0.29 |
5.446 |
|
4.910 |
0.536 |
10.92 |
|
9.51 |
| | |
|
|
|
|
|
Jyske Bank |
58.997 |
12/08/24 |
0.48 |
41.809 |
|
28.428 |
13.382 |
47.07 |
|
19.64 |
| | |
|
|
|
|
|
Erste Group Bank |
38.968 |
12/08/24 |
0.37 |
27.743 |
|
16.744 |
10.999 |
65.69 |
|
25.71 |
| | |
|
|
|
|
|
Inbursa |
1.832 |
12/08/24 |
-2.28 |
1.313 |
|
1.309 |
0.003 |
0.24 |
|
6.59 |
| | |
|
|
|
|
|
Commerzbank |
10.499 |
12/08/24 |
0.89 |
7.603 |
|
4.808 |
2.795 |
58.13 |
|
32.11 |
| | |
|
|
|
|
|
Man Group |
214.000 |
12/08/24 |
0.28 |
155.520 |
|
115.180 |
40.340 |
35.02 |
|
23.60 |
| | |
|
|
|
|
|
Agricultural Bank |
0.522 |
12/08/24 |
0.65 |
0.380 |
|
0.370 |
0.011 |
2.88 |
|
4.51 |
| | |
|
|
|
S |
|
Sun Life Financial |
37.399 |
12/08/24 |
-0.11 |
27.513 |
|
24.752 |
2.761 |
11.16 |
|
2.19 |
| | |
|
|
|
|
|
Mizuho |
19.280 |
9/08/24 |
2.38 |
14.234 |
|
10.744 |
3.489 |
32.47 |
|
8.79 |
| | |
|
|
|
|
|
Bank of Ireland |
7.956 |
12/08/24 |
-0.93 |
5.896 |
|
4.532 |
1.364 |
30.09 |
|
8.24 |
| | |
|
|
|
|
|
MetLife |
54.144 |
12/08/24 |
-0.40 |
40.284 |
|
29.718 |
10.567 |
35.56 |
|
10.42 |
| | |
|
|
|
L |
|
United Overseas Bank |
16.278 |
12/08/24 |
0.58 |
12.115 |
|
10.381 |
1.735 |
16.71 |
|
11.60 |
| | |
|
|
|
|
|
Admiral Group |
2,698.000 |
12/08/24 |
0.86 |
2,011.140 |
|
2,009.000 |
2.140 |
0.11 |
|
3.86 |
| | |
|
|
|
|
|
BNY Mellon |
49.044 |
12/08/24 |
-0.80 |
36.572 |
|
28.626 |
7.945 |
27.75 |
|
10.23 |
| | |
|
|
|
|
|
PayPal |
49.191 |
12/08/24 |
-1.95 |
36.851 |
|
27.355 |
9.496 |
34.71 |
|
20.11 |
| | |
|
|
|
|
|
Medibank Private |
2.265 |
12/08/24 |
0.52 |
1.710 |
|
1.685 |
0.026 |
1.53 |
|
4.57 |
| | |
|
|
|
|
|
Samsung F&M Ins |
242.149 |
12/08/24 |
1.00 |
183.063 |
|
174.950 |
8.113 |
4.64 |
|
-1.74 |
| | |
|
|
|
L |
|
Singapore Exchange |
5.430 |
12/08/24 |
-0.51 |
4.113 |
|
4.306 |
-0.193 |
-4.49 |
|
-1.43 |
| | |
|
|
|
|
|
Axa |
27.345 |
12/08/24 |
-0.77 |
20.718 |
|
14.730 |
5.989 |
40.66 |
|
17.13 |
| |
|
⇓instrument |
freshest |
⇓ Δday |
1/05/17 |
Δwk |
4/07/16 |
prc diff |
⇓ Δ43 |
|
⇓∅-RS |
| | |
|
|
|
|
|
Intesa Sanpaolo |
2.934 |
12/08/24 |
0.54 |
2.257 |
|
1.368 |
0.889 |
64.97 |
|
24.67 |
| | |
|
|
|
|
|
Cdn Imp Bk Comm |
39.526 |
12/08/24 |
-0.36 |
31.072 |
|
28.441 |
2.631 |
9.25 |
|
0.14 |
| | |
|
|
|
S |
|
Banorte |
5.706 |
12/08/24 |
0.58 |
4.498 |
|
4.272 |
0.226 |
5.29 |
|
10.06 |
| | |
|
|
|
S |
|
ASX |
38.015 |
12/08/24 |
0.73 |
30.064 |
|
26.302 |
3.763 |
14.31 |
|
7.43 |
| | |
|
|
|
L |
|
NatWest |
334.600 |
12/08/24 |
0.48 |
265.140 |
|
167.220 |
97.920 |
58.56 |
|
27.55 |
| | |
|
|
|
|
|
Vienna Insurance |
25.190 |
12/08/24 |
1.36 |
20.127 |
|
13.983 |
6.144 |
43.94 |
|
22.42 |
| | |
|
|
|
L |
|
QBE Insurance |
9.451 |
12/08/24 |
0.87 |
7.607 |
|
5.944 |
1.662 |
27.96 |
|
15.51 |
| | |
|
|
|
|
|
Ind and Comm Bk |
0.674 |
12/08/24 |
1.18 |
0.549 |
|
0.513 |
0.036 |
6.99 |
|
7.06 |
| | |
|
|
|
S |
|
Toronto-Dominion |
44.528 |
12/08/24 |
0.19 |
36.452 |
|
32.891 |
3.560 |
10.83 |
|
1.65 |
| | |
|
|
|
|
|
Banco Bilbao Viz |
7.543 |
12/08/24 |
0.27 |
6.213 |
|
4.280 |
1.933 |
45.15 |
|
25.20 |
| | |
|
|
|
L |
|
HK Exchgs & Clrg |
23.112 |
12/08/24 |
0.96 |
19.121 |
|
18.187 |
0.934 |
5.14 |
|
-0.42 |
| | |
|
|
|
|
|
Suncorp-Metway |
9.831 |
12/08/24 |
1.38 |
8.179 |
|
6.988 |
1.191 |
17.04 |
|
9.56 |
| | |
|
|
|
|
|
Swiss Re |
80.979 |
12/08/24 |
0.10 |
67.431 |
|
65.614 |
1.817 |
2.77 |
|
-2.34 |
| | |
|
|
|
|
|
Caixabank |
4.209 |
12/08/24 |
0.52 |
3.525 |
|
1.679 |
1.846 |
109.99 |
|
54.19 |
| | |
|
|
|
|
|
Aegon |
4.702 |
12/08/24 |
0.22 |
3.956 |
|
2.912 |
1.044 |
35.83 |
|
10.03 |
| | |
|
|
|
|
|
New Zealand Exchange |
0.676 |
12/08/24 |
0.80 |
0.574 |
|
0.550 |
0.024 |
4.40 |
|
0.63 |
| | |
|
|
|
S |
|
Regional |
5.258 |
12/08/24 |
-0.39 |
4.501 |
|
4.295 |
0.205 |
4.78 |
|
3.01 |
| | |
|
|
|
|
|
Azimut |
17.667 |
12/08/24 |
1.41 |
15.148 |
|
12.002 |
3.146 |
26.21 |
|
13.02 |
| | |
|
|
|
S |
|
Citic Secs |
2.124 |
12/08/24 |
-0.11 |
1.827 |
|
1.877 |
-0.050 |
-2.69 |
|
-2.48 |
| | |
|
|
|
|
|
AIG |
55.508 |
12/08/24 |
-0.62 |
47.757 |
|
39.786 |
7.971 |
20.03 |
|
3.32 |
| | |
|
|
|
S |
|
Bank Montreal |
63.437 |
12/08/24 |
-0.10 |
54.709 |
|
48.261 |
6.447 |
13.36 |
|
4.21 |
| | |
|
|
|
|
|
Insurance Australia |
4.180 |
12/08/24 |
0.56 |
3.672 |
|
3.148 |
0.524 |
16.64 |
|
9.22 |
| | |
|
|
|
|
|
Shinhan |
36.954 |
12/08/24 |
0.19 |
32.480 |
|
24.932 |
7.548 |
30.27 |
|
12.98 |
| | |
|
|
|
|
|
Tryg |
16.892 |
12/08/24 |
0.61 |
14.903 |
|
13.785 |
1.118 |
8.11 |
|
2.18 |
| | |
|
|
|
L |
|
China Life |
3.319 |
12/08/24 |
0.44 |
2.942 |
|
2.412 |
0.530 |
21.98 |
|
12.52 |
| |
|
⇓instrument |
freshest |
⇓ Δday |
1/05/17 |
Δwk |
4/07/16 |
prc diff |
⇓ Δ43 |
|
⇓∅-RS |
| | |
|
|
|
|
|
Ageas |
35.824 |
12/08/24 |
0.33 |
31.783 |
|
25.859 |
5.924 |
22.91 |
|
9.59 |
| | |
|
|
|
|
|
Nomura |
5.132 |
9/08/24 |
2.06 |
4.640 |
|
2.732 |
1.908 |
69.86 |
|
21.28 |
| | |
|
|
|
|
|
Nordea Bank |
10.502 |
12/08/24 |
-0.13 |
9.555 |
|
6.258 |
3.297 |
52.69 |
|
21.28 |
| | |
|
|
|
|
|
IBK |
9.208 |
12/08/24 |
0.37 |
8.538 |
|
7.404 |
1.134 |
15.32 |
|
3.86 |
| | |
|
|
|
L |
|
Ping An Ins |
4.572 |
12/08/24 |
0.02 |
4.270 |
|
3.669 |
0.602 |
16.41 |
|
8.50 |
| | |
|
|
|
|
|
National Australia B |
21.010 |
12/08/24 |
1.01 |
19.901 |
|
14.220 |
5.681 |
39.95 |
|
19.84 |
| | |
|
|
|
L |
|
Industrial Bank |
1.832 |
12/08/24 |
-0.55 |
1.740 |
|
1.749 |
-0.009 |
-0.53 |
|
-5.59 |
| | |
|
|
|
|
|
Barclays |
220.100 |
12/08/24 |
0.85 |
212.240 |
|
136.440 |
75.800 |
55.56 |
|
13.94 |
| | |
|
|
|
|
|
Hiscox |
1,189.000 |
12/08/24 |
1.89 |
1,161.000 |
|
1,023.000 |
138.000 |
13.49 |
|
11.92 |
| | |
|
|
|
|
|
ING Groep |
12.876 |
12/08/24 |
0.21 |
12.629 |
|
7.570 |
5.058 |
66.82 |
|
27.71 |
| | |
|
|
|
|
|
Banco Sabadell |
1.511 |
12/08/24 |
0.45 |
1.496 |
|
0.999 |
0.497 |
49.80 |
|
32.42 |
| | |
|
|
|
L |
|
HSBC |
643.900 |
12/08/24 |
0.22 |
639.020 |
|
463.760 |
175.260 |
37.79 |
|
12.41 |
| | |
|
|
|
L |
|
Glanbia |
15.308 |
12/08/24 |
0.50 |
15.207 |
|
14.335 |
0.872 |
6.08 |
|
8.33 |
| | |
|
|
|
|
|
KBC |
56.280 |
12/08/24 |
-0.21 |
56.026 |
|
35.444 |
20.583 |
58.07 |
|
23.36 |
| | |
|
|
|
|
|
Uniqa |
6.492 |
12/08/24 |
0.26 |
6.475 |
|
4.432 |
2.043 |
46.11 |
|
21.00 |
| | |
|
|
|
L |
|
HSBC |
6.422 |
12/08/24 |
0.63 |
6.412 |
|
4.670 |
1.741 |
37.29 |
|
12.79 |
| | |
|
|
|
|
|
Adyen |
928.139 |
12/08/24 |
1.14 |
|
|
|
|
|
|
-na- |
| | |
|
|
|
|
|
AIB |
4.223 |
12/08/24 |
-0.38 |
|
|
|
|
|
|
-na- |
| | |
|
|
|
|
|
Banco de Valores |
17.192 |
12/08/24 |
-0.15 |
|
|
|
|
|
|
-na- |
| | |
|
|
|
S |
|
Banco del Bajio |
2.156 |
12/08/24 |
0.64 |
|
|
|
|
|
|
-na- |
| | |
|
|
|
|
|
Bolsas y Mercados |
14.495 |
12/08/24 |
|
|
|
|
|
|
|
-na- |
| | |
|
|
|
S |
|
creditshelf |
0.042 |
12/08/24 |
|
|
|
|
|
|
|
-na- |
| | |
|
|
|
L |
|
DFV |
5.241 |
12/08/24 |
-0.80 |
|
|
|
|
|
|
-na- |
| | |
|
|
|
S |
|
DWS |
28.013 |
12/08/24 |
0.61 |
|
|
|
|
|
|
-na- |
| | |
|
|
|
|
|
HDFC Life |
8.476 |
12/08/24 |
0.01 |
|
|
|
|
|
|
-na- |
| |
|
⇓instrument |
freshest |
⇓ Δday |
1/05/17 |
Δwk |
4/07/16 |
prc diff |
⇓ Δ43 |
|
⇓∅-RS |
| | |
|
|
|
S |
|
KakaoBank |
14.925 |
12/08/24 |
1.39 |
|
|
|
|
|
|
-na- |
| | |
|
|
|
S |
|
KakaoPay |
17.043 |
12/08/24 |
2.67 |
|
|
|
|
|
|
-na- |
| | |
|
|
|
S |
|
M&G |
203.900 |
12/08/24 |
1.09 |
|
|
|
|
|
|
-na- |
| | |
|
|
|
|
|
Mandatum |
3.567 |
12/08/24 |
|
|
|
|
|
|
|
-na- |
| | |
|
|
|
S |
|
Nexi |
4.798 |
12/08/24 |
0.46 |
|
|
|
|
|
|
-na- |
| | |
|
|
|
|
|
SBI Life |
20.574 |
12/08/24 |
-1.17 |
|
|
|
|
|
|
-na- |
| | |
|
|
|
|
|
Shizuoka Financial |
8.636 |
9/08/24 |
2.17 |
|
|
|
|
|
|
-na- |
| | |
|
|
|
|
|
Unicaja Banco |
0.972 |
12/08/24 |
-0.86 |
|
|
|
|
|
|
-na- |
| | |
|
|
|
|
|
Standard Chartered |
722.000 |
12/08/24 |
0.92 |
723.810 |
|
571.600 |
152.210 |
26.63 |
|
12.38 |
| | |
|
|
|
L |
|
MLP |
4.877 |
12/08/24 |
0.87 |
4.892 |
|
2.669 |
2.223 |
83.28 |
|
44.68 |
| | |
|
|
|
L |
|
China Pacific Ins |
3.083 |
12/08/24 |
0.22 |
3.123 |
|
3.102 |
0.022 |
0.69 |
|
-2.17 |
| | |
|
|
|
|
|
Swedbank |
18.155 |
12/08/24 |
-0.86 |
18.401 |
|
15.592 |
2.809 |
18.02 |
|
4.24 |
| | |
|
|
|
|
|
Woori Financial |
10.075 |
12/08/24 |
0.55 |
10.212 |
|
6.303 |
3.908 |
62.01 |
|
30.95 |
| | |
|
|
|
|
|
Citigroup |
44.835 |
12/08/24 |
|
46.090 |
|
31.734 |
14.356 |
45.24 |
|
18.30 |
| | |
|
|
|
|
|
Credit Agricole |
11.162 |
12/08/24 |
0.57 |
11.538 |
|
6.308 |
5.230 |
82.91 |
|
40.28 |
| | |
|
|
|
L |
|
AIA |
5.179 |
12/08/24 |
-1.33 |
5.374 |
|
4.525 |
0.849 |
18.77 |
|
13.07 |
| | |
|
|
|
|
|
Wells Fargo |
40.354 |
12/08/24 |
-1.33 |
42.215 |
|
35.392 |
6.823 |
19.28 |
|
7.83 |
| | |
|
|
|
|
|
BPER Banca |
4.028 |
12/08/24 |
-0.27 |
4.243 |
|
2.442 |
1.801 |
73.74 |
|
22.84 |
| | |
|
|
|
|
|
IndusInd Bank |
16.300 |
12/08/24 |
0.08 |
17.494 |
|
12.402 |
5.092 |
41.06 |
|
27.89 |
| | |
|
|
|
L |
|
Nordea Bank |
8.808 |
12/08/24 |
-0.19 |
9.543 |
|
6.261 |
3.282 |
52.42 |
|
21.51 |
| | |
|
|
|
|
|
Sampo |
34.226 |
12/08/24 |
0.40 |
37.185 |
|
31.383 |
5.802 |
18.49 |
|
7.94 |
| | |
|
|
|
L |
|
Julius Bär |
37.126 |
12/08/24 |
0.87 |
40.373 |
|
29.687 |
10.686 |
35.99 |
|
19.57 |
| | |
|
|
|
|
|
Aviva |
484.200 |
12/08/24 |
0.35 |
528.130 |
|
391.660 |
136.470 |
34.84 |
|
17.39 |
| | |
|
|
|
S |
|
Legal & General |
225.600 |
12/08/24 |
0.53 |
246.100 |
|
186.870 |
59.230 |
31.70 |
|
10.03 |
| | |
|
|
|
|
|
BNP Paribas |
50.084 |
12/08/24 |
|
54.759 |
|
32.917 |
21.841 |
66.35 |
|
28.52 |
| |
|
⇓instrument |
freshest |
⇓ Δday |
1/05/17 |
Δwk |
4/07/16 |
prc diff |
⇓ Δ43 |
|
⇓∅-RS |
| | |
|
|
|
|
|
Bankinter |
6.166 |
12/08/24 |
0.19 |
6.830 |
|
4.834 |
1.996 |
41.28 |
|
18.56 |
| | |
|
|
|
L |
|
Bank of China |
0.339 |
12/08/24 |
1.19 |
0.376 |
|
0.305 |
0.072 |
23.53 |
|
9.97 |
| | |
|
|
|
S |
|
Bolsa Mexicana |
1.228 |
12/08/24 |
-0.17 |
1.362 |
|
1.181 |
0.181 |
15.30 |
|
13.95 |
| | |
|
|
|
L |
|
ICBC |
0.447 |
12/08/24 |
2.05 |
0.507 |
|
0.416 |
0.091 |
21.83 |
|
9.96 |
| | |
|
|
|
L |
|
China Constr Bk HK |
0.554 |
12/08/24 |
1.46 |
0.631 |
|
0.499 |
0.132 |
26.51 |
|
12.75 |
| | |
|
|
|
|
|
ANZ Banking AU |
16.474 |
12/08/24 |
0.93 |
19.235 |
|
13.471 |
5.764 |
42.79 |
|
20.29 |
| | |
|
|
|
|
|
ANZ Banking NZ |
16.114 |
12/08/24 |
0.13 |
19.144 |
|
13.451 |
5.693 |
42.32 |
|
19.65 |
| | |
|
|
|
L |
|
Lloyds Bank |
56.800 |
12/08/24 |
-0.28 |
69.150 |
|
53.130 |
16.020 |
30.15 |
|
13.76 |
| | |
|
|
|
|
|
Samsung Life |
61.271 |
12/08/24 |
-0.33 |
74.796 |
|
64.738 |
10.058 |
15.54 |
|
4.14 |
| | |
|
|
|
S |
|
Svenska Handelsbank |
8.955 |
12/08/24 |
0.29 |
11.019 |
|
8.855 |
2.164 |
24.44 |
|
7.08 |
| | |
|
|
|
|
|
Bank Nova Scotia |
34.875 |
12/08/24 |
-3.42 |
42.957 |
|
37.321 |
5.636 |
15.10 |
|
2.92 |
| | |
|
|
|
|
|
Phoenix |
538.000 |
12/08/24 |
0.47 |
663.651 |
|
607.631 |
56.020 |
9.22 |
|
1.41 |
| | |
|
|
|
|
|
U.S. Bancorp |
32.145 |
12/08/24 |
-1.43 |
40.075 |
|
30.146 |
9.929 |
32.93 |
|
12.37 |
| | |
|
|
|
|
|
Westpac Banking |
16.474 |
12/08/24 |
0.61 |
20.607 |
|
16.438 |
4.169 |
25.36 |
|
13.40 |
| | |
|
|
|
|
|
Deutsche Bank |
11.249 |
12/08/24 |
0.14 |
14.095 |
|
9.240 |
4.855 |
52.55 |
|
26.88 |
| | |
|
|
|
L |
|
Hargreaves Lansdown |
1,102.000 |
12/08/24 |
|
1,384.170 |
|
1,202.970 |
181.200 |
15.06 |
|
8.76 |
| | |
|
|
|
|
|
Raiffeisen Bank Int |
14.040 |
12/08/24 |
1.59 |
17.692 |
|
9.283 |
8.409 |
90.59 |
|
41.33 |
| | |
|
|
|
|
|
Danske Bank |
22.559 |
12/08/24 |
0.15 |
28.646 |
|
19.414 |
9.232 |
47.55 |
|
24.34 |
| | |
|
|
|
L |
|
Ping An |
3.358 |
12/08/24 |
0.45 |
4.371 |
|
3.371 |
1.000 |
29.68 |
|
12.37 |
| | |
|
|
|
L |
|
Bank of China (HK) |
2.225 |
12/08/24 |
|
3.193 |
|
2.270 |
0.924 |
40.70 |
|
18.84 |
| | |
|
|
|
|
|
Banco Santander |
3.456 |
12/08/24 |
-0.24 |
5.063 |
|
2.929 |
2.134 |
72.86 |
|
36.60 |
| | |
|
|
|
|
|
Mapfre |
1.804 |
12/08/24 |
|
2.705 |
|
1.662 |
1.043 |
62.77 |
|
26.25 |
| | |
|
|
|
L |
|
W&W |
10.228 |
12/08/24 |
-0.49 |
15.723 |
|
13.811 |
1.912 |
13.84 |
|
3.13 |
| | |
|
|
|
|
|
ABN AMRO |
12.925 |
12/08/24 |
0.92 |
20.372 |
|
12.279 |
8.093 |
65.91 |
|
24.45 |
| | |
|
|
|
|
|
permanent tsb |
1.306 |
12/08/24 |
1.31 |
2.063 |
|
1.469 |
0.594 |
40.43 |
|
7.40 |
| |
|
⇓instrument |
freshest |
⇓ Δday |
1/05/17 |
Δwk |
4/07/16 |
prc diff |
⇓ Δ43 |
|
⇓∅-RS |
| | |
|
|
|
S |
|
Heartland |
0.568 |
12/08/24 |
0.95 |
0.906 |
|
0.658 |
0.248 |
37.64 |
|
14.58 |
| | |
|
|
|
L |
|
Schroders |
337.200 |
12/08/24 |
-0.12 |
544.207 |
|
401.628 |
142.579 |
35.50 |
|
15.19 |
| | |
|
|
|
L |
|
St. James´s Place |
691.000 |
12/08/24 |
-1.22 |
1,153.390 |
|
794.670 |
358.720 |
45.14 |
|
20.43 |
| | |
|
|
|
L |
|
Hang Seng Bank |
9.171 |
12/08/24 |
0.38 |
15.738 |
|
12.929 |
2.808 |
21.72 |
|
9.95 |
| | |
|
|
|
L |
|
Aozora Bank |
16.405 |
9/08/24 |
3.28 |
28.231 |
|
25.907 |
2.324 |
8.97 |
|
3.47 |
| | |
|
|
|
S |
|
Scor |
14.480 |
12/08/24 |
1.06 |
30.701 |
|
22.661 |
8.040 |
35.48 |
|
22.21 |
| | |
|
|
|
L |
|
Umweltbank |
4.767 |
12/08/24 |
-1.40 |
10.516 |
|
13.446 |
-2.930 |
-21.79 |
|
-13.72 |
| | |
|
|
|
L |
|
China Life Ins HK |
1.036 |
12/08/24 |
0.58 |
2.360 |
|
1.637 |
0.723 |
44.15 |
|
19.42 |
| | |
|
|
|
L |
|
Abrdn |
152.950 |
12/08/24 |
2.51 |
364.422 |
|
289.340 |
75.082 |
25.95 |
|
7.57 |
| | |
|
|
|
S |
|
Grenke |
21.513 |
12/08/24 |
-2.12 |
51.535 |
|
43.532 |
8.003 |
18.39 |
|
12.20 |
| | |
|
|
|
|
|
Societe Generale |
17.346 |
12/08/24 |
0.44 |
42.443 |
|
23.333 |
19.110 |
81.90 |
|
37.03 |
| | |
|
|
|
L |
|
Deutsche Pfandbrief |
4.179 |
12/08/24 |
0.20 |
10.397 |
|
7.361 |
3.037 |
41.25 |
|
31.07 |
| | |
|
|
|
|
|
Prudential |
635.400 |
12/08/24 |
0.41 |
1,725.940 |
|
1,268.880 |
457.060 |
36.02 |
|
19.34 |
| | |
|
|
|
L |
|
Multitude |
4.666 |
12/08/24 |
-0.72 |
16.610 |
|
15.527 |
1.083 |
6.98 |
|
9.55 |
| | |
|
|
|
L |
|
Worldline |
6.600 |
12/08/24 |
-0.79 |
25.735 |
|
21.280 |
4.455 |
20.93 |
|
15.08 |
| Finance - 197 out of 214 instruments rated - 1/05/17 / 4/07/16 - 191 did rise, Market-Ratio(43) in GBP = 96.95 % |
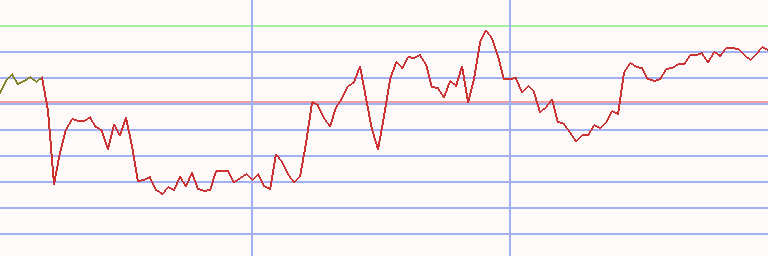
Technical Chart
Transactions Finance in Pound sterling * A43 - 90/60 (1)
|
⇐ |
| |
| L/S | date buy | date sell | days | | instrument | spl | pieces | | prc buy | prc sell | ps short | prc diff | d % | asset | yield | |
| 2/01/06 |
9/01/06 |
7 |
|
- cash - |
| long |
9/01/06 |
6/08/07 |
574 |
|
|
|
Sberbank |
100 |
2,620 |
|
3.816 |
8.060 |
|
4.244 |
111 |
21,118 |
61 |
|
| short |
6/08/07 |
16/11/09 |
833 |
|
|
|
Shinsei Bank |
100 |
125,292 |
|
0.169 |
0.072 |
0.393 |
0.225 |
133 |
49,252 |
45 |
|
| long |
16/11/09 |
24/05/10 |
189 |
|
|
|
Natixis |
100 |
13,762 |
|
3.579 |
3.038 |
|
-0.541 |
-15 |
41,813 |
-27 |
|
| short |
24/05/10 |
11/03/13 |
1022 |
|
|
|
Piraeus Financial |
100 |
0 |
|
685,659.173 |
58,943.445 |
7,975,925.086 |
7,290,265.913 |
1,063 |
41,813 |
0 |
|
| long |
11/03/13 |
24/02/14 |
350 |
|
|
|
Banco BPI |
100 |
40,806 |
|
1.025 |
1.408 |
|
0.384 |
37 |
57,466 |
39 |
|
| short |
24/02/14 |
24/04/17 |
1155 |
|
|
|
Eurobank Ergasias |
100 |
1,422 |
|
40.401 |
0.518 |
3,150.151 |
3,109.751 |
7,697 |
4,479,531 |
296 |
|
| long |
24/04/17 |
26/03/18 |
336 |
|
|
|
Caixabank |
100 |
1,286,282 |
|
3.483 |
3.329 |
|
-0.154 |
-4 |
4,281,974 |
-5 |
|
| short |
26/03/18 |
18/01/21 |
1029 |
|
|
|
Gentera |
100 |
8,430,136 |
|
0.508 |
0.342 |
0.755 |
0.247 |
49 |
6,363,067 |
15 |
|
| long |
18/01/21 |
28/02/22 |
406 |
|
|
|
Hanwha Life |
100 |
3228,033,674 |
|
0.002 |
0.002 |
|
-0.000 |
-7 |
5,926,888 |
-6 |
|
| short |
28/02/22 |
12/08/24 |
896 |
|
|
|
PayPal |
100 |
70,932 |
|
83.557 |
50.198 |
139.082 |
55.525 |
66 |
9,865,406 |
23 |
|
| accum | 9/01/06 |
12/08/24 | 7462 |
days out of 7469 invested (100%) |
98,554 |
9,865,406 |
40 |
|
Instrument Related Contribution
| instrument | L/S | date buy | date sell | days | prc buy | prc sell | ps short | prc diff | d % | | | total |
| Eurobank Ergasias | short | 24/02/14 | 24/04/17 | 1155 | 40.40 | 0.52 | 3,150.15 | 3,109.75 | 7,697.31 | | | 7,697.31 |
| Piraeus Financial | short | 24/05/10 | 11/03/13 | 1022 | 685,659.17 | 58,943.45 | 7,975,925.09 | 7,290,265.91 | 1,063.25 | | | 1,063.25 |
| Shinsei Bank | short | 6/08/07 | 16/11/09 | 833 | 0.17 | 0.07 | 0.39 | 0.22 | 133.22 | | | 133.22 |
| Sberbank | long | 9/01/06 | 6/08/07 | 574 | 3.82 | 8.06 | | 4.24 | 111.21 | | | 111.21 |
| PayPal | short | 28/02/22 | 12/08/24 | 896 | 83.56 | 50.20 | 139.08 | 55.53 | 66.45 | | | 66.45 |
| Gentera | short | 26/03/18 | 18/01/21 | 1029 | 0.51 | 0.34 | 0.75 | 0.25 | 48.60 | | | 48.60 |
| Banco BPI | long | 11/03/13 | 24/02/14 | 350 | 1.02 | 1.41 | | 0.38 | 37.44 | | | 37.44 |
| Caixabank | long | 24/04/17 | 26/03/18 | 336 | 3.48 | 3.33 | | -0.15 | -4.41 | | | -4.41 |
| Hanwha Life | long | 18/01/21 | 28/02/22 | 406 | 0.00 | 0.00 | | -0.00 | -6.85 | | | -6.85 |
| Natixis | long | 16/11/09 | 24/05/10 | 189 | 3.58 | 3.04 | | -0.54 | -15.11 | | | -15.11 |
Annotations
| 28/03/24 | MS&AD Insurance | | | stock split 1:3 (three for one) |
| | Sompo | | | stock split 1:3 (three for one) |
| 26/09/22 | Schroders | | | split 1:5 (five for one) + 3 bonus shares for 17 (is equivalent to a 17:20 split) |
| 16/05/22 | Cdn Imp Bk Comm | | | stock split 1:2 (two for one) |
| 2/09/21 | flatexDEGIRO | | | stock split 1:4 (four for one) |
| 18/09/17 | Umweltbank | | | stock split 1:5 (five for one) |
| 14/08/17 | Standard Life | | | merger with Aberdeen Asset Management completed |
| 10/07/17 | Bank of Ireland | | | reverse split 30:1 (one for thirty) |
| | Grenkeleasing | | | stock split 1:3 (three for one) |
| 23/01/17 | Unicredit | | | reverse stock split 10:1 (one for ten) |
| 24/10/16 | Banco Comercial | | | reverse stock split 75:1 (one for seventyfive) |
| 10/03/16 | W&W | | | recording started (SDAX) |
| 13/01/16 | Finanzen | | | Banca MPS, Banif, Alpha Bank, Eurobank Ergasias
Piraeus Bank and National Bank of Greece excluded |
| 31/12/15 | Heartland | | | name change from Heartland New Zealand to Heartland Bank,
ticker changes from HNZ to HBL |
| 21/12/15 | Hypoport | | | entry (SDAX) |
| 21/09/15 | Unipol | | | re-joins the MIB as replacement for Autogrill |
| 4/09/15 | Deutsche Pfandbrief | | | recording started (MDAX) |
| 25/08/15 | NN | | | recording started |
| 27/07/15 | Ping An HK | | | forward stock split 10:20 (twenty for ten) |
| | Ping An Ins | | | forward stock split 10:20 (twenty for ten) |
| 20/07/15 | PayPal | | | recording started |
| 21/06/15 | Ferratum | | | recording started |
| 19/05/15 | Svenska Handelsbank | | | ex Split 1:3 (three for one) |
| 18/05/15 | Tryg | | | forward stock split 1:5 (five for one) |
| 19/03/15 | Visa | | | forward stock split 1:4 (four for one) |
| 11/03/15 | Finance | | | neu analysis, fine performing Mixed Cut |
|
|