| | |
| | |

Assessment - Insurances in Japanese yen - 29/02/16 - RS = 13
⇐
| |
|
⇓instrument |
freshest |
⇓ Δday |
29/02/16 |
⇓ Δwk |
30/11/15 |
prc diff |
⇓ Δ13 |
|
∅-RS |
| |  |
 |
 |
|
|
 |
SOM Insurances |
38,476.136 |
12/08/24 |
0.30 |
21,278.002 |
|
26,479.637 |
-5,201.635 |
-19.64 |
|
-18.14 |
| | |
|
|
|
|
|
Medibank Private |
312.205 |
12/08/24 |
0.52 |
202.772 |
|
206.399 |
-3.627 |
-1.76 |
|
0.97 |
| | |
|
|
|
|
|
Admiral Group |
423,412.727 |
12/08/24 |
0.86 |
271,812.766 |
|
300,148.074 |
-28,335.308 |
-9.44 |
|
-4.38 |
| | |
|
|
|
L |
|
Storebrand |
1,372.858 |
12/08/24 |
0.38 |
443.848 |
|
453.028 |
-9.180 |
-2.03 |
|
-1.72 |
| | |
|
|
|
|
|
Beazley |
114,876.989 |
12/08/24 |
1.24 |
56,387.025 |
|
72,879.878 |
-16,492.853 |
-22.63 |
|
-6.54 |
| | |
|
|
|
|
|
Samsung Life |
8,158.724 |
12/08/24 |
-0.33 |
10,187.036 |
|
10,922.471 |
-735.436 |
-6.73 |
|
-6.17 |
| | |
|
|
|
L |
|
Glanbia |
2,221.391 |
12/08/24 |
0.50 |
2,252.056 |
|
2,259.107 |
-7.052 |
-0.31 |
|
-2.39 |
| | |
|
|
|
|
|
Hiscox |
186,596.639 |
12/08/24 |
1.89 |
152,698.511 |
|
188,680.375 |
-35,981.864 |
-19.07 |
|
-9.37 |
| | |
|
|
|
|
|
Samsung F&M Ins |
32,243.788 |
12/08/24 |
1.00 |
27,559.570 |
|
32,502.306 |
-4,942.736 |
-15.21 |
|
-8.96 |
| | |
|
|
|
|
|
Swiss Life |
73,637.246 |
12/08/24 |
0.62 |
27,549.046 |
|
31,048.804 |
-3,499.758 |
-11.27 |
|
-5.62 |
| | |
|
|
|
L |
|
Münchener Rück |
53,872.711 |
12/08/24 |
1.01 |
22,269.105 |
|
24,808.564 |
-2,539.459 |
-10.24 |
|
-4.82 |
| | |
|
|
|
|
|
NN |
5,478.040 |
12/08/24 |
0.74 |
3,483.572 |
|
4,204.775 |
-721.203 |
-17.15 |
|
-5.47 |
| | |
|
|
|
|
|
Travelers Companies |
23,647.110 |
12/08/24 |
-1.29 |
12,122.907 |
|
14,103.876 |
-1,980.969 |
-14.05 |
|
-4.80 |
| | |
|
|
|
S |
|
UnitedHealth |
63,736.590 |
12/08/24 |
1.17 |
13,428.555 |
|
13,874.905 |
-446.351 |
-3.22 |
|
-5.06 |
| | |
|
|
|
|
|
Swiss Re |
11,742.216 |
12/08/24 |
0.10 |
10,031.692 |
|
11,731.542 |
-1,699.851 |
-14.49 |
|
-9.32 |
| | |
|
|
|
|
|
Hannover Rück |
27,893.111 |
12/08/24 |
5.23 |
11,628.263 |
|
14,403.924 |
-2,775.661 |
-19.27 |
|
-8.00 |
| | |
|
|
|
S |
|
Scor |
2,101.183 |
12/08/24 |
1.06 |
3,956.431 |
|
4,827.753 |
-871.322 |
-18.05 |
|
-8.23 |
| | |
|
|
|
|
|
Phoenix |
84,431.448 |
12/08/24 |
0.47 |
101,780.227 |
|
129,574.535 |
-27,794.307 |
-21.45 |
|
-14.56 |
| | |
|
|
|
|
|
Berkshire Hathaway |
48,526.581 |
12/08/24 |
-0.30 |
15,127.701 |
|
16,506.841 |
-1,379.140 |
-8.35 |
|
-8.39 |
| | |
|
|
|
S |
|
Sun Life Financial |
5,494.373 |
12/08/24 |
-0.11 |
3,361.283 |
|
4,057.345 |
-696.062 |
-17.16 |
|
-12.20 |
| | |
|
|
|
S |
|
Molina Healthcare |
38,072.377 |
12/08/24 |
-0.15 |
6,995.026 |
|
7,418.169 |
-423.143 |
-5.70 |
|
-11.03 |
| | |
|
|
|
|
|
Lowe´s |
26,053.201 |
12/08/24 |
-2.02 |
7,614.024 |
|
9,429.667 |
-1,815.642 |
-19.25 |
|
-11.57 |
| | |
|
|
|
|
|
Talanx |
8,156.957 |
12/08/24 |
1.92 |
3,216.785 |
|
3,817.853 |
-601.068 |
-15.74 |
|
-12.98 |
| | |
|
|
|
|
|
Insurance Australia |
576.130 |
12/08/24 |
0.56 |
416.005 |
|
492.866 |
-76.862 |
-15.59 |
|
-14.81 |
| | |
|
|
|
|
|
Ageas |
5,198.373 |
12/08/24 |
0.33 |
4,171.087 |
|
5,385.051 |
-1,213.964 |
-22.54 |
|
-13.87 |
| |
|
⇓instrument |
freshest |
⇓ Δday |
29/02/16 |
⇓ Δwk |
30/11/15 |
prc diff |
⇓ Δ13 |
|
∅-RS |
| | |
|
|
|
|
|
Sampo |
4,966.544 |
12/08/24 |
0.40 |
5,071.419 |
|
6,102.321 |
-1,030.902 |
-16.89 |
|
-14.19 |
| | |
|
|
|
|
|
Tryg |
2,443.617 |
12/08/24 |
0.61 |
2,062.110 |
|
2,397.214 |
-335.104 |
-13.98 |
|
-15.27 |
| | |
|
|
|
|
|
Allianz |
31,388.950 |
12/08/24 |
|
16,835.222 |
|
21,804.224 |
-4,969.001 |
-22.79 |
|
-15.76 |
| | |
|
|
|
S |
|
Legal & General |
35,404.711 |
12/08/24 |
0.53 |
35,624.421 |
|
50,271.562 |
-14,647.141 |
-29.14 |
|
-24.35 |
| | |
|
|
|
|
|
Aviva |
75,988.303 |
12/08/24 |
0.35 |
68,769.258 |
|
94,710.512 |
-25,941.254 |
-27.39 |
|
-24.41 |
| | |
|
|
|
|
|
Axa |
3,968.083 |
12/08/24 |
-0.77 |
2,489.405 |
|
3,330.785 |
-841.380 |
-25.26 |
|
-19.05 |
| | |
|
|
|
|
|
FBD |
1,582.327 |
12/08/24 |
0.39 |
815.696 |
|
891.157 |
-75.462 |
-8.47 |
|
-19.67 |
| | |
|
|
|
|
|
MS&AD Insurance |
3,013.000 |
9/08/24 |
-0.50 |
1,003.670 |
|
1,143.000 |
-139.330 |
-12.19 |
|
-13.13 |
| | |
|
|
|
L |
|
China Pacific Ins |
471.336 |
12/08/24 |
0.22 |
404.568 |
|
509.020 |
-104.453 |
-20.52 |
|
-22.54 |
| | |
|
|
|
L |
|
AIA |
752.344 |
12/08/24 |
-1.33 |
575.492 |
|
735.168 |
-159.676 |
-21.72 |
|
-20.48 |
| | |
|
|
|
|
|
AIG |
8,074.045 |
12/08/24 |
-0.62 |
5,660.063 |
|
7,826.870 |
-2,166.807 |
-27.68 |
|
-20.44 |
| | |
|
|
|
|
|
Manulife Financial |
2,859.674 |
12/08/24 |
-0.35 |
1,508.994 |
|
2,024.987 |
-515.993 |
-25.48 |
|
-23.02 |
| | |
|
|
|
|
|
Prudential |
99,716.993 |
12/08/24 |
0.41 |
197,346.740 |
|
285,057.347 |
-87,710.608 |
-30.77 |
|
-27.91 |
| | |
|
|
|
|
|
Sompo |
2,958.500 |
9/08/24 |
0.02 |
1,061.330 |
|
1,249.670 |
-188.340 |
-15.07 |
|
-16.91 |
| | |
|
|
|
L |
|
Ping An Ins |
699.003 |
12/08/24 |
0.02 |
499.214 |
|
650.223 |
-151.009 |
-23.22 |
|
-25.46 |
| | |
|
|
|
L |
|
QBE Insurance |
1,302.730 |
12/08/24 |
0.87 |
850.516 |
|
1,109.394 |
-258.878 |
-23.34 |
|
-25.60 |
| | |
|
|
|
|
|
MetLife |
7,875.605 |
12/08/24 |
-0.40 |
4,460.400 |
|
6,289.317 |
-1,828.917 |
-29.08 |
|
-25.31 |
| | |
|
|
|
L |
|
Zurich Insurance |
52,467.384 |
12/08/24 |
0.85 |
23,992.510 |
|
32,412.798 |
-8,420.288 |
-25.98 |
|
-28.43 |
| | |
|
|
|
|
|
Aegon |
682.240 |
12/08/24 |
0.22 |
567.675 |
|
753.816 |
-186.141 |
-24.69 |
|
-27.88 |
| | |
|
|
|
|
|
Generali |
2,753.739 |
12/08/24 |
1.35 |
1,571.287 |
|
2,341.044 |
-769.757 |
-32.88 |
|
-28.44 |
| | |
|
|
|
L |
|
Ping An |
487.791 |
12/08/24 |
0.45 |
476.919 |
|
674.036 |
-197.117 |
-29.24 |
|
-29.65 |
| | |
|
|
|
|
|
Vienna Insurance |
3,655.298 |
12/08/24 |
1.36 |
2,626.172 |
|
3,447.187 |
-821.015 |
-23.82 |
|
-33.15 |
| | |
|
|
|
|
|
Uniqa |
942.036 |
12/08/24 |
0.26 |
685.184 |
|
1,092.747 |
-407.563 |
-37.30 |
|
-33.81 |
| | |
|
|
|
L |
|
China Life |
507.474 |
12/08/24 |
0.44 |
342.102 |
|
506.135 |
-164.033 |
-32.41 |
|
-37.65 |
| | |
|
|
|
|
|
Dai-ichi Life |
3,803.000 |
9/08/24 |
3.15 |
1,338.000 |
|
2,099.000 |
-761.000 |
-36.26 |
|
-31.46 |
| |
|
⇓instrument |
freshest |
⇓ Δday |
29/02/16 |
⇓ Δwk |
30/11/15 |
prc diff |
⇓ Δ13 |
|
∅-RS |
| | |
|
|
|
|
|
Mapfre |
261.759 |
12/08/24 |
|
220.790 |
|
338.151 |
-117.361 |
-34.71 |
|
-37.78 |
| | |
|
|
|
L |
|
China Life Ins HK |
150.469 |
12/08/24 |
0.58 |
245.273 |
|
424.746 |
-179.473 |
-42.25 |
|
-43.52 |
| | |
|
|
|
|
|
ASR |
5,378.685 |
12/08/24 |
0.46 |
|
|
|
|
|
|
-na- |
| | |
|
|
|
|
|
HDFC Life |
1,161.222 |
12/08/24 |
0.01 |
|
|
|
|
|
|
-na- |
| | |
|
|
|
|
|
Mandatum |
517.629 |
12/08/24 |
|
|
|
|
|
|
|
-na- |
| | |
|
|
|
|
|
Quálitas |
1,024.637 |
12/08/24 |
-2.49 |
121.347 |
|
146.977 |
-25.630 |
-17.44 |
|
-na- |
| | |
|
|
|
|
|
SBI Life |
2,818.539 |
12/08/24 |
-1.17 |
|
|
|
|
|
|
-na- |
| | |
|
|
|
L |
|
DFV |
760.498 |
12/08/24 |
-0.80 |
|
|
|
|
|
|
-na- |
| Insurances - 52 out of 57 instruments rated - 29/02/16 / 30/11/15 - 0 did rise, Market-Ratio(13) in JPY = 0.00 % |
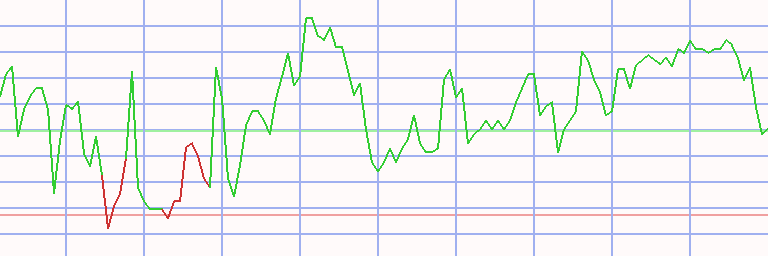
Technical Chart
Transactions Insurances in Japanese yen * A13 - 49/16 (1)
|
⇐ |
| |
| L/S | date buy | date sell | days | | instrument | spl | pieces | | prc buy | prc sell | ps short | prc diff | d % | asset | yield | |
| 2/01/06 |
7/08/06 |
217 |
|
- cash - |
| short |
7/08/06 |
21/08/06 |
14 |
|
|
|
Glanbia |
100 |
31 |
|
313.834 |
336.695 |
290.974 |
-22.861 |
-7 |
9,291 |
-86 |
|
| long |
21/08/06 |
7/01/08 |
504 |
|
|
|
China Life Ins HK |
100 |
46 |
|
198.635 |
523.182 |
|
324.547 |
163 |
24,220 |
102 |
|
| short |
7/01/08 |
21/04/08 |
105 |
|
|
|
Storebrand |
100 |
25 |
|
963.109 |
885.090 |
1,048.006 |
84.896 |
9 |
26,343 |
34 |
|
| long |
21/04/08 |
30/06/08 |
70 |
|
|
|
Glanbia |
100 |
32 |
|
815.030 |
807.880 |
|
-7.150 |
-1 |
26,114 |
-4 |
|
| short |
30/06/08 |
26/01/09 |
210 |
|
|
|
AIG |
100 |
0 |
|
56,160.071 |
2,237.305 |
1,409,710.919 |
1,353,550.848 |
2,410 |
26,114 |
0 |
|
| long |
26/01/09 |
14/06/10 |
504 |
|
|
|
Admiral Group |
100 |
23 |
|
1,121.478 |
1,834.049 |
|
712.571 |
64 |
42,503 |
43 |
|
| short |
14/06/10 |
23/08/10 |
70 |
|
|
|
UnipolSai |
100 |
32 |
|
1,314.040 |
1,151.966 |
1,498.917 |
184.877 |
14 |
48,419 |
99 |
|
| long |
23/08/10 |
20/06/11 |
301 |
|
|
|
Admiral Group |
100 |
24 |
|
1,964.340 |
2,171.037 |
|
206.697 |
11 |
53,380 |
13 |
|
| short |
20/06/11 |
7/11/11 |
140 |
|
|
|
UnipolSai |
100 |
72 |
|
740.501 |
391.424 |
1,400.890 |
660.389 |
89 |
100,928 |
427 |
|
| long |
7/11/11 |
24/08/15 |
1386 |
|
|
|
Glanbia |
100 |
204 |
|
493.460 |
2,358.074 |
|
1,864.614 |
378 |
481,309 |
51 |
|
| short |
24/08/15 |
23/11/15 |
91 |
|
|
|
FBD |
100 |
648 |
|
742.759 |
875.227 |
610.291 |
-132.468 |
-18 |
395,470 |
-55 |
|
| long |
23/11/15 |
25/01/16 |
63 |
|
|
|
NN |
100 |
93 |
|
4,248.231 |
3,988.994 |
|
-259.237 |
-6 |
371,361 |
-31 |
|
| short |
25/01/16 |
18/04/16 |
84 |
|
|
|
Delta Lloyd |
100 |
577 |
|
643.142 |
557.643 |
741.749 |
98.608 |
15 |
428,258 |
86 |
|
| long |
18/04/16 |
27/06/16 |
70 |
|
|
|
Medibank Private |
100 |
1,659 |
|
258.022 |
221.485 |
|
-36.536 |
-14 |
367,644 |
-55 |
|
| short |
27/06/16 |
8/08/16 |
42 |
|
|
|
Delta Lloyd |
100 |
1,032 |
|
356.095 |
373.877 |
338.313 |
-17.782 |
-5 |
349,292 |
-36 |
|
| long |
8/08/16 |
17/12/18 |
861 |
|
|
|
Admiral Group |
100 |
117 |
|
2,964.971 |
2,787.648 |
|
-177.323 |
-6 |
328,546 |
-3 |
|
| short |
17/12/18 |
28/01/19 |
42 |
|
|
|
AMP |
100 |
1,719 |
|
191.097 |
183.208 |
199.325 |
8.228 |
4 |
342,689 |
44 |
|
| long |
28/01/19 |
2/03/20 |
399 |
|
|
|
Molina Healthcare |
100 |
23 |
|
14,869.957 |
13,739.435 |
|
-1,130.522 |
-8 |
316,687 |
-7 |
|
| short |
2/03/20 |
8/06/20 |
98 |
|
|
|
Hanwha Life |
100 |
2,166,131 |
|
0.146 |
0.151 |
0.141 |
-0.005 |
-3 |
306,074 |
-12 |
|
| long |
8/06/20 |
9/05/22 |
700 |
|
|
|
DFV |
100 |
142 |
|
2,152.721 |
1,603.643 |
|
-549.078 |
-26 |
228,105 |
-14 |
|
| short |
9/05/22 |
6/06/22 |
28 |
|
|
|
Prudential |
100 |
160 |
|
1,417.622 |
1,758.074 |
1,077.170 |
-340.452 |
-24 |
173,633 |
-97 |
|
| long |
6/06/22 |
18/07/22 |
42 |
|
|
|
Sompo |
100 |
8,651 |
|
20.070 |
19.623 |
|
-0.447 |
-2 |
169,769 |
-18 |
|
| short |
18/07/22 |
12/09/22 |
56 |
|
|
|
Admiral Group |
100 |
59 |
|
2,874.775 |
3,781.819 |
1,967.732 |
-907.044 |
-32 |
116,253 |
-92 |
|
| long |
12/09/22 |
12/08/24 |
700 |
|
|
|
Molina Healthcare |
100 |
2 |
|
49,665.304 |
54,558.847 |
|
4,893.542 |
10 |
126,040 |
5 |
|
| accum | 7/08/06 |
12/08/24 | 7253 |
days out of 7470 invested (97%) |
1,160 |
126,040 |
14 |
|
Instrument Related Contribution
| instrument | L/S | date buy | date sell | days | prc buy | prc sell | ps short | prc diff | d % | | | total |
| AIG | short | 30/06/08 | 26/01/09 | 210 | 56,160.07 | 2,237.31 | 1,409,710.92 | 1,353,550.85 | 2,410.17 | | | 2,410.17 |
| Glanbia | short | 7/08/06 | 21/08/06 | 14 | 313.83 | 336.69 | 290.97 | -22.86 | -7.28 | | | |
| | long | 21/04/08 | 30/06/08 | 70 | 815.03 | 807.88 | | -7.15 | -0.88 | | | |
| | long | 7/11/11 | 24/08/15 | 1386 | 493.46 | 2,358.07 | | 1,864.61 | 377.87 | | | 339.17 |
| China Life Ins HK | long | 21/08/06 | 7/01/08 | 504 | 198.63 | 523.18 | | 324.55 | 163.39 | | | 163.39 |
| UnipolSai | short | 14/06/10 | 23/08/10 | 70 | 1,314.04 | 1,151.97 | 1,498.92 | 184.88 | 14.07 | | | |
| | short | 20/06/11 | 7/11/11 | 140 | 740.50 | 391.42 | 1,400.89 | 660.39 | 89.18 | | | 115.80 |
| Admiral Group | long | 26/01/09 | 14/06/10 | 504 | 1,121.48 | 1,834.05 | | 712.57 | 63.54 | | | |
| | long | 23/08/10 | 20/06/11 | 301 | 1,964.34 | 2,171.04 | | 206.70 | 10.52 | | | |
| | long | 8/08/16 | 17/12/18 | 861 | 2,964.97 | 2,787.65 | | -177.32 | -5.98 | | | |
| | short | 18/07/22 | 12/09/22 | 56 | 2,874.78 | 3,781.82 | 1,967.73 | -907.04 | -31.55 | | | 16.32 |
| Delta Lloyd | short | 25/01/16 | 18/04/16 | 84 | 643.14 | 557.64 | 741.75 | 98.61 | 15.33 | | | |
| | short | 27/06/16 | 8/08/16 | 42 | 356.10 | 373.88 | 338.31 | -17.78 | -4.99 | | | 9.57 |
| Storebrand | short | 7/01/08 | 21/04/08 | 105 | 963.11 | 885.09 | 1,048.01 | 84.90 | 8.81 | | | 8.81 |
| AMP | short | 17/12/18 | 28/01/19 | 42 | 191.10 | 183.21 | 199.32 | 8.23 | 4.31 | | | 4.31 |
| Molina Healthcare | long | 28/01/19 | 2/03/20 | 399 | 14,869.96 | 13,739.44 | | -1,130.52 | -7.60 | | | |
| | long | 12/09/22 | 12/08/24 | 700 | 49,665.30 | 54,558.85 | | 4,893.54 | 9.85 | | | 1.50 |
| Sompo | long | 6/06/22 | 18/07/22 | 42 | 20.07 | 19.62 | | -0.45 | -2.23 | | | -2.23 |
| Hanwha Life | short | 2/03/20 | 8/06/20 | 98 | 0.15 | 0.15 | 0.14 | -0.00 | -3.35 | | | -3.35 |
| NN | long | 23/11/15 | 25/01/16 | 63 | 4,248.23 | 3,988.99 | | -259.24 | -6.10 | | | -6.10 |
| Medibank Private | long | 18/04/16 | 27/06/16 | 70 | 258.02 | 221.49 | | -36.54 | -14.16 | | | -14.16 |
| FBD | short | 24/08/15 | 23/11/15 | 91 | 742.76 | 875.23 | 610.29 | -132.47 | -17.83 | | | -17.83 |
| Prudential | short | 9/05/22 | 6/06/22 | 28 | 1,417.62 | 1,758.07 | 1,077.17 | -340.45 | -24.02 | | | -24.02 |
| DFV | long | 8/06/20 | 9/05/22 | 700 | 2,152.72 | 1,603.64 | | -549.08 | -25.51 | | | -25.51 |
Annotations
| 28/03/24 | MS&AD Insurance | | | stock split 1:3 (three for one) |
| | Sompo | | | stock split 1:3 (three for one) |
| 25/08/15 | NN | | | recording started |
| 27/07/15 | Ping An HK | | | forward stock split 10:20 (twenty for ten) |
| | Ping An Ins | | | forward stock split 10:20 (twenty for ten) |
| 18/05/15 | Tryg | | | forward stock split 1:5 (five for one) |
| 12/03/15 | Insurances | | | first full analysis,
the techniques are strongly influenced by the shorts of AIG and UnipolSai. |
|
|