| | |
| | |

Assessment - Insurances in Euro - 1/07/24 - RS = 50
⇐
| |
|
instrument |
freshest |
⇓ Δday |
1/07/24 |
⇓ Δwk |
17/07/23 |
prc diff |
⇓ Δ50 |
|
⇓∅-RS |
| |  |
 |
 |
|
|
 |
SOM Insurances |
318.147 |
12/08/24 |
0.30 |
325.136 |
-2.15 |
264.656 |
60.480 |
22.85 |
|
11.10 |
| | |
|
|
|
|
|
Admiral Group |
3,179.841 |
12/08/24 |
0.86 |
3,033.696 |
4.82 |
2,392.066 |
641.630 |
26.82 |
|
3.91 |
| | |
|
|
|
|
|
Aegon |
5.562 |
12/08/24 |
0.22 |
5.856 |
-5.02 |
4.687 |
1.169 |
24.94 |
|
11.53 |
| | |
|
|
|
|
|
Ageas |
42.380 |
12/08/24 |
0.33 |
43.100 |
-1.67 |
37.090 |
6.010 |
16.20 |
|
6.75 |
| | |
|
|
|
L |
|
AIA |
6.196 |
12/08/24 |
-1.33 |
6.327 |
-2.08 |
9.172 |
-2.845 |
-31.02 |
|
-16.94 |
| | |
|
|
|
|
|
Allianz |
255.900 |
12/08/24 |
|
262.500 |
-2.51 |
210.200 |
52.300 |
24.88 |
|
7.44 |
| | |
|
|
|
|
|
AIG |
66.762 |
12/08/24 |
-0.62 |
69.447 |
-3.87 |
52.599 |
16.848 |
32.03 |
|
12.82 |
| | |
|
|
|
|
|
ASR |
43.850 |
12/08/24 |
0.46 |
44.820 |
-2.16 |
39.640 |
5.180 |
13.07 |
|
5.38 |
| | |
|
|
|
|
|
Aviva |
570.674 |
12/08/24 |
0.35 |
561.010 |
1.72 |
450.593 |
110.417 |
24.50 |
|
13.17 |
| | |
|
|
|
|
|
Axa |
32.350 |
12/08/24 |
-0.77 |
31.260 |
3.49 |
26.460 |
4.800 |
18.14 |
|
0.60 |
| | |
|
|
|
|
|
Beazley |
862.729 |
12/08/24 |
1.24 |
809.103 |
6.63 |
657.673 |
151.431 |
23.03 |
|
20.09 |
| | |
|
|
|
|
|
Berkshire Hathaway |
401.251 |
12/08/24 |
-0.30 |
377.757 |
6.22 |
306.381 |
71.376 |
23.30 |
|
9.61 |
| | |
|
|
|
L |
|
China Life |
3.775 |
12/08/24 |
0.44 |
4.013 |
-5.93 |
4.073 |
-0.060 |
-1.47 |
|
-0.48 |
| | |
|
|
|
L |
|
China Life Ins HK |
1.239 |
12/08/24 |
0.58 |
1.318 |
-5.98 |
1.424 |
-0.106 |
-7.46 |
|
4.34 |
| | |
|
|
|
L |
|
China Pacific Ins |
3.506 |
12/08/24 |
0.22 |
3.654 |
-4.03 |
3.489 |
0.165 |
4.73 |
|
9.44 |
| | |
|
|
|
|
|
Dai-ichi Life |
21.944 |
9/08/24 |
3.15 |
25.729 |
-14.71 |
17.422 |
8.307 |
47.68 |
|
29.20 |
| | |
|
|
|
|
|
FBD |
12.900 |
12/08/24 |
0.39 |
13.100 |
-1.53 |
12.750 |
0.350 |
2.75 |
|
2.21 |
| | |
|
|
|
|
|
Generali |
22.450 |
12/08/24 |
1.35 |
23.930 |
-6.18 |
18.885 |
5.045 |
26.71 |
|
12.54 |
| | |
|
|
|
L |
|
Glanbia |
18.110 |
12/08/24 |
0.50 |
18.230 |
-0.66 |
13.500 |
4.730 |
35.04 |
|
19.83 |
| | |
|
|
|
|
|
Hannover Rück |
227.400 |
12/08/24 |
5.23 |
240.900 |
-5.60 |
191.200 |
49.700 |
25.99 |
|
6.49 |
| | |
|
|
|
|
|
HDFC Life |
7.851 |
12/08/24 |
0.01 |
6.714 |
16.93 |
7.240 |
-0.525 |
-7.26 |
|
-2.63 |
| | |
|
|
|
|
|
Hiscox |
1,401.346 |
12/08/24 |
1.89 |
1,336.523 |
4.85 |
1,260.636 |
75.887 |
6.02 |
|
7.18 |
| | |
|
|
|
|
|
Insurance Australia |
4.439 |
12/08/24 |
0.56 |
4.408 |
0.70 |
3.462 |
0.947 |
27.34 |
|
21.65 |
| | |
|
|
|
S |
|
Legal & General |
265.890 |
12/08/24 |
0.53 |
269.780 |
-1.44 |
260.625 |
9.155 |
3.51 |
|
-1.25 |
| | |
|
|
|
|
|
Lowe´s |
215.426 |
12/08/24 |
-2.02 |
199.101 |
8.20 |
202.892 |
-3.791 |
-1.87 |
|
-2.14 |
| |
|
instrument |
freshest |
⇓ Δday |
1/07/24 |
⇓ Δwk |
17/07/23 |
prc diff |
⇓ Δ50 |
|
⇓∅-RS |
| | |
|
|
|
|
|
Mandatum |
4.220 |
12/08/24 |
|
4.227 |
-0.17 |
|
|
|
|
-na- |
| | |
|
|
|
|
|
Manulife Financial |
23.284 |
12/08/24 |
-0.35 |
24.716 |
-5.79 |
17.128 |
7.587 |
44.30 |
|
27.13 |
| | |
|
|
|
|
|
Mapfre |
2.134 |
12/08/24 |
|
2.172 |
-1.75 |
1.788 |
0.384 |
21.48 |
|
6.36 |
| | |
|
|
|
|
|
Medibank Private |
2.406 |
12/08/24 |
0.52 |
2.288 |
5.15 |
2.107 |
0.180 |
8.56 |
|
4.99 |
| | |
|
|
|
|
|
MetLife |
65.121 |
12/08/24 |
-0.40 |
65.149 |
-0.04 |
52.510 |
12.639 |
24.07 |
|
7.22 |
| | |
|
|
|
S |
|
Molina Healthcare |
314.809 |
12/08/24 |
-0.15 |
272.380 |
15.58 |
266.919 |
5.461 |
2.05 |
|
-14.67 |
| | |
|
|
|
|
|
MS&AD Insurance |
17.385 |
9/08/24 |
-0.50 |
21.424 |
-18.85 |
10.728 |
10.697 |
99.71 |
|
65.79 |
| | |
|
|
|
L |
|
Münchener Rück |
439.200 |
12/08/24 |
1.01 |
466.900 |
-5.93 |
335.400 |
131.500 |
39.21 |
|
18.31 |
| | |
|
|
|
|
|
NN |
44.660 |
12/08/24 |
0.74 |
43.940 |
1.64 |
33.690 |
10.250 |
30.42 |
|
14.52 |
| | |
|
|
|
|
|
Phoenix |
634.083 |
12/08/24 |
0.47 |
627.600 |
1.03 |
627.175 |
0.425 |
0.07 |
|
6.75 |
| | |
|
|
|
L |
|
Ping An |
4.017 |
12/08/24 |
0.45 |
4.226 |
-4.94 |
5.965 |
-1.739 |
-29.15 |
|
-8.05 |
| | |
|
|
|
L |
|
Ping An Ins |
5.200 |
12/08/24 |
0.02 |
5.328 |
-2.40 |
5.965 |
-0.637 |
-10.68 |
|
-4.73 |
| | |
|
|
|
|
|
Prudential |
748.877 |
12/08/24 |
0.41 |
841.750 |
-11.03 |
1,232.118 |
-390.367 |
-31.68 |
|
-15.23 |
| | |
|
|
|
L |
|
QBE Insurance |
10.038 |
12/08/24 |
0.87 |
10.577 |
-5.10 |
9.146 |
1.431 |
15.65 |
|
8.96 |
| | |
|
|
|
|
|
Quálitas |
8.349 |
12/08/24 |
-2.49 |
9.581 |
-12.86 |
7.087 |
2.494 |
35.18 |
|
11.45 |
| | |
|
|
|
|
|
Sampo |
40.490 |
12/08/24 |
0.40 |
40.180 |
0.77 |
38.420 |
1.760 |
4.58 |
|
-2.21 |
| | |
|
|
|
|
|
Samsung F&M Ins |
238.994 |
12/08/24 |
1.00 |
250.792 |
-4.70 |
169.354 |
81.438 |
48.09 |
|
31.80 |
| | |
|
|
|
|
|
Samsung Life |
60.473 |
12/08/24 |
-0.33 |
58.990 |
2.51 |
49.151 |
9.839 |
20.02 |
|
12.57 |
| | |
|
|
|
|
|
SBI Life |
19.056 |
12/08/24 |
-1.17 |
16.786 |
13.53 |
14.265 |
2.521 |
17.67 |
|
8.45 |
| | |
|
|
|
S |
|
Scor |
17.130 |
12/08/24 |
1.06 |
24.160 |
-29.10 |
27.580 |
-3.420 |
-12.40 |
|
-11.76 |
| | |
|
|
|
|
|
Sompo |
17.071 |
9/08/24 |
0.02 |
20.109 |
-15.11 |
13.665 |
6.444 |
47.16 |
|
30.58 |
| | |
|
|
|
L |
|
Storebrand |
9.258 |
12/08/24 |
0.38 |
9.538 |
-2.93 |
7.636 |
1.902 |
24.91 |
|
17.91 |
| | |
|
|
|
S |
|
Sun Life Financial |
44.736 |
12/08/24 |
-0.11 |
45.510 |
-1.70 |
45.946 |
-0.436 |
-0.95 |
|
-3.15 |
| | |
|
|
|
|
|
Swiss Life |
672.891 |
12/08/24 |
0.62 |
690.431 |
-2.54 |
546.451 |
143.979 |
26.35 |
|
12.83 |
| | |
|
|
|
|
|
Swiss Re |
107.299 |
12/08/24 |
0.10 |
115.966 |
-7.47 |
93.503 |
22.463 |
24.02 |
|
12.97 |
| |
|
instrument |
freshest |
⇓ Δday |
1/07/24 |
⇓ Δwk |
17/07/23 |
prc diff |
⇓ Δ50 |
|
⇓∅-RS |
| | |
|
|
|
|
|
Talanx |
66.500 |
12/08/24 |
1.92 |
75.050 |
-11.39 |
53.000 |
22.050 |
41.60 |
|
14.33 |
| | |
|
|
|
|
|
Travelers Companies |
195.531 |
12/08/24 |
-1.29 |
189.228 |
3.33 |
150.044 |
39.184 |
26.11 |
|
8.72 |
| | |
|
|
|
|
|
Tryg |
19.926 |
12/08/24 |
0.61 |
20.530 |
-2.94 |
17.805 |
2.725 |
15.31 |
|
8.80 |
| | |
|
|
|
|
|
Uniqa |
7.680 |
12/08/24 |
0.26 |
8.000 |
-4.00 |
7.350 |
0.650 |
8.84 |
|
-0.68 |
| | |
|
|
|
S |
|
UnitedHealth |
527.018 |
12/08/24 |
1.17 |
461.161 |
14.28 |
430.829 |
30.331 |
7.04 |
|
-1.17 |
| | |
|
|
|
|
|
Vienna Insurance |
29.800 |
12/08/24 |
1.36 |
30.600 |
-2.61 |
23.650 |
6.950 |
29.39 |
|
7.92 |
| | |
|
|
|
L |
|
Zurich Insurance |
479.443 |
12/08/24 |
0.85 |
498.117 |
-3.75 |
422.408 |
75.709 |
17.92 |
|
8.61 |
| | |
|
|
|
L |
|
DFV |
6.200 |
12/08/24 |
-0.80 |
7.250 |
-14.48 |
7.780 |
-0.530 |
-6.81 |
|
17.67 |
| Insurances - 56 out of 57 instruments rated - 1/07/24 / 17/07/23 - 45 did rise, Market-Ratio(50) in EUR = 80.36 % |
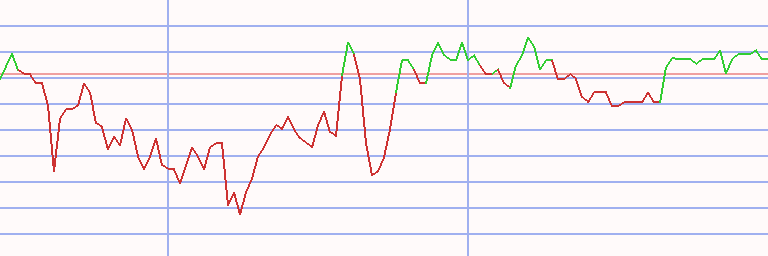
Technical Chart
Transactions Insurances in Euro * L50 - 71 ex 15 (2)
|
⇐ |
| |
| L/S | date buy | date sell | days | | instrument | spl | pieces | | prc buy | prc sell | | prc diff | d % | asset | yield | | | long |
2/01/06 |
25/09/06 |
266 |
|
|
|
Uniqa |
50 |
219 |
|
22.773 |
23.749 |
|
0.976 |
4 |
10,214 |
6 |
|
| |
|
30/10/06 |
301 |
|
|
|
Samsung F&M Ins |
50 |
44,836 |
|
0.112 |
0.117 |
|
0.005 |
5 |
10,450 |
6 |
|
| |
25/09/06 |
20/08/07 |
329 |
|
|
|
China Life Ins HK |
50 |
3,491 |
|
1.490 |
3.124 |
|
1.634 |
110 |
16,154 |
127 |
|
| |
30/10/06 |
21/05/07 |
203 |
|
|
|
Admiral Group |
50 |
379 |
|
13.826 |
14.284 |
|
0.458 |
3 |
16,328 |
6 |
|
| |
21/05/07 |
20/08/07 |
91 |
|
|
|
Ping An |
50 |
2,566 |
|
2.113 |
3.455 |
|
1.342 |
64 |
19,772 |
619 |
|
| 20/08/07 |
27/08/07 |
7 |
|
- cash - |
| |
27/08/07 |
17/09/07 |
21 |
|
|
|
China Life Ins HK |
50 |
2,856 |
|
3.461 |
3.538 |
|
0.077 |
2 |
19,990 |
46 |
|
| |
|
|
|
|
|
|
Ping An |
50 |
2,640 |
|
3.745 |
4.411 |
|
0.666 |
18 |
21,750 |
1,623 |
|
| 17/09/07 |
5/10/09 |
749 |
|
- cash - |
| |
5/10/09 |
26/10/09 |
21 |
|
|
|
Ageas |
50 |
338 |
|
32.170 |
29.930 |
|
-2.240 |
-7 |
20,993 |
-71 |
|
| |
|
|
|
|
|
|
Storebrand |
50 |
2,406 |
|
4.519 |
4.695 |
|
0.177 |
4 |
21,417 |
95 |
|
| 26/10/09 |
2/11/09 |
7 |
|
- cash - |
| |
2/11/09 |
23/11/09 |
21 |
|
|
|
Ageas |
50 |
367 |
|
29.110 |
29.100 |
|
-0.010 |
0 |
21,414 |
-1 |
|
| |
|
|
|
|
|
|
Storebrand |
50 |
2,493 |
|
4.305 |
4.758 |
|
0.452 |
11 |
22,541 |
468 |
|
| 23/11/09 |
7/12/09 |
14 |
|
- cash - |
| |
7/12/09 |
14/12/09 |
7 |
|
|
|
Swiss Re |
50 |
338 |
|
33.305 |
32.115 |
|
-1.190 |
-4 |
22,139 |
-85 |
|
| |
|
|
|
|
|
|
Ageas |
50 |
386 |
|
29.180 |
26.420 |
|
-2.760 |
-9 |
21,074 |
-99 |
|
| 14/12/09 |
28/12/09 |
14 |
|
- cash - |
| |
28/12/09 |
3/05/10 |
126 |
|
|
|
Swiss Re |
50 |
312 |
|
33.765 |
32.810 |
|
-0.955 |
-3 |
20,776 |
-8 |
|
| |
|
1/03/10 |
63 |
|
|
|
Prudential |
50 |
1,486 |
|
7.092 |
5.922 |
|
-1.170 |
-16 |
19,038 |
-65 |
|
| |
1/03/10 |
3/05/10 |
63 |
|
|
|
Storebrand |
50 |
1,557 |
|
5.650 |
4.827 |
|
-0.823 |
-15 |
17,757 |
-60 |
|
| |
3/05/10 |
31/05/10 |
28 |
|
|
|
MetLife |
50 |
258 |
|
34.411 |
32.467 |
|
-1.944 |
-6 |
17,255 |
-53 |
|
| |
|
|
|
|
|
|
AIG |
50 |
298 |
|
29.734 |
27.911 |
|
-1.822 |
-6 |
16,712 |
-56 |
|
| 31/05/10 |
14/06/10 |
14 |
|
- cash - |
| |
14/06/10 |
5/07/10 |
21 |
|
|
|
AIG |
50 |
272 |
|
30.623 |
26.828 |
|
-3.794 |
-12 |
15,680 |
-90 |
|
| |
|
|
|
|
|
|
Admiral Group |
50 |
507 |
|
16.519 |
16.927 |
|
0.408 |
2 |
15,887 |
53 |
|
| 5/07/10 |
24/01/11 |
203 |
|
- cash - |
| |
24/01/11 |
28/02/11 |
35 |
|
|
|
Legal & General |
50 |
6,125 |
|
1.297 |
1.392 |
|
0.096 |
7 |
16,472 |
110 |
|
| |
|
|
|
|
|
|
Glanbia |
50 |
1,986 |
|
4.000 |
4.220 |
|
0.220 |
5 |
16,909 |
75 |
|
| 28/02/11 |
2/05/11 |
63 |
|
- cash - |
| |
2/05/11 |
23/05/11 |
21 |
|
|
|
Molina Healthcare |
50 |
293 |
|
28.775 |
18.970 |
|
-9.805 |
-34 |
14,036 |
-100 |
|
| |
|
30/05/11 |
28 |
|
|
|
UnitedHealth |
50 |
251 |
|
33.684 |
34.188 |
|
0.503 |
1 |
14,163 |
21 |
|
| L/S | date buy | date sell | days | | instrument | spl | pieces | | prc buy | prc sell | | prc diff | d % | asset | yield | | | |
23/05/11 |
|
7 |
|
|
|
Glanbia |
50 |
1,165 |
|
4.790 |
5.000 |
|
0.210 |
4 |
14,407 |
837 |
|
| 30/05/11 |
4/07/11 |
35 |
|
- cash - |
| |
4/07/11 |
11/07/11 |
7 |
|
|
|
UnitedHealth |
50 |
197 |
|
36.383 |
35.730 |
|
-0.653 |
-2 |
14,279 |
-61 |
|
| |
|
|
|
|
|
|
Glanbia |
50 |
1,530 |
|
4.730 |
4.970 |
|
0.240 |
5 |
14,646 |
1,221 |
|
| 11/07/11 |
20/08/12 |
406 |
|
- cash - |
| |
20/08/12 |
5/11/12 |
77 |
|
|
|
AIG |
50 |
260 |
|
28.099 |
25.551 |
|
-2.548 |
-9 |
13,983 |
-36 |
|
| |
|
20/05/13 |
273 |
|
|
|
Insurance Australia |
50 |
2,145 |
|
3.421 |
4.245 |
|
0.824 |
24 |
15,750 |
33 |
|
| |
5/11/12 |
22/07/13 |
259 |
|
|
|
Glanbia |
50 |
874 |
|
7.600 |
10.190 |
|
2.590 |
34 |
18,014 |
51 |
|
| |
20/05/13 |
4/11/13 |
168 |
|
|
|
MS&AD Insurance |
50 |
120,851 |
|
0.075 |
0.061 |
|
-0.014 |
-19 |
16,320 |
-36 |
|
| |
22/07/13 |
7/10/13 |
77 |
|
|
|
Sompo |
50 |
131,297 |
|
0.068 |
0.058 |
|
-0.009 |
-14 |
15,092 |
-50 |
|
| |
7/10/13 |
11/11/13 |
35 |
|
|
|
AIG |
50 |
213 |
|
35.889 |
36.426 |
|
0.537 |
1 |
15,206 |
17 |
|
| |
4/11/13 |
24/03/14 |
140 |
|
|
|
Storebrand |
50 |
1,559 |
|
4.776 |
4.219 |
|
-0.557 |
-12 |
14,338 |
-28 |
|
| |
11/11/13 |
28/04/14 |
168 |
|
|
|
FBD |
50 |
476 |
|
16.300 |
17.000 |
|
0.700 |
4 |
14,671 |
10 |
|
| |
24/03/14 |
|
35 |
|
|
|
Swiss Life |
50 |
37 |
|
173.899 |
175.511 |
|
1.612 |
1 |
14,731 |
10 |
|
| 28/04/14 |
5/05/14 |
7 |
|
- cash - |
| |
5/05/14 |
4/08/14 |
91 |
|
|
|
Swiss Life |
50 |
41 |
|
176.794 |
169.926 |
|
-6.868 |
-4 |
14,449 |
-15 |
|
| |
|
21/07/14 |
77 |
|
|
|
Aviva |
50 |
1,158 |
|
6.456 |
6.160 |
|
-0.296 |
-5 |
14,107 |
-20 |
|
| |
21/07/14 |
13/10/14 |
84 |
|
|
|
Molina Healthcare |
50 |
212 |
|
33.521 |
33.189 |
|
-0.331 |
-1 |
14,037 |
-4 |
|
| |
4/08/14 |
22/09/14 |
49 |
|
|
|
China Pacific Ins |
50 |
2,862 |
|
2.445 |
2.380 |
|
-0.065 |
-3 |
13,850 |
-18 |
|
| |
22/09/14 |
13/10/14 |
21 |
|
|
|
UnitedHealth |
50 |
99 |
|
68.319 |
65.884 |
|
-2.435 |
-4 |
13,609 |
-47 |
|
| 13/10/14 |
24/11/14 |
42 |
|
- cash - |
| |
24/11/14 |
15/12/14 |
21 |
|
|
|
Lowe´s |
50 |
132 |
|
51.162 |
52.500 |
|
1.338 |
3 |
13,785 |
57 |
|
| |
|
|
|
|
|
|
China Life |
50 |
2,814 |
|
2.436 |
3.031 |
|
0.595 |
24 |
15,460 |
4,365 |
|
| 15/12/14 |
22/12/14 |
7 |
|
- cash - |
| |
22/12/14 |
5/01/15 |
14 |
|
|
|
China Life |
50 |
2,300 |
|
3.359 |
4.593 |
|
1.234 |
37 |
18,297 |
347,966 |
|
| |
|
|
|
|
|
|
Ping An Ins |
50 |
1,786 |
|
4.328 |
5.131 |
|
0.803 |
19 |
19,732 |
8,372 |
|
| 5/01/15 |
12/01/15 |
7 |
|
- cash - |
| |
12/01/15 |
17/08/15 |
217 |
|
|
|
China Life |
50 |
2,080 |
|
4.743 |
3.831 |
|
-0.912 |
-19 |
17,835 |
-30 |
|
| |
|
3/08/15 |
203 |
|
|
|
Ping An Ins |
50 |
1,927 |
|
5.120 |
4.904 |
|
-0.216 |
-4 |
17,419 |
-7 |
|
| |
3/08/15 |
24/08/15 |
21 |
|
|
|
Molina Healthcare |
50 |
135 |
|
69.908 |
62.601 |
|
-7.307 |
-10 |
16,433 |
-85 |
|
| L/S | date buy | date sell | days | | instrument | spl | pieces | | prc buy | prc sell | | prc diff | d % | asset | yield | | | |
17/08/15 |
|
7 |
|
|
|
MS&AD Insurance |
50 |
77,038 |
|
0.104 |
0.085 |
|
-0.019 |
-18 |
14,964 |
-100 |
|
| 24/08/15 |
5/10/15 |
42 |
|
- cash - |
| |
5/10/15 |
16/11/15 |
42 |
|
|
|
Ageas |
50 |
196 |
|
38.075 |
39.845 |
|
1.770 |
5 |
15,311 |
48 |
|
| |
|
|
|
|
|
|
Beazley |
50 |
1,556 |
|
4.819 |
5.286 |
|
0.467 |
10 |
16,038 |
124 |
|
| 16/11/15 |
30/11/15 |
14 |
|
- cash - |
| |
30/11/15 |
14/12/15 |
14 |
|
|
|
Hannover Rück |
50 |
72 |
|
110.750 |
103.600 |
|
-7.150 |
-6 |
15,523 |
-82 |
|
| |
|
|
|
|
|
|
Beazley |
50 |
1,439 |
|
5.604 |
5.262 |
|
-0.341 |
-6 |
15,032 |
-81 |
|
| 14/12/15 |
26/12/16 |
378 |
|
- cash - |
| |
26/12/16 |
11/12/17 |
350 |
|
|
|
Storebrand |
50 |
1,477 |
|
5.085 |
6.387 |
|
1.301 |
26 |
16,954 |
27 |
|
| |
|
24/04/17 |
119 |
|
|
|
Dai-ichi Life |
50 |
47,217 |
|
0.159 |
0.154 |
|
-0.006 |
-4 |
16,689 |
-10 |
|
| |
24/04/17 |
26/06/17 |
63 |
|
|
|
Mapfre |
50 |
2,198 |
|
3.300 |
3.040 |
|
-0.260 |
-8 |
16,117 |
-38 |
|
| |
26/06/17 |
23/04/18 |
301 |
|
|
|
Ping An Ins |
50 |
1,028 |
|
6.501 |
8.429 |
|
1.928 |
30 |
18,099 |
37 |
|
| |
11/12/17 |
|
133 |
|
|
|
Ping An |
50 |
1,065 |
|
8.852 |
8.571 |
|
-0.281 |
-3 |
17,800 |
-8 |
|
| 23/04/18 |
7/05/18 |
14 |
|
- cash - |
| |
7/05/18 |
28/05/18 |
21 |
|
|
|
Quálitas |
50 |
4,168 |
|
2.135 |
2.150 |
|
0.014 |
1 |
17,860 |
12 |
|
| |
|
|
|
|
|
|
Beazley |
50 |
1,264 |
|
7.037 |
6.771 |
|
-0.266 |
-4 |
17,524 |
-49 |
|
| 28/05/18 |
1/07/19 |
399 |
|
- cash - |
| |
1/07/19 |
8/07/19 |
7 |
|
|
|
Tryg |
50 |
303 |
|
28.859 |
29.647 |
|
0.788 |
3 |
17,763 |
307 |
|
| |
|
|
|
|
|
|
Ping An Ins |
50 |
738 |
|
11.887 |
11.478 |
|
-0.409 |
-3 |
17,461 |
-84 |
|
| 8/07/19 |
25/11/19 |
140 |
|
- cash - |
| |
25/11/19 |
3/02/20 |
70 |
|
|
|
Quálitas |
50 |
2,257 |
|
3.868 |
4.304 |
|
0.437 |
11 |
18,447 |
75 |
|
| |
|
|
|
|
|
|
SBI Life |
50 |
7,243 |
|
1.206 |
1.156 |
|
-0.049 |
-4 |
18,090 |
-20 |
|
| 3/02/20 |
10/02/20 |
7 |
|
- cash - |
| |
10/02/20 |
17/02/20 |
7 |
|
|
|
DFV |
50 |
484 |
|
18.680 |
19.216 |
|
0.536 |
3 |
18,350 |
337 |
|
| |
|
|
|
|
|
|
Quálitas |
50 |
2,112 |
|
4.284 |
4.801 |
|
0.516 |
12 |
19,440 |
37,570 |
|
| 17/02/20 |
22/02/21 |
371 |
|
- cash - |
| |
22/02/21 |
20/09/21 |
210 |
|
|
|
MetLife |
50 |
205 |
|
47.204 |
50.579 |
|
3.375 |
7 |
20,132 |
13 |
|
| |
|
28/06/21 |
126 |
|
|
|
Aegon |
50 |
2,409 |
|
4.052 |
3.489 |
|
-0.563 |
-14 |
18,776 |
-35 |
|
| |
28/06/21 |
11/10/21 |
105 |
|
|
|
Glanbia |
50 |
615 |
|
13.650 |
13.320 |
|
-0.330 |
-2 |
18,573 |
-8 |
|
| |
20/09/21 |
13/12/21 |
84 |
|
|
|
Dai-ichi Life |
50 |
54,660 |
|
0.190 |
0.190 |
|
0.000 |
0 |
18,576 |
0 |
|
| |
11/10/21 |
|
63 |
|
|
|
AIG |
50 |
163 |
|
50.046 |
47.659 |
|
-2.387 |
-5 |
18,187 |
-25 |
|
| 13/12/21 |
10/01/22 |
28 |
|
- cash - |
| |
10/01/22 |
14/02/22 |
35 |
|
|
|
Swiss Life |
50 |
16 |
|
565.628 |
565.391 |
|
-0.237 |
0 |
18,183 |
0 |
|
| L/S | date buy | date sell | days | | instrument | spl | pieces | | prc buy | prc sell | | prc diff | d % | asset | yield | | | |
|
|
|
|
|
|
Beazley |
50 |
1,569 |
|
5.820 |
5.800 |
|
-0.020 |
0 |
18,152 |
-3 |
|
| 14/02/22 |
13/02/23 |
364 |
|
- cash - |
| |
13/02/23 |
13/03/23 |
28 |
|
|
|
Münchener Rück |
50 |
27 |
|
327.300 |
313.400 |
|
-13.900 |
-4 |
17,777 |
-43 |
|
| |
|
|
|
|
|
|
Prudential |
50 |
635 |
|
14.647 |
13.142 |
|
-1.505 |
-10 |
16,821 |
-76 |
|
| 13/03/23 |
24/04/23 |
42 |
|
- cash - |
| |
24/04/23 |
15/05/23 |
21 |
|
|
|
Münchener Rück |
50 |
24 |
|
338.100 |
325.300 |
|
-12.800 |
-4 |
16,514 |
-49 |
|
| |
|
|
|
|
|
|
China Pacific Ins |
50 |
2,204 |
|
3.949 |
4.438 |
|
0.489 |
12 |
17,591 |
660 |
|
| 15/05/23 |
29/05/23 |
14 |
|
- cash - |
| |
29/05/23 |
7/08/23 |
70 |
|
|
|
Quálitas |
50 |
1,398 |
|
6.287 |
7.003 |
|
0.716 |
11 |
18,592 |
75 |
|
| |
|
|
|
|
|
|
Scor |
50 |
351 |
|
25.050 |
27.710 |
|
2.660 |
11 |
19,526 |
69 |
|
| 7/08/23 |
14/08/23 |
7 |
|
- cash - |
| |
14/08/23 |
21/08/23 |
7 |
|
|
|
Talanx |
50 |
163 |
|
59.600 |
60.450 |
|
0.850 |
1 |
19,664 |
109 |
|
| |
|
|
|
|
|
|
Scor |
50 |
341 |
|
28.770 |
27.980 |
|
-0.790 |
-3 |
19,395 |
-77 |
|
| 21/08/23 |
4/09/23 |
14 |
|
- cash - |
| |
4/09/23 |
23/10/23 |
49 |
|
|
|
Talanx |
50 |
156 |
|
62.150 |
57.750 |
|
-4.400 |
-7 |
18,708 |
-42 |
|
| |
|
|
|
|
|
|
Scor |
50 |
344 |
|
28.170 |
27.620 |
|
-0.550 |
-2 |
18,519 |
-14 |
|
| 23/10/23 |
26/02/24 |
126 |
|
- cash - |
| |
26/02/24 |
12/08/24 |
168 |
|
|
|
Quálitas |
50 |
879 |
|
10.524 |
8.349 |
|
-2.175 |
-21 |
16,608 |
-40 |
|
| |
|
9/08/24 |
165 |
|
|
|
MS&AD Insurance |
50 |
63,408 |
|
0.146 |
0.174 |
|
0.028 |
19 |
18,362 |
47 |
|
| accum | 2/01/06 |
9/08/24 | 3963 |
days out of 7498 invested (53%) |
84 |
18,362 |
6 |
|
Instrument Related Contribution
| instrument | L/S | date buy | date sell | days | prc buy | prc sell | | prc diff | d % | spl | di % | total |
| China Life Ins HK | long | 25/09/06 | 20/08/07 | 329 | 1.49 | 3.12 | | 1.63 | 109.70 | 50 | 54.85 | |
| | | 27/08/07 | 17/09/07 | 21 | 3.46 | 3.54 | | 0.08 | 2.21 | | 1.11 | 56.57 |
| Ping An | | 21/05/07 | 20/08/07 | 91 | 2.11 | 3.46 | | 1.34 | 63.51 | | 31.75 | |
| | | 27/08/07 | 17/09/07 | 21 | 3.74 | 4.41 | | 0.67 | 17.80 | | 8.90 | |
| | | 11/12/17 | 23/04/18 | 133 | 8.85 | 8.57 | | -0.28 | -3.17 | | -1.58 | 41.20 |
| Glanbia | | 24/01/11 | 28/02/11 | 35 | 4.00 | 4.22 | | 0.22 | 5.50 | | 2.75 | |
| | | 23/05/11 | 30/05/11 | 7 | 4.79 | 5.00 | | 0.21 | 4.38 | | 2.19 | |
| | | 4/07/11 | 11/07/11 | 7 | 4.73 | 4.97 | | 0.24 | 5.07 | | 2.54 | |
| | | 5/11/12 | 22/07/13 | 259 | 7.60 | 10.19 | | 2.59 | 34.08 | | 17.04 | |
| | | 28/06/21 | 11/10/21 | 105 | 13.65 | 13.32 | | -0.33 | -2.42 | | -1.21 | 24.49 |
| Ping An Ins | | 22/12/14 | 5/01/15 | 14 | 4.33 | 5.13 | | 0.80 | 18.56 | | 9.28 | |
| | | 12/01/15 | 3/08/15 | 203 | 5.12 | 4.90 | | -0.22 | -4.22 | | -2.11 | |
| | | 26/06/17 | 23/04/18 | 301 | 6.50 | 8.43 | | 1.93 | 29.65 | | 14.83 | |
| | | 1/07/19 | 8/07/19 | 7 | 11.89 | 11.48 | | -0.41 | -3.44 | | -1.72 | 20.73 |
| China Life | | 24/11/14 | 15/12/14 | 21 | 2.44 | 3.03 | | 0.60 | 24.43 | | 12.21 | |
| | | 22/12/14 | 5/01/15 | 14 | 3.36 | 4.59 | | 1.23 | 36.72 | | 18.36 | |
| | | 12/01/15 | 17/08/15 | 217 | 4.74 | 3.83 | | -0.91 | -19.23 | | -9.62 | 20.05 |
| Insurance Australia | | 20/08/12 | 20/05/13 | 273 | 3.42 | 4.25 | | 0.82 | 24.08 | | 12.04 | 12.04 |
| Quálitas | | 7/05/18 | 28/05/18 | 21 | 2.14 | 2.15 | | 0.01 | 0.67 | | 0.34 | |
| | | 25/11/19 | 3/02/20 | 70 | 3.87 | 4.30 | | 0.44 | 11.29 | | 5.64 | |
| | | 10/02/20 | 17/02/20 | 7 | 4.28 | 4.80 | | 0.52 | 12.05 | | 6.02 | |
| | | 29/05/23 | 7/08/23 | 70 | 6.29 | 7.00 | | 0.72 | 11.39 | | 5.69 | |
| | | 26/02/24 | 12/08/24 | 168 | 10.52 | 8.35 | | -2.17 | -20.66 | | -10.33 | 6.51 |
| Storebrand | | 5/10/09 | 26/10/09 | 21 | 4.52 | 4.70 | | 0.18 | 3.91 | | 1.95 | |
| | | 2/11/09 | 23/11/09 | 21 | 4.31 | 4.76 | | 0.45 | 10.51 | | 5.25 | |
| | | 1/03/10 | 3/05/10 | 63 | 5.65 | 4.83 | | -0.82 | -14.56 | | -7.28 | |
| | | 4/11/13 | 24/03/14 | 140 | 4.78 | 4.22 | | -0.56 | -11.67 | | -5.83 | |
| | | 26/12/16 | 11/12/17 | 350 | 5.09 | 6.39 | | 1.30 | 25.59 | | 12.79 | 5.68 |
| instrument | L/S | date buy | date sell | days | prc buy | prc sell | | prc diff | d % | spl | di % | total |
| China Pacific Ins | | 4/08/14 | 22/09/14 | 49 | 2.45 | 2.38 | | -0.07 | -2.67 | | -1.34 | |
| | | 24/04/23 | 15/05/23 | 21 | 3.95 | 4.44 | | 0.49 | 12.37 | | 6.19 | 4.77 |
| Legal & General | | 24/01/11 | 28/02/11 | 35 | 1.30 | 1.39 | | 0.10 | 7.37 | | 3.68 | 3.68 |
| Admiral Group | | 30/10/06 | 21/05/07 | 203 | 13.83 | 14.28 | | 0.46 | 3.31 | | 1.66 | |
| | | 14/06/10 | 5/07/10 | 21 | 16.52 | 16.93 | | 0.41 | 2.47 | | 1.24 | 2.91 |
| Scor | | 29/05/23 | 7/08/23 | 70 | 25.05 | 27.71 | | 2.66 | 10.62 | | 5.31 | |
| | | 14/08/23 | 21/08/23 | 7 | 28.77 | 27.98 | | -0.79 | -2.75 | | -1.37 | |
| | | 4/09/23 | 23/10/23 | 49 | 28.17 | 27.62 | | -0.55 | -1.95 | | -0.98 | 2.85 |
| Samsung F&M Ins | | 2/01/06 | 30/10/06 | 301 | 0.11 | 0.12 | | 0.01 | 4.70 | | 2.35 | 2.35 |
| FBD | | 11/11/13 | 28/04/14 | 168 | 16.30 | 17.00 | | 0.70 | 4.29 | | 2.15 | 2.15 |
| Uniqa | | 2/01/06 | 25/09/06 | 266 | 22.77 | 23.75 | | 0.98 | 4.29 | | 2.14 | 2.14 |
| DFV | | 10/02/20 | 17/02/20 | 7 | 18.68 | 19.22 | | 0.54 | 2.87 | | 1.43 | 1.43 |
| Tryg | | 1/07/19 | 8/07/19 | 7 | 28.86 | 29.65 | | 0.79 | 2.73 | | 1.36 | 1.36 |
| Lowe´s | | 24/11/14 | 15/12/14 | 21 | 51.16 | 52.50 | | 1.34 | 2.62 | | 1.31 | 1.31 |
| MetLife | | 3/05/10 | 31/05/10 | 28 | 34.41 | 32.47 | | -1.94 | -5.65 | | -2.83 | |
| | | 22/02/21 | 20/09/21 | 210 | 47.20 | 50.58 | | 3.38 | 7.15 | | 3.58 | 0.65 |
| Beazley | | 5/10/15 | 16/11/15 | 42 | 4.82 | 5.29 | | 0.47 | 9.70 | | 4.85 | |
| | | 30/11/15 | 14/12/15 | 14 | 5.60 | 5.26 | | -0.34 | -6.09 | | -3.05 | |
| | | 7/05/18 | 28/05/18 | 21 | 7.04 | 6.77 | | -0.27 | -3.78 | | -1.89 | |
| | | 10/01/22 | 14/02/22 | 35 | 5.82 | 5.80 | | -0.02 | -0.34 | | -0.17 | -0.43 |
| Swiss Life | | 24/03/14 | 28/04/14 | 35 | 173.90 | 175.51 | | 1.61 | 0.93 | | 0.46 | |
| | | 5/05/14 | 4/08/14 | 91 | 176.79 | 169.93 | | -6.87 | -3.88 | | -1.94 | |
| | | 10/01/22 | 14/02/22 | 35 | 565.63 | 565.39 | | -0.24 | -0.04 | | -0.02 | -1.51 |
| Dai-ichi Life | | 26/12/16 | 24/04/17 | 119 | 0.16 | 0.15 | | -0.01 | -3.52 | | -1.76 | |
| | | 20/09/21 | 13/12/21 | 84 | 0.19 | 0.19 | | 0.00 | 0.03 | | 0.02 | -1.75 |
| instrument | L/S | date buy | date sell | days | prc buy | prc sell | | prc diff | d % | spl | di % | total |
| UnitedHealth | | 2/05/11 | 30/05/11 | 28 | 33.68 | 34.19 | | 0.50 | 1.49 | | 0.75 | |
| | | 4/07/11 | 11/07/11 | 7 | 36.38 | 35.73 | | -0.65 | -1.80 | | -0.90 | |
| | | 22/09/14 | 13/10/14 | 21 | 68.32 | 65.88 | | -2.43 | -3.56 | | -1.78 | -1.94 |
| SBI Life | | 25/11/19 | 3/02/20 | 70 | 1.21 | 1.16 | | -0.05 | -4.08 | | -2.04 | -2.04 |
| Aviva | | 5/05/14 | 21/07/14 | 77 | 6.46 | 6.16 | | -0.30 | -4.58 | | -2.29 | -2.29 |
| Talanx | | 14/08/23 | 21/08/23 | 7 | 59.60 | 60.45 | | 0.85 | 1.43 | | 0.71 | |
| | | 4/09/23 | 23/10/23 | 49 | 62.15 | 57.75 | | -4.40 | -7.08 | | -3.54 | -2.85 |
| Swiss Re | | 7/12/09 | 14/12/09 | 7 | 33.30 | 32.11 | | -1.19 | -3.57 | | -1.79 | |
| | | 28/12/09 | 3/05/10 | 126 | 33.77 | 32.81 | | -0.96 | -2.83 | | -1.41 | -3.18 |
| Hannover Rück | | 30/11/15 | 14/12/15 | 14 | 110.75 | 103.60 | | -7.15 | -6.46 | | -3.23 | -3.23 |
| Mapfre | | 24/04/17 | 26/06/17 | 63 | 3.30 | 3.04 | | -0.26 | -7.88 | | -3.94 | -3.94 |
| Münchener Rück | | 13/02/23 | 13/03/23 | 28 | 327.30 | 313.40 | | -13.90 | -4.25 | | -2.12 | |
| | | 24/04/23 | 15/05/23 | 21 | 338.10 | 325.30 | | -12.80 | -3.79 | | -1.89 | -3.98 |
| Ageas | | 5/10/09 | 26/10/09 | 21 | 32.17 | 29.93 | | -2.24 | -6.96 | | -3.48 | |
| | | 2/11/09 | 23/11/09 | 21 | 29.11 | 29.10 | | -0.01 | -0.03 | | -0.02 | |
| | | 7/12/09 | 14/12/09 | 7 | 29.18 | 26.42 | | -2.76 | -9.46 | | -4.73 | |
| | | 5/10/15 | 16/11/15 | 42 | 38.08 | 39.85 | | 1.77 | 4.65 | | 2.32 | -5.92 |
| Sompo | | 22/07/13 | 7/10/13 | 77 | 0.07 | 0.06 | | -0.01 | -13.78 | | -6.89 | -6.89 |
| Aegon | | 22/02/21 | 28/06/21 | 126 | 4.05 | 3.49 | | -0.56 | -13.89 | | -6.95 | -6.95 |
| MS&AD Insurance | | 20/05/13 | 4/11/13 | 168 | 0.08 | 0.06 | | -0.01 | -18.61 | | -9.30 | |
| | | 17/08/15 | 24/08/15 | 7 | 0.10 | 0.08 | | -0.02 | -18.40 | | -9.20 | |
| | | 26/02/24 | 9/08/24 | 165 | 0.15 | 0.17 | | 0.03 | 18.93 | | 9.47 | -9.85 |
| Prudential | | 28/12/09 | 1/03/10 | 63 | 7.09 | 5.92 | | -1.17 | -16.49 | | -8.25 | |
| | | 13/02/23 | 13/03/23 | 28 | 14.65 | 13.14 | | -1.51 | -10.28 | | -5.14 | -12.96 |
| AIG | | 3/05/10 | 31/05/10 | 28 | 29.73 | 27.91 | | -1.82 | -6.13 | | -3.06 | |
| | | 14/06/10 | 5/07/10 | 21 | 30.62 | 26.83 | | -3.79 | -12.39 | | -6.19 | |
| | | 20/08/12 | 5/11/12 | 77 | 28.10 | 25.55 | | -2.55 | -9.07 | | -4.53 | |
| | | 7/10/13 | 11/11/13 | 35 | 35.89 | 36.43 | | 0.54 | 1.50 | | 0.75 | |
| | | 11/10/21 | 13/12/21 | 63 | 50.05 | 47.66 | | -2.39 | -4.77 | | -2.38 | -14.63 |
| instrument | L/S | date buy | date sell | days | prc buy | prc sell | | prc diff | d % | spl | di % | total |
| Molina Healthcare | | 2/05/11 | 23/05/11 | 21 | 28.77 | 18.97 | | -9.81 | -34.08 | | -17.04 | |
| | | 21/07/14 | 13/10/14 | 84 | 33.52 | 33.19 | | -0.33 | -0.99 | | -0.49 | |
| | | 3/08/15 | 24/08/15 | 21 | 69.91 | 62.60 | | -7.31 | -10.45 | | -5.23 | -21.76 |
Annotations
| 28/03/24 | MS&AD Insurance | | | stock split 1:3 (three for one) |
| | Sompo | | | stock split 1:3 (three for one) |
| 25/08/15 | NN | | | recording started |
| 27/07/15 | Ping An HK | | | forward stock split 10:20 (twenty for ten) |
| | Ping An Ins | | | forward stock split 10:20 (twenty for ten) |
| 18/05/15 | Tryg | | | forward stock split 1:5 (five for one) |
| 12/03/15 | Insurances | | | first full analysis,
the techniques are strongly influenced by the shorts of AIG and UnipolSai. |
|
|