| | |
| | |

Assessment - NZX 50 Index in Euro - 19/03/18 - RS = 51
⇐
| |
|
⇓instrument |
freshest |
⇓ Δday |
19/03/18 |
Δwk |
27/03/17 |
prc diff |
⇓ Δ51 |
|
⇓∅-RS |
| |  |
 |
 |
|
|
 |
NZX 50 |
7,211.932 |
12/08/24 |
0.31 |
4,986.858 |
|
4,579.039 |
407.818 |
8.91 |
|
3.59 |
| | |
|
|
|
|
|
Infratil |
6.207 |
12/08/24 |
-0.75 |
1.788 |
|
1.887 |
-0.099 |
-5.22 |
|
-6.28 |
| | |
|
|
|
L |
|
Mainfreight |
42.633 |
12/08/24 |
-0.55 |
14.593 |
|
14.341 |
0.251 |
1.75 |
|
-1.03 |
| | |
|
|
|
L |
|
Fisher & Paykel HC |
19.255 |
12/08/24 |
0.89 |
7.634 |
|
6.159 |
1.475 |
23.94 |
|
4.70 |
| | |
|
|
|
S |
|
Skellerup |
2.643 |
12/08/24 |
3.21 |
1.075 |
|
0.966 |
0.109 |
11.24 |
|
2.83 |
| | |
|
|
|
L |
|
Meridian Energy (NS) |
3.700 |
12/08/24 |
1.29 |
1.753 |
|
1.822 |
-0.069 |
-3.78 |
|
-0.80 |
| | |
|
|
|
|
|
Chorus |
4.639 |
12/08/24 |
0.13 |
2.296 |
|
2.691 |
-0.395 |
-14.66 |
|
-10.68 |
| | |
|
|
|
|
|
Mercury |
3.782 |
12/08/24 |
-2.13 |
1.888 |
|
2.049 |
-0.161 |
-7.85 |
|
-7.63 |
| | |
|
|
|
S |
|
Ebos |
21.205 |
12/08/24 |
0.11 |
10.834 |
|
11.774 |
-0.939 |
-7.98 |
|
-0.86 |
| | |
|
|
|
S |
|
Serko |
2.143 |
12/08/24 |
0.27 |
1.233 |
|
0.182 |
1.052 |
579.31 |
|
203.84 |
| | |
|
|
|
L |
|
Contact Energy |
4.921 |
12/08/24 |
0.84 |
3.095 |
|
3.170 |
-0.076 |
-2.39 |
|
-5.84 |
| | |
|
|
|
S |
|
Summerset |
6.401 |
12/08/24 |
-0.73 |
4.058 |
|
3.229 |
0.829 |
25.68 |
|
28.20 |
| | |
|
|
|
|
|
Gentrack |
5.931 |
12/08/24 |
2.02 |
3.867 |
|
2.326 |
1.541 |
66.26 |
|
21.70 |
| | |
|
|
|
S |
|
Goodman Property |
1.192 |
12/08/24 |
-1.46 |
0.790 |
|
0.791 |
-0.001 |
-0.14 |
|
-0.36 |
| | |
|
|
|
|
|
Turners Automotive |
2.531 |
12/08/24 |
1.17 |
1.732 |
|
2.315 |
-0.582 |
-25.16 |
|
-15.63 |
| | |
|
|
|
S |
|
Property for Indust. |
1.286 |
12/08/24 |
0.69 |
0.969 |
|
1.050 |
-0.081 |
-7.75 |
|
-3.71 |
| | |
|
|
|
S |
|
Arvida |
0.957 |
12/08/24 |
0.62 |
0.722 |
|
0.843 |
-0.121 |
-14.30 |
|
-7.09 |
| | |
|
|
|
S |
|
Spark New Zealand |
2.537 |
12/08/24 |
|
1.985 |
|
2.208 |
-0.223 |
-10.09 |
|
-11.67 |
| | |
|
|
|
S |
|
Hallenstein Glasson |
3.377 |
12/08/24 |
0.70 |
2.701 |
|
2.172 |
0.529 |
24.37 |
|
27.92 |
| | |
|
|
|
S |
|
Auckland Int Airport |
4.363 |
12/08/24 |
0.68 |
3.611 |
|
4.422 |
-0.810 |
-18.32 |
|
-11.33 |
| | |
|
|
|
S |
|
Freightways |
5.256 |
12/08/24 |
1.24 |
4.463 |
|
4.649 |
-0.186 |
-3.99 |
|
-4.81 |
| | |
|
|
|
|
|
New Zealand Exchange |
0.740 |
12/08/24 |
0.80 |
0.634 |
|
0.687 |
-0.053 |
-7.72 |
|
-8.23 |
| | |
|
|
|
|
|
Vector |
2.155 |
12/08/24 |
|
1.979 |
|
2.094 |
-0.115 |
-5.50 |
|
-3.23 |
| | |
|
|
|
S |
|
Argosy Property |
0.637 |
12/08/24 |
0.93 |
0.590 |
|
0.648 |
-0.058 |
-8.97 |
|
-7.22 |
| | |
|
|
|
|
|
Port of Tauranga |
3.183 |
12/08/24 |
-0.91 |
2.977 |
|
2.723 |
0.254 |
9.34 |
|
6.18 |
| |
|
⇓instrument |
freshest |
⇓ Δday |
19/03/18 |
Δwk |
27/03/17 |
prc diff |
⇓ Δ51 |
|
⇓∅-RS |
| | |
|
|
|
L |
|
Vista |
1.773 |
12/08/24 |
5.23 |
1.721 |
|
1.890 |
-0.169 |
-8.96 |
|
-1.51 |
| | |
|
|
|
|
|
ANZ Banking NZ |
17.646 |
12/08/24 |
0.13 |
17.541 |
|
22.070 |
-4.529 |
-20.52 |
|
-10.22 |
| | |
|
|
|
S |
|
Vulcan Steel |
4.122 |
12/08/24 |
0.14 |
|
|
|
|
|
|
-na- |
| | |
|
|
|
S |
|
Precinct Properties |
0.734 |
12/08/24 |
0.81 |
0.746 |
|
0.778 |
-0.032 |
-4.14 |
|
-4.19 |
| | |
|
|
|
|
|
Westpac Banking |
17.922 |
12/08/24 |
0.07 |
18.539 |
|
23.859 |
-5.320 |
-22.30 |
|
-12.45 |
| | |
|
|
|
S |
|
Genesis Energy |
1.310 |
12/08/24 |
-1.11 |
1.403 |
|
1.387 |
0.016 |
1.16 |
|
-3.45 |
| | |
|
|
|
S |
|
Vital Healthcare |
1.110 |
12/08/24 |
-1.05 |
1.233 |
|
1.332 |
-0.099 |
-7.44 |
|
-8.47 |
| | |
|
|
|
S |
|
Investore Property |
0.681 |
12/08/24 |
|
0.822 |
|
0.856 |
-0.034 |
-3.94 |
|
-2.59 |
| | |
|
|
|
L |
|
Manawa Energy |
2.443 |
12/08/24 |
2.46 |
3.101 |
|
2.918 |
0.183 |
6.27 |
|
-6.70 |
| | |
|
|
|
S |
|
Oceania Healthcare |
0.452 |
12/08/24 |
|
0.581 |
|
|
|
|
|
-na- |
| | |
|
|
|
|
|
Stride Property |
0.763 |
12/08/24 |
|
0.992 |
|
1.102 |
-0.110 |
-9.96 |
|
-5.29 |
| | |
|
|
|
L |
|
Scales |
1.967 |
12/08/24 |
|
2.660 |
|
2.217 |
0.443 |
19.97 |
|
14.63 |
| | |
|
|
|
L |
|
Fonterra Shs Fund |
2.461 |
12/08/24 |
2.20 |
3.447 |
|
3.929 |
-0.482 |
-12.26 |
|
-8.87 |
| | |
|
|
|
|
|
Kiwi Property |
0.529 |
12/08/24 |
|
0.799 |
|
0.914 |
-0.116 |
-12.64 |
|
-5.37 |
| | |
|
|
|
|
|
Channel Infra |
0.893 |
12/08/24 |
0.66 |
1.362 |
|
1.537 |
-0.174 |
-11.34 |
|
-10.42 |
| | |
|
|
|
S |
|
Heartland |
0.622 |
12/08/24 |
0.95 |
1.069 |
|
1.050 |
0.018 |
1.76 |
|
-6.12 |
| | |
|
|
|
S |
|
Warehouse |
0.699 |
12/08/24 |
-0.83 |
1.216 |
|
1.556 |
-0.340 |
-21.88 |
|
-6.00 |
| | |
|
|
|
L |
|
a2 Milk |
4.375 |
12/08/24 |
0.95 |
8.104 |
|
1.913 |
6.191 |
323.71 |
|
150.83 |
| | |
|
|
|
L |
|
Sanford |
2.408 |
12/08/24 |
-0.49 |
4.463 |
|
4.759 |
-0.296 |
-6.22 |
|
-4.02 |
| | |
|
|
|
S |
|
Fletcher Building |
1.832 |
12/08/24 |
0.65 |
3.770 |
|
5.135 |
-1.365 |
-26.58 |
|
-20.04 |
| | |
|
|
|
S |
|
Ryman Healthcare |
2.737 |
12/08/24 |
0.65 |
6.336 |
|
5.381 |
0.955 |
17.75 |
|
10.45 |
| | |
|
|
|
S |
|
Skycity Entertainm. |
0.910 |
12/08/24 |
-0.64 |
2.325 |
|
2.561 |
-0.235 |
-9.20 |
|
-6.53 |
| | |
|
|
|
S |
|
Tourism |
1.221 |
12/08/24 |
1.96 |
3.570 |
|
2.431 |
1.139 |
46.85 |
|
26.98 |
| | |
|
|
|
S |
|
KMD Brands |
0.241 |
12/08/24 |
2.50 |
1.409 |
|
1.251 |
0.158 |
12.63 |
|
3.83 |
| | |
|
|
|
S |
|
Air New Zealand |
0.326 |
12/08/24 |
0.91 |
1.979 |
|
1.488 |
0.491 |
33.00 |
|
5.00 |
| |
|
⇓instrument |
freshest |
⇓ Δday |
19/03/18 |
Δwk |
27/03/17 |
prc diff |
⇓ Δ51 |
|
⇓∅-RS |
| | |
|
|
|
S |
|
Sky Network Telev. |
1.556 |
12/08/24 |
-1.85 |
13.624 |
|
24.507 |
-10.883 |
-44.41 |
|
-25.43 |
| NZX 50 - 48 out of 50 instruments rated - 19/03/18 / 27/03/17 - 17 did rise, Market-Ratio(51) in EUR = 35.42 % |
| Stock Exchange Currency: NZD $ New Zealand dollar |
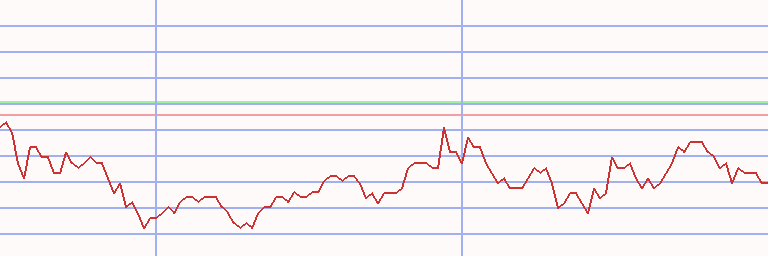
Technical Chart
Transactions NZX 50 Index in Euro * A51 - 60/55 (1)
|
⇐ |
| |
| L/S | date buy | date sell | days | | instrument | spl | pieces | | prc buy | prc sell | ps short | prc diff | d % | asset | yield | |
| 2/01/06 |
23/01/06 |
21 |
|
- cash - |
| short |
23/01/06 |
20/03/06 |
56 |
|
|
|
a2 Milk |
100 |
223,224 |
|
0.045 |
0.031 |
0.064 |
0.020 |
44 |
14,353 |
954 |
|
| long |
20/03/06 |
10/12/07 |
630 |
|
|
|
Mainfreight |
100 |
6,159 |
|
2.330 |
3.757 |
|
1.427 |
61 |
23,139 |
32 |
|
| short |
10/12/07 |
5/10/09 |
665 |
|
|
|
Comvita |
100 |
15,596 |
|
1.484 |
0.570 |
3.864 |
2.381 |
160 |
60,267 |
69 |
|
| long |
5/10/09 |
12/10/09 |
7 |
|
|
|
Restaurant Brands |
100 |
100,601 |
|
0.599 |
0.668 |
|
0.069 |
12 |
67,208 |
29,313 |
|
| short |
12/10/09 |
19/10/09 |
7 |
|
|
|
Channel Infra |
100 |
26,694 |
|
2.518 |
2.525 |
2.511 |
-0.007 |
0 |
67,024 |
-13 |
|
| long |
19/10/09 |
30/11/09 |
42 |
|
|
|
Restaurant Brands |
100 |
92,373 |
|
0.726 |
0.693 |
|
-0.033 |
-5 |
63,999 |
-33 |
|
| short |
30/11/09 |
7/12/09 |
7 |
|
|
|
Channel Infra |
100 |
29,970 |
|
2.135 |
2.002 |
2.278 |
0.143 |
7 |
68,281 |
2,828 |
|
| long |
7/12/09 |
19/07/10 |
224 |
|
|
|
Restaurant Brands |
100 |
88,483 |
|
0.772 |
1.248 |
|
0.476 |
62 |
110,391 |
119 |
|
| short |
19/07/10 |
1/11/10 |
105 |
|
|
|
New Zealand Exchange |
100 |
313,839 |
|
0.352 |
0.368 |
0.335 |
-0.016 |
-5 |
105,262 |
-15 |
|
| long |
1/11/10 |
8/11/10 |
7 |
|
|
|
Restaurant Brands |
100 |
68,431 |
|
1.538 |
1.548 |
|
0.010 |
1 |
105,930 |
39 |
|
| short |
8/11/10 |
31/01/11 |
84 |
|
|
|
Fisher & Paykel HC |
100 |
63,978 |
|
1.656 |
1.807 |
1.504 |
-0.151 |
-9 |
96,243 |
-34 |
|
| long |
31/01/11 |
28/02/11 |
28 |
|
|
|
Xero |
100 |
62,725 |
|
1.534 |
1.432 |
|
-0.103 |
-7 |
89,804 |
-59 |
|
| short |
28/02/11 |
25/04/11 |
56 |
|
|
|
Heartland |
100 |
210,693 |
|
0.426 |
0.391 |
0.465 |
0.038 |
9 |
97,909 |
76 |
|
| long |
25/04/11 |
3/10/11 |
161 |
|
|
|
a2 Milk |
100 |
1,270,164 |
|
0.077 |
0.119 |
|
0.042 |
55 |
151,769 |
170 |
|
| short |
3/10/11 |
17/10/11 |
14 |
|
|
|
Heartland |
100 |
544,356 |
|
0.279 |
0.296 |
0.262 |
-0.017 |
-6 |
142,512 |
-81 |
|
| long |
17/10/11 |
31/10/11 |
14 |
|
|
|
a2 Milk |
100 |
1,023,655 |
|
0.139 |
0.139 |
|
0.000 |
0 |
142,579 |
1 |
|
| short |
31/10/11 |
5/03/12 |
126 |
|
|
|
Heartland |
100 |
472,456 |
|
0.302 |
0.277 |
0.329 |
0.028 |
9 |
155,627 |
29 |
|
| long |
5/03/12 |
21/05/12 |
77 |
|
|
|
a2 Milk |
100 |
669,322 |
|
0.233 |
0.267 |
|
0.034 |
15 |
178,423 |
91 |
|
| short |
21/05/12 |
30/07/12 |
70 |
|
|
|
KMD Brands |
100 |
187,077 |
|
0.954 |
0.992 |
0.916 |
-0.038 |
-4 |
171,307 |
-19 |
|
| long |
30/07/12 |
20/01/14 |
539 |
|
|
|
Xero |
100 |
48,753 |
|
3.514 |
25.929 |
|
22.415 |
638 |
1,264,124 |
287 |
|
| short |
20/01/14 |
2/06/14 |
133 |
|
|
|
Chorus |
100 |
1,349,472 |
|
0.937 |
1.063 |
0.811 |
-0.126 |
-13 |
1,093,748 |
-33 |
|
| long |
2/06/14 |
21/07/14 |
49 |
|
|
|
Tourism |
100 |
1,570,895 |
|
0.696 |
0.758 |
|
0.062 |
9 |
1,190,531 |
88 |
|
| short |
21/07/14 |
28/07/14 |
7 |
|
|
|
a2 Milk |
100 |
3,038,781 |
|
0.392 |
0.401 |
0.383 |
-0.009 |
-2 |
1,163,549 |
-70 |
|
| long |
28/07/14 |
22/02/16 |
574 |
|
|
|
Tourism |
100 |
1,563,631 |
|
0.744 |
1.542 |
|
0.798 |
107 |
2,410,697 |
59 |
|
| short |
22/02/16 |
29/02/16 |
7 |
|
|
|
ANZ Banking NZ |
100 |
157,604 |
|
15.296 |
14.670 |
15.949 |
0.653 |
4 |
2,513,565 |
784 |
|
| L/S | date buy | date sell | days | | instrument | spl | pieces | | prc buy | prc sell | ps short | prc diff | d % | asset | yield | | | long |
29/02/16 |
22/05/17 |
448 |
|
|
|
a2 Milk |
100 |
2,357,894 |
|
1.066 |
2.174 |
|
1.107 |
104 |
5,124,900 |
79 |
|
| short |
22/05/17 |
12/06/17 |
21 |
|
|
|
Comvita |
100 |
1,464,244 |
|
3.500 |
3.344 |
3.663 |
0.163 |
5 |
5,363,672 |
121 |
|
| long |
12/06/17 |
17/07/17 |
35 |
|
|
|
a2 Milk |
100 |
2,424,411 |
|
2.212 |
2.573 |
|
0.360 |
16 |
6,237,472 |
383 |
|
| short |
17/07/17 |
2/10/17 |
77 |
|
|
|
Comvita |
100 |
1,617,612 |
|
3.856 |
4.599 |
3.113 |
-0.743 |
-19 |
5,035,626 |
-64 |
|
| long |
2/10/17 |
5/03/18 |
154 |
|
|
|
a2 Milk |
100 |
1,231,199 |
|
4.090 |
7.510 |
|
3.420 |
84 |
9,246,074 |
322 |
|
| short |
5/03/18 |
12/03/18 |
7 |
|
|
|
Metro Perf Glass |
100 |
19,016,835 |
|
0.486 |
0.473 |
0.500 |
0.013 |
3 |
9,502,713 |
317 |
|
| long |
12/03/18 |
16/04/18 |
35 |
|
|
|
a2 Milk |
100 |
1,156,881 |
|
8.214 |
7.413 |
|
-0.801 |
-10 |
8,575,761 |
-66 |
|
| short |
16/04/18 |
21/05/18 |
35 |
|
|
|
Tegel |
100 |
17,593,068 |
|
0.487 |
0.666 |
0.309 |
-0.178 |
-37 |
5,438,018 |
-99 |
|
| long |
21/05/18 |
16/07/18 |
56 |
|
|
|
a2 Milk |
100 |
836,006 |
|
6.505 |
6.530 |
|
0.025 |
0 |
5,458,817 |
3 |
|
| short |
16/07/18 |
20/08/18 |
35 |
|
|
|
Comvita |
100 |
1,580,990 |
|
3.453 |
3.298 |
3.615 |
0.162 |
5 |
5,715,439 |
61 |
|
| |