| | Mon, Jun 22nd, 2026, 8:36UTC |
| | |

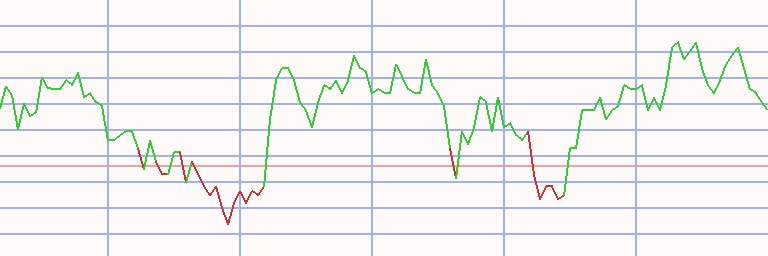
Assessment - Toronto Stock Exchange 60 in Pound sterling - 7/01/24 - RS = 22
⇐
| |
|
instrument |
freshest |
⇓ Δday |
7/01/24 |
⇓ Δwk |
1/29/24 |
prc diff |
⇓ Δ22 |
|
⇓∅-RS |
| |  |
 |
 |
|
|
 |
TSX 60 |
772.544 |
8/12/24 |
0.21 |
751.090 |
2.86 |
749.743 |
1.346 |
0.18 |
|
2.50 |
| | |
|
|
|
|
|
Agnico-Eagle Mines |
60.701 |
8/12/24 |
3.52 |
51.508 |
17.85 |
39.253 |
12.255 |
31.22 |
|
22.98 |
| | |
|
|
|
|
|
Algonquin |
4.070 |
8/12/24 |
-4.72 |
4.628 |
-12.06 |
4.767 |
-0.139 |
-2.91 |
|
-8.73 |
| | |
|
|
|
S |
|
Bank Montreal |
64.385 |
8/12/24 |
-0.10 |
66.100 |
-2.60 |
75.663 |
-9.562 |
-12.64 |
|
-6.64 |
| | |
|
|
|
|
|
Bank Nova Scotia |
35.396 |
8/12/24 |
-3.42 |
36.023 |
-1.74 |
36.779 |
-0.756 |
-2.05 |
|
-3.28 |
| | |
|
|
|
|
|
Barrick Gold |
15.053 |
8/12/24 |
9.37 |
13.136 |
14.59 |
12.348 |
0.788 |
6.39 |
|
1.20 |
| | |
|
|
|
L |
|
BCE |
27.538 |
8/12/24 |
-0.40 |
25.506 |
7.97 |
32.335 |
-6.828 |
-21.12 |
|
-15.63 |
| | |
|
|
|
|
|
Brookfield Asset |
30.969 |
8/12/24 |
-1.08 |
29.979 |
3.30 |
32.270 |
-2.291 |
-7.10 |
|
3.91 |
| | |
|
|
|
|
|
Brookfield Corp |
34.930 |
8/12/24 |
-1.65 |
32.754 |
6.64 |
32.270 |
0.483 |
1.50 |
|
11.99 |
| | |
|
|
|
|
|
Brookfield Infra |
23.739 |
8/12/24 |
-0.27 |
21.632 |
9.74 |
25.006 |
-3.374 |
-13.49 |
|
-8.33 |
| | |
|
|
|
|
|
CAE |
13.021 |
8/12/24 |
-0.92 |
14.627 |
-10.98 |
15.959 |
-1.332 |
-8.35 |
|
-11.90 |
| | |
|
|
|
|
|
Cameco |
30.929 |
8/12/24 |
-1.09 |
38.746 |
-20.18 |
37.031 |
1.715 |
4.63 |
|
17.69 |
| | |
|
|
|
S |
|
Cdn Apartment Props |
28.246 |
8/12/24 |
-0.30 |
25.587 |
10.39 |
27.849 |
-2.262 |
-8.12 |
|
-7.27 |
| | |
|
|
|
|
|
Cdn Imp Bk Comm |
40.116 |
8/12/24 |
-0.36 |
37.445 |
7.13 |
36.351 |
1.094 |
3.01 |
|
7.72 |
| | |
|
|
|
|
|
Cdn Nat Railway |
87.612 |
8/12/24 |
-0.01 |
93.057 |
-5.85 |
97.608 |
-4.551 |
-4.66 |
|
-2.47 |
| | |
|
|
|
|
|
Cdn Nat Resources |
28.264 |
8/12/24 |
2.68 |
28.051 |
0.76 |
25.111 |
2.939 |
11.70 |
|
7.21 |
| | |
|
|
|
|
|
Cdn Pac Kansas City |
61.098 |
8/12/24 |
-0.66 |
62.019 |
-1.49 |
62.277 |
-0.258 |
-0.41 |
|
-1.38 |
| | |
|
|
|
L |
|
Cdn Tire |
85.919 |
8/12/24 |
-0.17 |
78.137 |
9.96 |
86.726 |
-8.589 |
-9.90 |
|
-8.58 |
| | |
|
|
|
L |
|
CCL Industries |
42.246 |
8/12/24 |
-0.72 |
41.411 |
2.02 |
34.457 |
6.954 |
20.18 |
|
13.12 |
| | |
|
|
|
|
|
Cenovus Energy |
15.030 |
8/12/24 |
3.28 |
15.479 |
-2.90 |
12.664 |
2.815 |
22.23 |
|
5.86 |
| | |
|
|
|
S |
|
CGI Group |
83.830 |
8/12/24 |
-0.70 |
78.603 |
6.65 |
86.908 |
-8.305 |
-9.56 |
|
-5.36 |
| | |
|
|
|
|
|
Constellation Soft |
2,279.253 |
8/12/24 |
-2.83 |
2,269.087 |
0.45 |
2,204.513 |
64.574 |
2.93 |
|
20.38 |
| | |
|
|
|
|
|
Couche-Tard |
46.396 |
8/12/24 |
0.89 |
44.192 |
4.99 |
46.916 |
-2.725 |
-5.81 |
|
0.32 |
| | |
|
|
|
L |
|
Dollarama |
74.211 |
8/12/24 |
1.46 |
71.903 |
3.21 |
58.378 |
13.524 |
23.17 |
|
23.36 |
| | |
|
|
|
|
|
Emera |
28.097 |
8/12/24 |
-0.69 |
26.278 |
6.92 |
28.729 |
-2.451 |
-8.53 |
|
-8.67 |
| |
|
instrument |
freshest |
⇓ Δday |
7/01/24 |
⇓ Δwk |
1/29/24 |
prc diff |
⇓ Δ22 |
|
⇓∅-RS |
| | |
|
|
|
|
|
Enbridge |
30.900 |
8/12/24 |
0.60 |
28.016 |
10.29 |
28.242 |
-0.226 |
-0.80 |
|
0.29 |
| | |
|
|
|
L |
|
First Quantum |
9.187 |
8/12/24 |
2.77 |
10.344 |
-11.19 |
7.452 |
2.892 |
38.81 |
|
1.10 |
| | |
|
|
|
|
|
FirstService |
132.983 |
8/12/24 |
-0.57 |
119.847 |
10.96 |
134.082 |
-14.235 |
-10.62 |
|
-2.56 |
| | |
|
|
|
|
|
Fortis (CA) |
33.824 |
8/12/24 |
-0.39 |
30.607 |
10.51 |
31.578 |
-0.972 |
-3.08 |
|
-4.14 |
| | |
|
|
|
|
|
Franco-Nevada |
98.048 |
8/12/24 |
2.47 |
93.368 |
5.01 |
86.140 |
7.228 |
8.39 |
|
-4.33 |
| | |
|
|
|
L |
|
George Weston |
120.014 |
8/12/24 |
0.64 |
113.279 |
5.95 |
101.712 |
11.567 |
11.37 |
|
16.01 |
| | |
|
|
|
L |
|
Gildan Activewear |
32.811 |
8/12/24 |
-0.42 |
29.870 |
9.85 |
26.366 |
3.504 |
13.29 |
|
15.14 |
| | |
|
|
|
|
|
Hydro One |
25.190 |
8/12/24 |
-0.09 |
22.939 |
9.81 |
23.611 |
-0.671 |
-2.84 |
|
2.20 |
| | |
|
|
|
|
|
Imperial Oil |
59.452 |
8/12/24 |
3.95 |
53.695 |
10.72 |
44.958 |
8.737 |
19.43 |
|
13.85 |
| | |
|
|
|
|
|
Intact Financial |
142.884 |
8/12/24 |
0.94 |
131.251 |
8.86 |
122.977 |
8.273 |
6.73 |
|
6.80 |
| | |
|
|
|
L |
|
Kinross Gold |
7.052 |
8/12/24 |
5.15 |
6.556 |
7.55 |
4.380 |
2.177 |
49.70 |
|
48.47 |
| | |
|
|
|
|
|
Loblaw |
95.423 |
8/12/24 |
0.48 |
91.353 |
4.45 |
78.934 |
12.419 |
15.73 |
|
19.54 |
| | |
|
|
|
S |
|
Magna |
30.094 |
8/12/24 |
-1.88 |
33.007 |
-8.82 |
44.489 |
-11.482 |
-25.81 |
|
-22.33 |
| | |
|
|
|
|
|
Manulife Financial |
19.756 |
8/12/24 |
-0.35 |
20.970 |
-5.79 |
17.196 |
3.774 |
21.95 |
|
25.49 |
| | |
|
|
|
L |
|
Metro (CA) |
45.711 |
8/12/24 |
-0.43 |
43.627 |
4.78 |
41.751 |
1.877 |
4.49 |
|
4.13 |
| | |
|
|
|
|
|
National Bank CA |
65.864 |
8/12/24 |
0.39 |
62.462 |
5.45 |
60.600 |
1.862 |
3.07 |
|
5.58 |
| | |
|
|
|
|
|
Nutrien |
36.541 |
8/12/24 |
0.51 |
40.093 |
-8.86 |
40.244 |
-0.151 |
-0.38 |
|
-10.58 |
| | |
|
|
|
S |
|
Open Text |
23.555 |
8/12/24 |
-1.49 |
23.647 |
-0.39 |
34.721 |
-11.074 |
-31.89 |
|
-19.87 |
| | |
|
|
|
|
|
Pembina Pipeline |
30.048 |
8/12/24 |
-1.69 |
29.219 |
2.84 |
27.328 |
1.892 |
6.92 |
|
11.03 |
| | |
|
|
|
|
|
Power Canada |
21.558 |
8/12/24 |
2.02 |
21.886 |
-1.50 |
23.136 |
-1.250 |
-5.40 |
|
-0.19 |
| | |
|
|
|
S |
|
Restaurant Brands |
55.238 |
8/12/24 |
-0.84 |
55.491 |
-0.46 |
61.908 |
-6.417 |
-10.36 |
|
-3.82 |
| | |
|
|
|
|
|
Rogers Comm |
31.182 |
8/12/24 |
-0.79 |
29.127 |
7.06 |
37.506 |
-8.379 |
-22.34 |
|
-12.58 |
| | |
|
|
|
L |
|
Royal Bank CA |
85.632 |
8/12/24 |
-0.72 |
83.841 |
2.14 |
77.809 |
6.033 |
7.75 |
|
11.02 |
| | |
|
|
|
L |
|
Saputo |
16.924 |
8/12/24 |
-4.05 |
17.684 |
-4.30 |
16.716 |
0.968 |
5.79 |
|
9.26 |
| | |
|
|
|
|
|
Shopify |
54.052 |
8/12/24 |
-1.29 |
52.043 |
3.86 |
65.684 |
-13.641 |
-20.77 |
|
-1.18 |
| |
|
instrument |
freshest |
⇓ Δday |
7/01/24 |
⇓ Δwk |
1/29/24 |
prc diff |
⇓ Δ22 |
|
⇓∅-RS |
| | |
|
|
|
S |
|
Sun Life Financial |
37.957 |
8/12/24 |
-0.11 |
38.614 |
-1.70 |
40.666 |
-2.052 |
-5.05 |
|
-4.35 |
| | |
|
|
|
|
|
Suncor Energy |
32.074 |
8/12/24 |
2.28 |
30.019 |
6.85 |
25.768 |
4.251 |
16.50 |
|
12.16 |
| | |
|
|
|
L |
|
TC Energy |
34.423 |
8/12/24 |
0.57 |
29.852 |
15.31 |
31.127 |
-1.274 |
-4.09 |
|
-0.25 |
| | |
|
|
|
|
|
Teck Resources |
36.737 |
8/12/24 |
2.36 |
37.739 |
-2.65 |
31.877 |
5.861 |
18.39 |
|
13.75 |
| | |
|
|
|
S |
|
Telus |
12.975 |
8/12/24 |
0.09 |
11.921 |
8.84 |
14.353 |
-2.431 |
-16.94 |
|
-12.65 |
| | |
|
|
|
L |
|
Thomson Reuters (CA) |
127.106 |
8/12/24 |
-0.41 |
132.747 |
-4.25 |
117.589 |
15.158 |
12.89 |
|
16.96 |
| | |
|
|
|
S |
|
Toronto-Dominion |
45.193 |
8/12/24 |
0.19 |
43.288 |
4.40 |
48.540 |
-5.252 |
-10.82 |
|
-9.12 |
| | |
|
|
|
|
|
Tourmaline Oil |
34.958 |
8/12/24 |
4.20 |
35.718 |
-2.13 |
34.346 |
1.372 |
4.00 |
|
-5.79 |
| | |
|
|
|
|
|
Waste Connections |
142.384 |
8/12/24 |
-0.11 |
138.170 |
3.05 |
122.579 |
15.591 |
12.72 |
|
16.56 |
| | |
|
|
|
L |
|
Wheaton Precious |
45.251 |
8/12/24 |
2.56 |
41.290 |
9.59 |
37.529 |
3.761 |
10.02 |
|
12.55 |
| | |
|
|
|
|
|
WSP Global |
122.259 |
8/12/24 |
0.19 |
122.628 |
-0.30 |
116.100 |
6.528 |
5.62 |
|
6.99 |
| TSX 60 - 60 out of 60 instruments rated - 7/01/24 / 1/29/24 - 31 did rise, Market-Ratio(22) in GBP = 51.67 % |
| Stock Exchange Currency: CAD $ Canadian dollar |
Technical Chart
Transactions Toronto Stock Exchange 60 in Pound sterling * S22 - 35 ex 1 (1)
|
⇐ |
| |
| L/S | date buy | date sell | days | | instrument | spl | pieces | | prc buy | prc sell | ps short | prc diff | d % | asset | yield | |
| 1/02/06 |
6/19/06 |
168 |
|
- cash - |
| short |
6/19/06 |
6/26/06 |
7 |
|
|
|
CGI Group |
100 |
2,969 |
|
3.368 |
3.553 |
3.183 |
-0.185 |
-5 |
9,451 |
-95 |
|
| |
6/26/06 |
7/03/06 |
7 |
|
|
|
Loblaw |
100 |
403 |
|
23.430 |
23.623 |
23.238 |
-0.192 |
-1 |
9,373 |
-35 |
|
| 7/03/06 |
11/19/07 |
504 |
|
- cash - |
| |
11/19/07 |
11/26/07 |
7 |
|
|
|
Loblaw |
100 |
589 |
|
15.908 |
15.531 |
16.294 |
0.386 |
2 |
9,600 |
249 |
|
| 11/26/07 |
12/17/07 |
21 |
|
- cash - |
| |
12/17/07 |
12/24/07 |
7 |
|
|
|
Metro (CA) |
100 |
2,255 |
|
4.256 |
4.574 |
3.937 |
-0.319 |
-7 |
8,881 |
-98 |
|
| 12/24/07 |
1/14/08 |
21 |
|
- cash - |
| |
1/14/08 |
1/21/08 |
7 |
|
|
|
Teck Resources |
100 |
588 |
|
15.096 |
16.089 |
14.103 |
-0.993 |
-7 |
8,298 |
-97 |
|
| |
1/21/08 |
1/28/08 |
7 |
|
|
|
Cdn Apartment Props |
100 |
1,215 |
|
6.825 |
7.503 |
6.147 |
-0.678 |
-10 |
7,474 |
-100 |
|
| |
1/28/08 |
2/04/08 |
7 |
|
|
|
Cameco |
100 |
457 |
|
16.322 |
16.416 |
16.228 |
-0.094 |
-1 |
7,431 |
-26 |
|
| |
2/04/08 |
2/25/08 |
21 |
|
|
|
Metro (CA) |
100 |
1,863 |
|
3.988 |
3.886 |
4.092 |
0.104 |
3 |
7,624 |
56 |
|
| |
2/25/08 |
3/03/08 |
7 |
|
|
|
Loblaw |
100 |
549 |
|
13.868 |
13.233 |
14.533 |
0.665 |
5 |
7,990 |
1,051 |
|
| |
3/03/08 |
3/10/08 |
7 |
|
|
|
Metro (CA) |
100 |
2,220 |
|
3.598 |
3.734 |
3.463 |
-0.136 |
-4 |
7,688 |
-87 |
|
| |
3/10/08 |
3/17/08 |
7 |
|
|
|
Bank Montreal |
100 |
426 |
|
18.019 |
19.937 |
16.101 |
-1.918 |
-11 |
6,871 |
-100 |
|
| |
3/17/08 |
3/24/08 |
7 |
|
|
|
CCL Industries |
100 |
2,438 |
|
2.817 |
2.968 |
2.667 |
-0.150 |
-5 |
6,505 |
-94 |
|
| |
3/24/08 |
3/31/08 |
7 |
|
|
|
Metro (CA) |
100 |
1,717 |
|
3.788 |
3.971 |
3.604 |
-0.183 |
-5 |
6,190 |
-92 |
|
| |
3/31/08 |
4/07/08 |
7 |
|
|
|
Brookfield Corp |
100 |
1,312 |
|
4.716 |
5.031 |
4.402 |
-0.315 |
-7 |
5,777 |
-97 |
|
| 4/07/08 |
9/22/08 |
168 |
|
- cash - |
| |
9/22/08 |
10/27/08 |
35 |
|
|
|
First Quantum |
100 |
1,322 |
|
4.368 |
2.496 |
7.644 |
3.276 |
75 |
10,108 |
34,145 |
|
| |
10/27/08 |
11/03/08 |
7 |
|
|
|
Wheaton Precious |
100 |
4,888 |
|
2.068 |
2.162 |
1.973 |
-0.094 |
-5 |
9,646 |
-91 |
|
| |
11/03/08 |
3/16/09 |
133 |
|
|
|
Teck Resources |
100 |
1,665 |
|
5.792 |
3.302 |
10.162 |
4.369 |
75 |
16,921 |
368 |
|
| 3/16/09 |
3/23/09 |
7 |
|
- cash - |
| |
3/23/09 |
3/30/09 |
7 |
|
|
|
Gildan Activewear |
100 |
5,789 |
|
2.923 |
3.272 |
2.574 |
-0.349 |
-12 |
14,902 |
-100 |
|
| 3/30/09 |
8/01/11 |
854 |
|
- cash - |
| |
8/01/11 |
8/08/11 |
7 |
|
|
|
Cameco |
100 |
983 |
|
15.156 |
13.925 |
16.495 |
1.339 |
9 |
16,219 |
8,176 |
|
| 8/08/11 |
8/22/11 |
14 |
|
- cash - |
| |
8/22/11 |
9/05/11 |
14 |
|
|
|
Cameco |
100 |
1,281 |
|
12.655 |
13.317 |
11.993 |
-0.662 |
-5 |
15,371 |
-75 |
|
| 9/05/11 |
9/12/11 |
7 |
|
- cash - |
| |
9/12/11 |
9/19/11 |
7 |
|
|
|
Cameco |
100 |
1,151 |
|
13.353 |
12.307 |
14.489 |
1.136 |
9 |
16,678 |
6,951 |
|
| |
9/19/11 |
9/26/11 |
7 |
|
|
|
First Quantum |
100 |
1,878 |
|
8.880 |
8.776 |
8.986 |
0.106 |
1 |
16,876 |
86 |
|
| 9/26/11 |
10/03/11 |
7 |
|
- cash - |
| |
10/03/11 |
10/10/11 |
7 |
|
|
|
Cameco |
100 |
1,385 |
|
12.180 |
13.283 |
11.078 |
-1.102 |
-9 |
15,350 |
-99 |
|
| 10/10/11 |
10/17/11 |
7 |
|
- cash - |
| |
10/17/11 |
11/07/11 |
21 |
|
|
|
Agnico-Eagle Mines |
100 |
553 |
|
27.725 |
29.124 |
26.325 |
-1.399 |
-5 |
14,576 |
-59 |
|
| 11/07/11 |
7/27/15 |
1358 |
|
- cash - |
| |
7/27/15 |
8/10/15 |
14 |
|
|
|
Teck Resources |
100 |
3,351 |
|
4.349 |
4.981 |
3.717 |
-0.632 |
-15 |
12,459 |
-98 |
|
| L/S | date buy | date sell | days | | instrument | spl | pieces | | prc buy | prc sell | ps short | prc diff | d % | asset | yield | |
| 8/10/15 |
8/24/15 |
14 |
|
- cash - |
| |
8/24/15 |
10/12/15 |
49 |
|
|
|
First Quantum |
100 |
4,018 |
|
3.100 |
4.327 |
1.873 |
-1.227 |
-40 |
7,528 |
-98 |
|
| 10/12/15 |
1/04/16 |
84 |
|
- cash - |
| |
1/04/16 |
1/11/16 |
7 |
|
|
|
Teck Resources |
100 |
3,061 |
|
2.459 |
2.023 |
2.990 |
0.531 |
22 |
9,153 |
> 999,999 |
|
| |
1/11/16 |
1/25/16 |
14 |
|
|
|
First Quantum |
100 |
4,925 |
|
1.858 |
1.268 |
2.722 |
0.864 |
46 |
13,408 |
> 999,999 |
|
| 1/25/16 |
3/26/18 |
791 |
|
- cash - |
| |
3/26/18 |
4/23/18 |
28 |
|
|
|
Enbridge |
100 |
636 |
|
21.052 |
22.248 |
19.855 |
-1.197 |
-6 |
12,647 |
-53 |
|
| 4/23/18 |
10/15/18 |
175 |
|
- cash - |
| |
10/15/18 |
10/22/18 |
7 |
|
|
|
Dollarama |
100 |
552 |
|
22.893 |
23.393 |
22.393 |
-0.500 |
-2 |
12,370 |
-68 |
|
| 10/22/18 |
10/29/18 |
7 |
|
- cash - |
| |
10/29/18 |
11/05/18 |
7 |
|
|
|
First Quantum |
100 |
1,872 |
|
6.607 |
7.647 |
5.567 |
-1.040 |
-16 |
10,424 |
-100 |
|
| 11/05/18 |
11/19/18 |
14 |
|
- cash - |
| |
11/19/18 |
11/26/18 |
7 |
|
|
|
First Quantum |
100 |
1,427 |
|
7.301 |
6.979 |
7.639 |
0.338 |
5 |
10,905 |
955 |
|
| 11/26/18 |
12/10/18 |
14 |
|
- cash - |
| |
12/10/18 |
12/17/18 |
7 |
|
|
|
Dollarama |
100 |
575 |
|
18.939 |
18.769 |
19.112 |
0.173 |
1 |
11,004 |
60 |
|
| |
12/17/18 |
1/21/19 |
35 |
|
|
|
First Quantum |
100 |
1,695 |
|
6.489 |
7.434 |
5.544 |
-0.945 |
-15 |
9,402 |
-81 |
|
| 1/21/19 |
3/09/20 |
413 |
|
- cash - |
| |
3/09/20 |
5/04/20 |
56 |
|
|
|
Cenovus Energy |
100 |
4,393 |
|
2.140 |
2.711 |
1.569 |
-0.571 |
-27 |
6,892 |
-87 |
|
| |
5/04/20 |
7/20/20 |
77 |
|
|
|
Gildan Activewear |
100 |
635 |
|
10.840 |
13.192 |
8.487 |
-2.353 |
-22 |
5,398 |
-69 |
|
| |
7/20/20 |
8/03/20 |
14 |
|
|
|
CAE |
100 |
455 |
|
11.843 |
10.973 |
12.783 |
0.940 |
8 |
5,826 |
632 |
|
| |
8/03/20 |
8/10/20 |
7 |
|
|
|
Suncor Energy |
100 |
484 |
|
12.035 |
12.947 |
11.123 |
-0.912 |
-8 |
5,384 |
-98 |
|
| 8/10/20 |
7/11/22 |
700 |
|
- cash - |
| |
7/11/22 |
7/25/22 |
14 |
|
|
|
Shopify |
100 |
197 |
|
27.207 |
30.406 |
24.008 |
-3.199 |
-12 |
4,754 |
-96 |
|
| 7/25/22 |
8/08/22 |
14 |
|
- cash - |
| |
8/08/22 |
8/15/22 |
7 |
|
|
|
Shopify |
100 |
144 |
|
32.903 |
33.010 |
32.796 |
-0.107 |
0 |
4,739 |
-16 |
|
| 8/15/22 |
8/22/22 |
7 |
|
- cash - |
| |
8/22/22 |
11/14/22 |
84 |
|
|
|
Shopify |
100 |
168 |
|
28.162 |
32.691 |
23.634 |
-4.528 |
-16 |
3,978 |
-53 |
|
| 11/14/22 |
6/26/23 |
224 |
|
- cash - |
| |
6/26/23 |
7/03/23 |
7 |
|
|
|
Nutrien |
100 |
84 |
|
46.902 |
46.484 |
47.325 |
0.422 |
1 |
4,014 |
60 |
|
| 7/03/23 |
9/25/23 |
84 |
|
- cash - |
| |
9/25/23 |
10/16/23 |
21 |
|
|
|
Algonquin |
100 |
712 |
|
5.630 |
4.716 |
6.720 |
1.090 |
19 |
4,790 |
2,069 |
|
| |
10/16/23 |
10/23/23 |
7 |
|
|
|
Brookfield Infra |
100 |
232 |
|
20.564 |
18.831 |
22.457 |
1.893 |
9 |
5,229 |
9,759 |
|
| |
10/23/23 |
10/30/23 |
7 |
|
|
|
Algonquin |
100 |
1,258 |
|
4.156 |
4.230 |
4.082 |
-0.074 |
-2 |
5,135 |
-61 |
|
| |
10/30/23 |
11/06/23 |
7 |
|
|
|
First Quantum |
100 |
431 |
|
11.900 |
10.045 |
14.097 |
2.197 |
18 |
6,082 |
687,355 |
|
| 11/06/23 |
6/22/26 |
959 |
|
- cash - |
| accum | 6/19/06 |
11/06/23 | 840 |
days out of 7476 invested (11%) |
-39 |
6,082 |
-19 |
|
Instrument Related Contribution
| instrument | L/S | date buy | date sell | days | prc buy | prc sell | ps short | prc diff | d % | | | total |
| Teck Resources | short | 1/14/08 | 1/21/08 | 7 | 15.10 | 16.09 | 14.10 | -0.99 | -6.58 | | | |
| | | 11/03/08 | 3/16/09 | 133 | 5.79 | 3.30 | 10.16 | 4.37 | 75.43 | | | |
| | | 7/27/15 | 8/10/15 | 14 | 4.35 | 4.98 | 3.72 | -0.63 | -14.53 | | | |
| | | 1/04/16 | 1/11/16 | 7 | 2.46 | 2.02 | 2.99 | 0.53 | 21.58 | | | 70.30 |
| First Quantum | | 9/22/08 | 10/27/08 | 35 | 4.37 | 2.50 | 7.64 | 3.28 | 75.00 | | | |
| | | 9/19/11 | 9/26/11 | 7 | 8.88 | 8.78 | 8.99 | 0.11 | 1.19 | | | |
| | | 8/24/15 | 10/12/15 | 49 | 3.10 | 4.33 | 1.87 | -1.23 | -39.58 | | | |
| | | 1/11/16 | 1/25/16 | 14 | 1.86 | 1.27 | 2.72 | 0.86 | 46.49 | | | |
| | | 10/29/18 | 11/05/18 | 7 | 6.61 | 7.65 | 5.57 | -1.04 | -15.74 | | | |
| | | 11/19/18 | 11/26/18 | 7 | 7.30 | 6.98 | 7.64 | 0.34 | 4.62 | | | |
| | | 12/17/18 | 1/21/19 | 35 | 6.49 | 7.43 | 5.54 | -0.95 | -14.57 | | | |
| | | 10/30/23 | 11/06/23 | 7 | 11.90 | 10.05 | 14.10 | 2.20 | 18.47 | | | 39.85 |
| Algonquin | | 9/25/23 | 10/16/23 | 21 | 5.63 | 4.72 | 6.72 | 1.09 | 19.37 | | | |
| | | 10/23/23 | 10/30/23 | 7 | 4.16 | 4.23 | 4.08 | -0.07 | -1.79 | | | 17.23 |
| Brookfield Infra | | 10/16/23 | 10/23/23 | 7 | 20.56 | 18.83 | 22.46 | 1.89 | 9.20 | | | 9.20 |
| CAE | | 7/20/20 | 8/03/20 | 14 | 11.84 | 10.97 | 12.78 | 0.94 | 7.93 | | | 7.93 |
| Loblaw | | 6/26/06 | 7/03/06 | 7 | 23.43 | 23.62 | 23.24 | -0.19 | -0.82 | | | |
| | | 11/19/07 | 11/26/07 | 7 | 15.91 | 15.53 | 16.29 | 0.39 | 2.43 | | | |
| | | 2/25/08 | 3/03/08 | 7 | 13.87 | 13.23 | 14.53 | 0.67 | 4.80 | | | 6.46 |
| Cameco | | 1/28/08 | 2/04/08 | 7 | 16.32 | 16.42 | 16.23 | -0.09 | -0.58 | | | |
| | | 8/01/11 | 8/08/11 | 7 | 15.16 | 13.93 | 16.50 | 1.34 | 8.84 | | | |
| | | 8/22/11 | 9/05/11 | 14 | 12.65 | 13.32 | 11.99 | -0.66 | -5.23 | | | |
| | | 9/12/11 | 9/19/11 | 7 | 13.35 | 12.31 | 14.49 | 1.14 | 8.50 | | | |
| | | 10/03/11 | 10/10/11 | 7 | 12.18 | 13.28 | 11.08 | -1.10 | -9.05 | | | 1.20 |
| Nutrien | | 6/26/23 | 7/03/23 | 7 | 46.90 | 46.48 | 47.32 | 0.42 | 0.90 | | | 0.90 |
| instrument | L/S | date buy | date sell | days | prc buy | prc sell | ps short | prc diff | d % | | | total |
| Dollarama | | 10/15/18 | 10/22/18 | 7 | 22.89 | 23.39 | 22.39 | -0.50 | -2.19 | | | |
| | | 12/10/18 | 12/17/18 | 7 | 18.94 | 18.77 | 19.11 | 0.17 | 0.91 | | | -1.29 |
| Wheaton Precious | | 10/27/08 | 11/03/08 | 7 | 2.07 | 2.16 | 1.97 | -0.09 | -4.56 | | | -4.56 |
| Agnico-Eagle Mines | | 10/17/11 | 11/07/11 | 21 | 27.72 | 29.12 | 26.33 | -1.40 | -5.05 | | | -5.05 |
| CCL Industries | | 3/17/08 | 3/24/08 | 7 | 2.82 | 2.97 | 2.67 | -0.15 | -5.34 | | | -5.34 |
| CGI Group | | 6/19/06 | 6/26/06 | 7 | 3.37 | 3.55 | 3.18 | -0.19 | -5.50 | | | -5.50 |
| Enbridge | | 3/26/18 | 4/23/18 | 28 | 21.05 | 22.25 | 19.85 | -1.20 | -5.68 | | | -5.68 |
| Brookfield Corp | | 3/31/08 | 4/07/08 | 7 | 4.72 | 5.03 | 4.40 | -0.31 | -6.68 | | | -6.68 |
| Suncor Energy | | 8/03/20 | 8/10/20 | 7 | 12.04 | 12.95 | 11.12 | -0.91 | -7.58 | | | -7.58 |
| Cdn Apartment Props | | 1/21/08 | 1/28/08 | 7 | 6.82 | 7.50 | 6.15 | -0.68 | -9.94 | | | -9.94 |
| Bank Montreal | | 3/10/08 | 3/17/08 | 7 | 18.02 | 19.94 | 16.10 | -1.92 | -10.64 | | | -10.64 |
| Metro (CA) | | 12/17/07 | 12/24/07 | 7 | 4.26 | 4.57 | 3.94 | -0.32 | -7.49 | | | |
| | | 2/04/08 | 2/25/08 | 21 | 3.99 | 3.89 | 4.09 | 0.10 | 2.61 | | | |
| | | 3/03/08 | 3/10/08 | 7 | 3.60 | 3.73 | 3.46 | -0.14 | -3.77 | | | |
| | | 3/24/08 | 3/31/08 | 7 | 3.79 | 3.97 | 3.60 | -0.18 | -4.84 | | | -13.08 |
| Shopify | | 7/11/22 | 7/25/22 | 14 | 27.21 | 30.41 | 24.01 | -3.20 | -11.76 | | | |
| | | 8/08/22 | 8/15/22 | 7 | 32.90 | 33.01 | 32.80 | -0.11 | -0.33 | | | |
| | | 8/22/22 | 11/14/22 | 84 | 28.16 | 32.69 | 23.63 | -4.53 | -16.08 | | | -26.19 |
| Cenovus Energy | | 3/09/20 | 5/04/20 | 56 | 2.14 | 2.71 | 1.57 | -0.57 | -26.70 | | | -26.70 |
| Gildan Activewear | | 3/23/09 | 3/30/09 | 7 | 2.92 | 3.27 | 2.57 | -0.35 | -11.93 | | | |
| | | 5/04/20 | 7/20/20 | 77 | 10.84 | 13.19 | 8.49 | -2.35 | -21.70 | | | -31.05 |
Annotations
| 6/11/24 | Cdn Nat Resources | | | stock split 1:2 (two for one) |
| 5/16/22 | Cdn Imp Bk Comm | | | stock split 1:2 (two for one) |
| 5/15/21 | Cdn Pac Railway | | | stock split 1:5 (cinque per una) |
| 9/30/19 | Couche-Tard | | | stock split 1:2 (two for one) |
| 4/18/19 | TSX 60 | | | Canopy Growth replaces Goldcorp (mergered with Newmont) |
| 1/02/18 | Nutrien | | | merger of Agrium with Potash |
| 5/22/17 | Silver Wheaton | | | is now called Wheaton Precious Metals |
| 6/09/16 | TSX 60 | | | complete analysis |
| 6/08/16 | TSX 60 | | | index adaption: Dollarama replaces TransAlta |
| 2/23/16 | TSX 60 | | | Emera replaces Canadian Oil Sands (acquisition by Suncor) |
| 8/17/15 | TSX 60 | | | complete analysis |
| 8/15/15 | TSX 60 | | | component correction: ARC Energy Trust (AET-UN) replaced by ARC Resources (ARX) |
| 8/03/15 | TSX 60 | | | Constellation Software replaces Catamaran (acquired by UnitedHealth) |
| 5/12/15 | Brookfield Ass Mgmt | | | forward stock split 2:3 (three for two - as a stock dividend a half bonus share for one) |
| 5/11/15 | TSX 60 | | | Franco-Nevada replaces Talisman Energy. |
| | Franco-Nevada | | | registered |
| | TSX 60 | | | Talisman Energy drops out due to the acquisition by Repsol. |
| 3/30/15 | Gildan Activewear | | | forward stock split 1:2 (two for one) |
| 2/12/15 | Metro (CA) | | | forward stock split 1:3 (three for one) |
|
|