| | Mon, Jun 22nd, 2026, 8:42UTC |
| | |

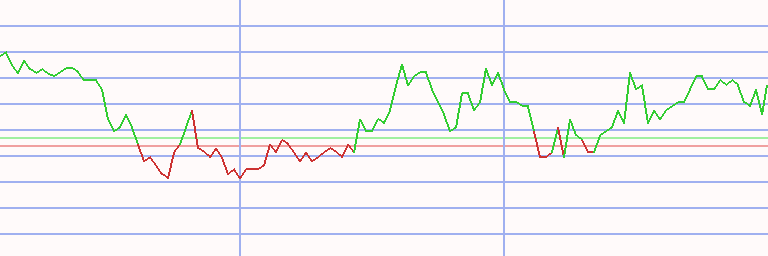
Assessment - Toronto Stock Exchange 60 in Pound sterling - 7/01/24 - RS = 44
⇐
| |
|
instrument |
freshest |
⇓ Δday |
7/01/24 |
⇓ Δwk |
8/28/23 |
prc diff |
⇓ Δ44 |
|
⇓∅-RS |
| |  |
 |
 |
|
|
 |
TSX 60 |
772.544 |
8/12/24 |
0.21 |
751.090 |
2.86 |
700.043 |
51.047 |
7.29 |
|
2.50 |
| | |
|
|
|
|
|
Agnico-Eagle Mines |
60.701 |
8/12/24 |
3.52 |
51.508 |
17.85 |
38.431 |
13.076 |
34.03 |
|
22.98 |
| | |
|
|
|
|
|
Algonquin |
4.070 |
8/12/24 |
-4.72 |
4.628 |
-12.06 |
5.888 |
-1.260 |
-21.40 |
|
-8.73 |
| | |
|
|
|
S |
|
Bank Montreal |
64.385 |
8/12/24 |
-0.10 |
66.100 |
-2.60 |
66.634 |
-0.534 |
-0.80 |
|
-6.64 |
| | |
|
|
|
|
|
Bank Nova Scotia |
35.396 |
8/12/24 |
-3.42 |
36.023 |
-1.74 |
36.696 |
-0.673 |
-1.83 |
|
-3.28 |
| | |
|
|
|
|
|
Barrick Gold |
15.053 |
8/12/24 |
9.37 |
13.136 |
14.59 |
12.869 |
0.267 |
2.08 |
|
1.20 |
| | |
|
|
|
L |
|
BCE |
27.538 |
8/12/24 |
-0.40 |
25.506 |
7.97 |
33.449 |
-7.942 |
-23.74 |
|
-15.63 |
| | |
|
|
|
|
|
Brookfield Asset |
30.969 |
8/12/24 |
-1.08 |
29.979 |
3.30 |
26.661 |
3.318 |
12.45 |
|
3.91 |
| | |
|
|
|
|
|
Brookfield Corp |
34.930 |
8/12/24 |
-1.65 |
32.754 |
6.64 |
26.158 |
6.595 |
25.21 |
|
11.99 |
| | |
|
|
|
|
|
Brookfield Infra |
23.739 |
8/12/24 |
-0.27 |
21.632 |
9.74 |
25.253 |
-3.621 |
-14.34 |
|
-8.33 |
| | |
|
|
|
|
|
CAE |
13.021 |
8/12/24 |
-0.92 |
14.627 |
-10.98 |
18.564 |
-3.937 |
-21.21 |
|
-11.90 |
| | |
|
|
|
|
|
Cameco |
30.929 |
8/12/24 |
-1.09 |
38.746 |
-20.18 |
29.091 |
9.655 |
33.19 |
|
17.69 |
| | |
|
|
|
S |
|
Cdn Apartment Props |
28.246 |
8/12/24 |
-0.30 |
25.587 |
10.39 |
28.185 |
-2.598 |
-9.22 |
|
-7.27 |
| | |
|
|
|
|
|
Cdn Imp Bk Comm |
40.116 |
8/12/24 |
-0.36 |
37.445 |
7.13 |
31.842 |
5.603 |
17.60 |
|
7.72 |
| | |
|
|
|
|
|
Cdn Nat Railway |
87.612 |
8/12/24 |
-0.01 |
93.057 |
-5.85 |
89.183 |
3.875 |
4.34 |
|
-2.47 |
| | |
|
|
|
|
|
Cdn Nat Resources |
28.264 |
8/12/24 |
2.68 |
28.051 |
0.76 |
24.786 |
3.265 |
13.17 |
|
7.21 |
| | |
|
|
|
|
|
Cdn Pac Kansas City |
61.098 |
8/12/24 |
-0.66 |
62.019 |
-1.49 |
62.586 |
-0.567 |
-0.91 |
|
-1.38 |
| | |
|
|
|
L |
|
Cdn Tire |
85.919 |
8/12/24 |
-0.17 |
78.137 |
9.96 |
90.041 |
-11.904 |
-13.22 |
|
-8.58 |
| | |
|
|
|
L |
|
CCL Industries |
42.246 |
8/12/24 |
-0.72 |
41.411 |
2.02 |
35.201 |
6.210 |
17.64 |
|
13.12 |
| | |
|
|
|
|
|
Cenovus Energy |
15.030 |
8/12/24 |
3.28 |
15.479 |
-2.90 |
15.071 |
0.408 |
2.71 |
|
5.86 |
| | |
|
|
|
S |
|
CGI Group |
83.830 |
8/12/24 |
-0.70 |
78.603 |
6.65 |
81.162 |
-2.559 |
-3.15 |
|
-5.36 |
| | |
|
|
|
|
|
Constellation Soft |
2,279.253 |
8/12/24 |
-2.83 |
2,269.087 |
0.45 |
1,590.665 |
678.423 |
42.65 |
|
20.38 |
| | |
|
|
|
|
|
Couche-Tard |
46.396 |
8/12/24 |
0.89 |
44.192 |
4.99 |
40.914 |
3.278 |
8.01 |
|
0.32 |
| | |
|
|
|
L |
|
Dollarama |
74.211 |
8/12/24 |
1.46 |
71.903 |
3.21 |
50.085 |
21.817 |
43.56 |
|
23.36 |
| | |
|
|
|
|
|
Emera |
28.097 |
8/12/24 |
-0.69 |
26.278 |
6.92 |
29.663 |
-3.385 |
-11.41 |
|
-8.67 |
| |
|
instrument |
freshest |
⇓ Δday |
7/01/24 |
⇓ Δwk |
8/28/23 |
prc diff |
⇓ Δ44 |
|
⇓∅-RS |
| | |
|
|
|
|
|
Enbridge |
30.900 |
8/12/24 |
0.60 |
28.016 |
10.29 |
27.560 |
0.456 |
1.65 |
|
0.29 |
| | |
|
|
|
L |
|
First Quantum |
9.187 |
8/12/24 |
2.77 |
10.344 |
-11.19 |
20.101 |
-9.757 |
-48.54 |
|
1.10 |
| | |
|
|
|
|
|
FirstService |
132.983 |
8/12/24 |
-0.57 |
119.847 |
10.96 |
118.384 |
1.463 |
1.24 |
|
-2.56 |
| | |
|
|
|
|
|
Fortis (CA) |
33.824 |
8/12/24 |
-0.39 |
30.607 |
10.51 |
31.159 |
-0.552 |
-1.77 |
|
-4.14 |
| | |
|
|
|
|
|
Franco-Nevada |
98.048 |
8/12/24 |
2.47 |
93.368 |
5.01 |
112.227 |
-18.859 |
-16.80 |
|
-4.33 |
| | |
|
|
|
L |
|
George Weston |
120.014 |
8/12/24 |
0.64 |
113.279 |
5.95 |
87.582 |
25.697 |
29.34 |
|
16.01 |
| | |
|
|
|
L |
|
Gildan Activewear |
32.811 |
8/12/24 |
-0.42 |
29.870 |
9.85 |
23.121 |
6.749 |
29.19 |
|
15.14 |
| | |
|
|
|
|
|
Hydro One |
25.190 |
8/12/24 |
-0.09 |
22.939 |
9.81 |
21.088 |
1.851 |
8.78 |
|
2.20 |
| | |
|
|
|
|
|
Imperial Oil |
59.452 |
8/12/24 |
3.95 |
53.695 |
10.72 |
44.267 |
9.428 |
21.30 |
|
13.85 |
| | |
|
|
|
|
|
Intact Financial |
142.884 |
8/12/24 |
0.94 |
131.251 |
8.86 |
113.139 |
18.112 |
16.01 |
|
6.80 |
| | |
|
|
|
L |
|
Kinross Gold |
7.052 |
8/12/24 |
5.15 |
6.556 |
7.55 |
3.961 |
2.596 |
65.54 |
|
48.47 |
| | |
|
|
|
|
|
Loblaw |
95.423 |
8/12/24 |
0.48 |
91.353 |
4.45 |
68.375 |
22.978 |
33.61 |
|
19.54 |
| | |
|
|
|
S |
|
Magna |
30.094 |
8/12/24 |
-1.88 |
33.007 |
-8.82 |
45.248 |
-12.241 |
-27.05 |
|
-22.33 |
| | |
|
|
|
|
|
Manulife Financial |
19.756 |
8/12/24 |
-0.35 |
20.970 |
-5.79 |
14.283 |
6.688 |
46.83 |
|
25.49 |
| | |
|
|
|
L |
|
Metro (CA) |
45.711 |
8/12/24 |
-0.43 |
43.627 |
4.78 |
40.756 |
2.871 |
7.04 |
|
4.13 |
| | |
|
|
|
|
|
National Bank CA |
65.864 |
8/12/24 |
0.39 |
62.462 |
5.45 |
58.088 |
4.374 |
7.53 |
|
5.58 |
| | |
|
|
|
|
|
Nutrien |
36.541 |
8/12/24 |
0.51 |
40.093 |
-8.86 |
49.589 |
-9.496 |
-19.15 |
|
-10.58 |
| | |
|
|
|
S |
|
Open Text |
23.555 |
8/12/24 |
-1.49 |
23.647 |
-0.39 |
30.972 |
-7.325 |
-23.65 |
|
-19.87 |
| | |
|
|
|
|
|
Pembina Pipeline |
30.048 |
8/12/24 |
-1.69 |
29.219 |
2.84 |
24.318 |
4.901 |
20.15 |
|
11.03 |
| | |
|
|
|
|
|
Power Canada |
21.558 |
8/12/24 |
2.02 |
21.886 |
-1.50 |
21.310 |
0.576 |
2.70 |
|
-0.19 |
| | |
|
|
|
S |
|
Restaurant Brands |
55.238 |
8/12/24 |
-0.84 |
55.491 |
-0.46 |
53.795 |
1.697 |
3.15 |
|
-3.82 |
| | |
|
|
|
|
|
Rogers Comm |
31.182 |
8/12/24 |
-0.79 |
29.127 |
7.06 |
32.029 |
-2.902 |
-9.06 |
|
-12.58 |
| | |
|
|
|
L |
|
Royal Bank CA |
85.632 |
8/12/24 |
-0.72 |
83.841 |
2.14 |
71.278 |
12.563 |
17.63 |
|
11.02 |
| | |
|
|
|
L |
|
Saputo |
16.924 |
8/12/24 |
-4.05 |
17.684 |
-4.30 |
16.759 |
0.924 |
5.51 |
|
9.26 |
| | |
|
|
|
|
|
Shopify |
54.052 |
8/12/24 |
-1.29 |
52.043 |
3.86 |
44.769 |
7.274 |
16.25 |
|
-1.18 |
| |
|
instrument |
freshest |
⇓ Δday |
7/01/24 |
⇓ Δwk |
8/28/23 |
prc diff |
⇓ Δ44 |
|
⇓∅-RS |
| | |
|
|
|
S |
|
Sun Life Financial |
37.957 |
8/12/24 |
-0.11 |
38.614 |
-1.70 |
37.906 |
0.708 |
1.87 |
|
-4.35 |
| | |
|
|
|
|
|
Suncor Energy |
32.074 |
8/12/24 |
2.28 |
30.019 |
6.85 |
26.404 |
3.616 |
13.69 |
|
12.16 |
| | |
|
|
|
L |
|
TC Energy |
34.423 |
8/12/24 |
0.57 |
29.852 |
15.31 |
28.337 |
1.515 |
5.35 |
|
-0.25 |
| | |
|
|
|
|
|
Teck Resources |
36.737 |
8/12/24 |
2.36 |
37.739 |
-2.65 |
31.930 |
5.809 |
18.19 |
|
13.75 |
| | |
|
|
|
S |
|
Telus |
12.975 |
8/12/24 |
0.09 |
11.921 |
8.84 |
13.809 |
-1.888 |
-13.67 |
|
-12.65 |
| | |
|
|
|
L |
|
Thomson Reuters (CA) |
127.106 |
8/12/24 |
-0.41 |
132.747 |
-4.25 |
100.591 |
32.156 |
31.97 |
|
16.96 |
| | |
|
|
|
S |
|
Toronto-Dominion |
45.193 |
8/12/24 |
0.19 |
43.288 |
4.40 |
47.918 |
-4.630 |
-9.66 |
|
-9.12 |
| | |
|
|
|
|
|
Tourmaline Oil |
34.958 |
8/12/24 |
4.20 |
35.718 |
-2.13 |
39.465 |
-3.747 |
-9.49 |
|
-5.79 |
| | |
|
|
|
|
|
Waste Connections |
142.384 |
8/12/24 |
-0.11 |
138.170 |
3.05 |
109.418 |
28.752 |
26.28 |
|
16.56 |
| | |
|
|
|
L |
|
Wheaton Precious |
45.251 |
8/12/24 |
2.56 |
41.290 |
9.59 |
34.167 |
7.123 |
20.85 |
|
12.55 |
| | |
|
|
|
|
|
WSP Global |
122.259 |
8/12/24 |
0.19 |
122.628 |
-0.30 |
109.196 |
13.432 |
12.30 |
|
6.99 |
| TSX 60 - 60 out of 60 instruments rated - 7/01/24 / 8/28/23 - 39 did rise, Market-Ratio(44) in GBP = 65.00 % |
| Stock Exchange Currency: CAD $ Canadian dollar |
Technical Chart
Transactions Toronto Stock Exchange 60 in Pound sterling * S44 - 43/46 (1)
|
⇐ |
| |
| L/S | date buy | date sell | days | | instrument | spl | pieces | | prc buy | prc sell | ps short | prc diff | d % | asset | yield | |
| 1/02/06 |
3/17/08 |
805 |
|
- cash - |
| short |
3/17/08 |
3/24/08 |
7 |
|
|
|
Bausch Health |
100 |
1,690 |
|
5.915 |
5.935 |
5.895 |
-0.020 |
0 |
9,965 |
-17 |
|
| 3/24/08 |
7/14/08 |
112 |
|
- cash - |
| |
7/14/08 |
7/28/08 |
14 |
|
|
|
Couche-Tard |
100 |
10,170 |
|
0.980 |
0.884 |
1.086 |
0.106 |
11 |
11,048 |
1,372 |
|
| 7/28/08 |
8/11/08 |
14 |
|
- cash - |
| |
8/11/08 |
7/27/09 |
350 |
|
|
|
Wheaton Precious |
100 |
2,107 |
|
5.242 |
5.564 |
4.920 |
-0.322 |
-6 |
10,370 |
-6 |
|
| 7/27/09 |
8/22/11 |
756 |
|
- cash - |
| |
8/22/11 |
9/12/11 |
21 |
|
|
|
BlackBerry |
100 |
643 |
|
16.114 |
14.865 |
17.469 |
1.355 |
8 |
11,241 |
307 |
|
| 9/12/11 |
9/19/11 |
7 |
|
- cash - |
| |
9/19/11 |
10/24/11 |
35 |
|
|
|
BlackBerry |
100 |
789 |
|
14.237 |
13.179 |
15.379 |
1.143 |
8 |
12,142 |
124 |
|
| 10/24/11 |
10/31/11 |
7 |
|
- cash - |
| |
10/31/11 |
4/16/12 |
168 |
|
|
|
BlackBerry |
100 |
963 |
|
12.608 |
8.338 |
19.063 |
6.456 |
51 |
18,359 |
146 |
|
| 4/16/12 |
4/30/12 |
14 |
|
- cash - |
| |
4/30/12 |
6/04/12 |
35 |
|
|
|
BlackBerry |
100 |
2,317 |
|
7.921 |
6.484 |
9.676 |
1.756 |
22 |
22,427 |
707 |
|
| 6/04/12 |
6/08/15 |
1099 |
|
- cash - |
| |
6/08/15 |
10/19/15 |
133 |
|
|
|
Teck Resources |
100 |
3,032 |
|
7.395 |
4.019 |
13.606 |
6.212 |
84 |
41,260 |
433 |
|
| 10/19/15 |
11/02/15 |
14 |
|
- cash - |
| |
11/02/15 |
4/11/16 |
161 |
|
|
|
Bausch Health |
100 |
631 |
|
65.314 |
22.019 |
193.735 |
128.421 |
197 |
122,294 |
1,076 |
|
| 4/11/16 |
2/12/18 |
672 |
|
- cash - |
| |
2/12/18 |
2/26/18 |
14 |
|
|
|
ARC Resources |
100 |
16,512 |
|
7.406 |
7.575 |
7.237 |
-0.169 |
-2 |
119,502 |
-45 |
|
| 2/26/18 |
3/12/18 |
14 |
|
- cash - |
| |
3/12/18 |
4/23/18 |
42 |
|
|
|
Barrick Gold |
100 |
13,670 |
|
8.742 |
9.264 |
8.220 |
-0.522 |
-6 |
112,366 |
-41 |
|
| 4/23/18 |
9/17/18 |
147 |
|
- cash - |
| |
9/17/18 |
2/04/19 |
140 |
|
|
|
Barrick Gold |
100 |
14,263 |
|
7.878 |
10.229 |
5.527 |
-2.351 |
-30 |
78,829 |
-60 |
|
| 2/04/19 |
3/09/20 |
399 |
|
- cash - |
| |
3/09/20 |
1/04/21 |
301 |
|
|
|
Cenovus Energy |
100 |
36,837 |
|
2.140 |
4.561 |
0.000 |
-2.140 |
-100 |
0 |
-100 |
|
| 1/04/21 |
6/20/22 |
532 |
|
- cash - |
| |
6/20/22 |
8/08/22 |
49 |
|
|
|
Bausch Health |
100 |
0 |
|
6.138 |
4.828 |
7.802 |
1.665 |
27 |
0 |
0 |
|
| 8/08/22 |
8/22/22 |
14 |
|
- cash - |
| |
8/22/22 |
3/06/23 |
196 |
|
|
|
Bausch Health |
100 |
0 |
|
4.740 |
7.336 |
2.145 |
-2.595 |
-55 |
0 |
0 |
|
| 3/06/23 |
10/02/23 |
210 |
|
- cash - |
| |
10/02/23 |
10/23/23 |
21 |
|
|
|
Algonquin |
100 |
0 |
|
4.616 |
4.156 |
5.127 |
0.511 |
11 |
0 |
0 |
|
| 10/23/23 |
10/30/23 |
7 |
|
- cash - |
| |
10/30/23 |
11/06/23 |
7 |
|
|
|
First Quantum |
100 |
0 |
|
11.900 |
10.045 |
14.097 |
2.197 |
18 |
0 |
0 |
|
| 11/06/23 |
11/27/23 |
21 |
|
- cash - |
| |
11/27/23 |
12/11/23 |
14 |
|
|
|
First Quantum |
100 |
0 |
|
7.409 |
5.815 |
9.441 |
2.031 |
27 |
0 |
0 |
|
| 12/11/23 |
6/22/26 |
924 |
|
- cash - |
| accum | 3/17/08 |
12/11/23 | 1708 |
days out of 7476 invested (23%) |
-100 |
0 |
-90 |
|
Instrument Related Contribution
| instrument | L/S | date buy | date sell | days | prc buy | prc sell | ps short | prc diff | d % | | | total |
| BlackBerry | short | 8/22/11 | 9/12/11 | 21 | 16.11 | 14.86 | 17.47 | 1.35 | 8.41 | | | |
| | | 9/19/11 | 10/24/11 | 35 | 14.24 | 13.18 | 15.38 | 1.14 | 8.03 | | | |
| | | 10/31/11 | 4/16/12 | 168 | 12.61 | 8.34 | 19.06 | 6.46 | 51.20 | | | |
| | | 4/30/12 | 6/04/12 | 35 | 7.92 | 6.48 | 9.68 | 1.76 | 22.17 | | | 116.32 |
| Teck Resources | | 6/08/15 | 10/19/15 | 133 | 7.39 | 4.02 | 13.61 | 6.21 | 84.00 | | | 84.00 |
| Bausch Health | | 3/17/08 | 3/24/08 | 7 | 5.91 | 5.94 | 5.89 | -0.02 | -0.35 | | | |
| | | 11/02/15 | 4/11/16 | 161 | 65.31 | 22.02 | 193.73 | 128.42 | 196.62 | | | |
| | | 6/20/22 | 8/08/22 | 49 | 6.14 | 4.83 | 7.80 | 1.66 | 27.12 | | | |
| | | 8/22/22 | 3/06/23 | 196 | 4.74 | 7.34 | 2.15 | -2.60 | -54.75 | | | 70.03 |
| First Quantum | | 10/30/23 | 11/06/23 | 7 | 11.90 | 10.05 | 14.10 | 2.20 | 18.47 | | | |
| | | 11/27/23 | 12/11/23 | 14 | 7.41 | 5.82 | 9.44 | 2.03 | 27.41 | | | 50.94 |
| Algonquin | | 10/02/23 | 10/23/23 | 21 | 4.62 | 4.16 | 5.13 | 0.51 | 11.07 | | | 11.07 |
| Couche-Tard | | 7/14/08 | 7/28/08 | 14 | 0.98 | 0.88 | 1.09 | 0.11 | 10.86 | | | 10.86 |
| ARC Resources | | 2/12/18 | 2/26/18 | 14 | 7.41 | 7.58 | 7.24 | -0.17 | -2.28 | | | -2.28 |
| Wheaton Precious | | 8/11/08 | 7/27/09 | 350 | 5.24 | 5.56 | 4.92 | -0.32 | -6.14 | | | -6.14 |
| Barrick Gold | | 3/12/18 | 4/23/18 | 42 | 8.74 | 9.26 | 8.22 | -0.52 | -5.97 | | | |
| | | 9/17/18 | 2/04/19 | 140 | 7.88 | 10.23 | 5.53 | -2.35 | -29.85 | | | -34.04 |
| Cenovus Energy | | 3/09/20 | 1/04/21 | 301 | 2.14 | 4.56 | 0.00 | -2.14 | -100.00 | | | -100.00 |
Annotations
| 6/11/24 | Cdn Nat Resources | | | stock split 1:2 (two for one) |
| 5/16/22 | Cdn Imp Bk Comm | | | stock split 1:2 (two for one) |
| 5/15/21 | Cdn Pac Railway | | | stock split 1:5 (cinque per una) |
| 9/30/19 | Couche-Tard | | | stock split 1:2 (two for one) |
| 4/18/19 | TSX 60 | | | Canopy Growth replaces Goldcorp (mergered with Newmont) |
| 1/02/18 | Nutrien | | | merger of Agrium with Potash |
| 5/22/17 | Silver Wheaton | | | is now called Wheaton Precious Metals |
| 6/09/16 | TSX 60 | | | complete analysis |
| 6/08/16 | TSX 60 | | | index adaption: Dollarama replaces TransAlta |
| 2/23/16 | TSX 60 | | | Emera replaces Canadian Oil Sands (acquisition by Suncor) |
| 8/17/15 | TSX 60 | | | complete analysis |
| 8/15/15 | TSX 60 | | | component correction: ARC Energy Trust (AET-UN) replaced by ARC Resources (ARX) |
| 8/03/15 | TSX 60 | | | Constellation Software replaces Catamaran (acquired by UnitedHealth) |
| 5/12/15 | Brookfield Ass Mgmt | | | forward stock split 2:3 (three for two - as a stock dividend a half bonus share for one) |
| 5/11/15 | TSX 60 | | | Franco-Nevada replaces Talisman Energy. |
| | Franco-Nevada | | | registered |
| | TSX 60 | | | Talisman Energy drops out due to the acquisition by Repsol. |
| 3/30/15 | Gildan Activewear | | | forward stock split 1:2 (two for one) |
| 2/12/15 | Metro (CA) | | | forward stock split 1:3 (three for one) |
|