| | Sun, 28th Jun 2026, 10:04UTC |
| | |

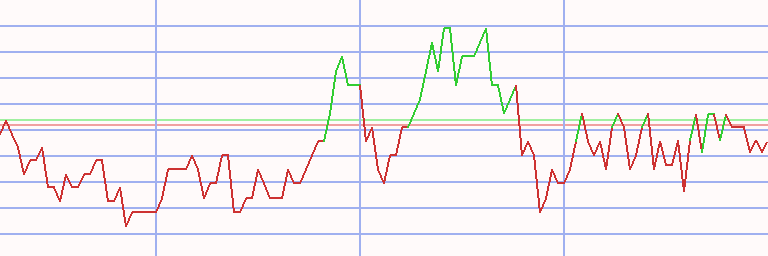
Assessment - NZX 20 Index in Dollar - 1/07/24 - RS = 34
⇐
| |
|
instrument |
freshest |
⇓ Δday |
1/07/24 |
⇓ Δwk |
6/11/23 |
prc diff |
⇓ Δ34 |
|
⇓∅-RS |
| |  |
 |
 |
|
S |
 |
SOM Price Index |
270.358 |
12/08/24 |
0.05 |
255.518 |
5.81 |
257.411 |
-1.893 |
-0.74 |
|
-4.48 |
| | |
|
|
|
L |
|
a2 Milk |
4.522 |
12/08/24 |
0.95 |
4.400 |
2.76 |
2.582 |
1.818 |
70.40 |
|
37.47 |
| | |
|
|
|
S |
|
Auckland Int Airport |
4.510 |
12/08/24 |
0.68 |
4.643 |
-2.88 |
4.699 |
-0.055 |
-1.18 |
|
-5.15 |
| | |
|
|
|
|
|
Chorus |
4.795 |
12/08/24 |
0.13 |
4.692 |
2.20 |
4.453 |
0.238 |
5.35 |
|
-0.04 |
| | |
|
|
|
L |
|
Contact Energy |
5.086 |
12/08/24 |
0.84 |
5.535 |
-8.11 |
4.842 |
0.693 |
14.32 |
|
10.90 |
| | |
|
|
|
S |
|
Ebos |
21.917 |
12/08/24 |
0.11 |
19.513 |
12.32 |
22.656 |
-3.142 |
-13.87 |
|
-10.06 |
| | |
|
|
|
L |
|
Fisher & Paykel HC |
19.902 |
12/08/24 |
0.89 |
18.178 |
9.48 |
13.540 |
4.639 |
34.26 |
|
24.37 |
| | |
|
|
|
S |
|
Fletcher Building |
1.894 |
12/08/24 |
0.65 |
1.827 |
3.65 |
2.702 |
-0.875 |
-32.38 |
|
-29.92 |
| | |
|
|
|
S |
|
Freightways |
5.432 |
12/08/24 |
1.24 |
4.746 |
14.45 |
4.758 |
-0.012 |
-0.25 |
|
-6.33 |
| | |
|
|
|
S |
|
Goodman Property |
1.232 |
12/08/24 |
-1.46 |
1.217 |
1.25 |
1.222 |
-0.006 |
-0.45 |
|
-7.74 |
| | |
|
|
|
|
|
Infratil |
6.415 |
12/08/24 |
-0.75 |
6.767 |
-5.20 |
6.205 |
0.563 |
9.07 |
|
8.07 |
| | |
|
|
|
|
|
Kiwi Property |
0.546 |
12/08/24 |
|
0.498 |
9.76 |
0.478 |
0.019 |
4.07 |
|
-3.81 |
| | |
|
|
|
L |
|
Mainfreight |
44.065 |
12/08/24 |
-0.55 |
42.031 |
4.84 |
34.372 |
7.659 |
22.28 |
|
3.11 |
| | |
|
|
|
|
|
Mercury |
3.909 |
12/08/24 |
-2.13 |
4.073 |
-4.02 |
3.664 |
0.408 |
11.14 |
|
4.68 |
| | |
|
|
|
L |
|
Meridian Energy (NS) |
3.824 |
12/08/24 |
1.29 |
4.006 |
-4.55 |
3.061 |
0.945 |
30.88 |
|
18.95 |
| | |
|
|
|
|
|
Port of Tauranga |
3.290 |
12/08/24 |
-0.91 |
2.919 |
12.68 |
3.108 |
-0.189 |
-6.08 |
|
-11.52 |
| | |
|
|
|
S |
|
Precinct Properties |
0.759 |
12/08/24 |
0.81 |
0.689 |
10.13 |
0.687 |
0.001 |
0.21 |
|
-5.70 |
| | |
|
|
|
S |
|
Ryman Healthcare |
2.828 |
12/08/24 |
0.65 |
2.149 |
31.64 |
3.467 |
-1.318 |
-38.03 |
|
-32.57 |
| | |
|
|
|
S |
|
Skycity Entertainm. |
0.941 |
12/08/24 |
-0.64 |
0.898 |
4.73 |
1.160 |
-0.261 |
-22.54 |
|
-22.91 |
| | |
|
|
|
S |
|
Spark New Zealand |
2.622 |
12/08/24 |
|
2.482 |
5.62 |
3.025 |
-0.542 |
-17.93 |
|
-16.38 |
| | |
|
|
|
S |
|
Summerset |
6.616 |
12/08/24 |
-0.73 |
5.730 |
15.47 |
5.918 |
-0.188 |
-3.18 |
|
-7.61 |
| NZX 20 - 20 out of 20 instruments rated - 1/07/24 / 6/11/23 - 10 did rise, Market-Ratio(34) in USD = 50.00 % |
| Stock Exchange Currency: NZD $ New Zealand dollar |
Technical Chart
Transactions NZX 20 Index in Dollar * S34 - 51/53 (1)
|
⇐ |
| |
| L/S | date buy | date sell | days | | instrument | spl | pieces | | prc buy | prc sell | ps short | prc diff | d % | asset | yield | |
| 2/01/06 |
16/01/06 |
14 |
|
- cash - |
| short |
16/01/06 |
30/01/06 |
14 |
|
|
|
Port of Tauranga |
100 |
16,263 |
|
0.615 |
0.597 |
0.633 |
0.018 |
3 |
10,300 |
116 |
|
| 30/01/06 |
27/02/06 |
28 |
|
- cash - |
| |
27/02/06 |
6/03/06 |
7 |
|
|
|
Spark New Zealand |
100 |
2,994 |
|
3.440 |
3.569 |
3.311 |
-0.129 |
-4 |
9,913 |
-86 |
|
| 6/03/06 |
20/08/07 |
532 |
|
- cash - |
| |
20/08/07 |
3/09/07 |
14 |
|
|
|
Skycity Entertainm. |
100 |
3,417 |
|
2.901 |
3.151 |
2.651 |
-0.250 |
-9 |
9,060 |
-90 |
|
| 3/09/07 |
10/09/07 |
7 |
|
- cash - |
| |
10/09/07 |
24/09/07 |
14 |
|
|
|
Fisher & Paykel HC |
100 |
3,662 |
|
2.474 |
2.522 |
2.425 |
-0.049 |
-2 |
8,882 |
-40 |
|
| 24/09/07 |
12/11/07 |
49 |
|
- cash - |
| |
12/11/07 |
3/12/07 |
21 |
|
|
|
Fisher & Paykel HC |
100 |
3,620 |
|
2.453 |
2.446 |
2.460 |
0.007 |
0 |
8,908 |
5 |
|
| 3/12/07 |
10/12/07 |
7 |
|
- cash - |
| |
10/12/07 |
27/07/09 |
595 |
|
|
|
Air New Zealand |
100 |
6,199 |
|
1.437 |
0.643 |
3.211 |
1.774 |
124 |
19,907 |
64 |
|
| 27/07/09 |
3/08/09 |
7 |
|
- cash - |
| |
3/08/09 |
10/08/09 |
7 |
|
|
|
Contact Energy |
100 |
5,306 |
|
3.752 |
3.909 |
3.595 |
-0.157 |
-4 |
19,074 |
-89 |
|
| 10/08/09 |
24/05/10 |
287 |
|
- cash - |
| |
24/05/10 |
27/09/10 |
126 |
|
|
|
Spark New Zealand |
100 |
14,339 |
|
1.330 |
1.497 |
1.163 |
-0.167 |
-13 |
16,676 |
-32 |
|
| 27/09/10 |
6/12/10 |
70 |
|
- cash - |
| |
6/12/10 |
13/12/10 |
7 |
|
|
|
Fisher & Paykel HC |
100 |
6,955 |
|
2.398 |
2.316 |
2.483 |
0.085 |
4 |
17,268 |
517 |
|
| 13/12/10 |
18/07/11 |
217 |
|
- cash - |
| |
18/07/11 |
25/07/11 |
7 |
|
|
|
Fisher & Paykel HC |
100 |
7,858 |
|
2.197 |
2.136 |
2.261 |
0.064 |
3 |
17,768 |
343 |
|
| 25/07/11 |
22/08/11 |
28 |
|
- cash - |
| |
22/08/11 |
29/08/11 |
7 |
|
|
|
Fisher & Paykel HC |
100 |
9,208 |
|
1.930 |
1.848 |
2.015 |
0.086 |
4 |
18,558 |
864 |
|
| 29/08/11 |
28/11/11 |
91 |
|
- cash - |
| |
28/11/11 |
12/12/11 |
14 |
|
|
|
Fletcher Building |
100 |
4,265 |
|
4.350 |
4.792 |
3.909 |
-0.441 |
-10 |
16,675 |
-94 |
|
| 12/12/11 |
26/12/11 |
14 |
|
- cash - |
| |
26/12/11 |
12/03/12 |
77 |
|
|
|
Air New Zealand |
100 |
24,194 |
|
0.689 |
0.706 |
0.672 |
-0.017 |
-2 |
16,259 |
-11 |
|
| 12/03/12 |
28/05/12 |
77 |
|
- cash - |
| |
28/05/12 |
4/06/12 |
7 |
|
|
|
Fisher & Paykel HC |
100 |
9,888 |
|
1.644 |
1.539 |
1.757 |
0.112 |
7 |
17,369 |
3,032 |
|
| 4/06/12 |
25/06/12 |
21 |
|
- cash - |
| |
25/06/12 |
16/07/12 |
21 |
|
|
|
Fisher & Paykel HC |
100 |
11,326 |
|
1.534 |
1.593 |
1.474 |
-0.060 |
-4 |
16,695 |
-50 |
|
| 16/07/12 |
9/12/13 |
511 |
|
- cash - |
| |
9/12/13 |
10/02/14 |
63 |
|
|
|
Trade Me |
100 |
4,928 |
|
3.387 |
3.134 |
3.662 |
0.274 |
8 |
18,046 |
57 |
|
| 10/02/14 |
10/03/14 |
28 |
|
- cash - |
| |
10/03/14 |
17/03/14 |
7 |
|
|
|
Trade Me |
100 |
5,392 |
|
3.347 |
3.152 |
3.554 |
0.207 |
6 |
19,161 |
2,181 |
|
| 17/03/14 |
31/03/14 |
14 |
|
- cash - |
| |
31/03/14 |
7/04/14 |
7 |
|
|
|
Trade Me |
100 |
5,427 |
|
3.530 |
3.364 |
3.706 |
0.175 |
5 |
20,111 |
1,147 |
|
| 7/04/14 |
24/08/15 |
504 |
|
- cash - |
| |
24/08/15 |
16/11/15 |
84 |
|
|
|
Xero |
100 |
2,247 |
|
8.950 |
12.206 |
5.695 |
-3.256 |
-36 |
12,796 |
-86 |
|
| 16/11/15 |
21/11/16 |
371 |
|
- cash - |
| |
21/11/16 |
20/02/17 |
91 |
|
|
|
Skycity Entertainm. |
100 |
4,729 |
|
2.706 |
2.887 |
2.524 |
-0.181 |
-7 |
11,938 |
-24 |
|
| 20/02/17 |
27/02/17 |
7 |
|
- cash - |
| |
27/02/17 |
5/06/17 |
98 |
|
|
|
Sky Network Telev. |
100 |
438 |
|
27.213 |
25.878 |
28.618 |
1.404 |
5 |
12,553 |
21 |
|
| 5/06/17 |
12/06/17 |
7 |
|
- cash - |
| |
12/06/17 |
19/06/17 |
7 |
|
|
|
Fletcher Building |
100 |
2,305 |
|
5.444 |
5.716 |
5.172 |
-0.272 |
-5 |
11,926 |
-93 |
|
| 19/06/17 |
15/01/18 |
210 |
|
- cash - |
| |
15/01/18 |
22/01/18 |
7 |
|
|
|
Sky Network Telev. |
100 |
580 |
|
20.559 |
20.517 |
20.601 |
0.042 |
0 |
11,950 |
11 |
|
| 22/01/18 |
29/01/18 |
7 |
|
- cash - |
| |
29/01/18 |
5/02/18 |
7 |
|
|
|
Sky Network Telev. |
100 |
581 |
|
20.557 |
20.495 |
20.620 |
0.062 |
0 |
11,986 |
17 |
|
| 5/02/18 |
12/02/18 |
7 |
|
- cash - |
| |
12/02/18 |
14/05/18 |
91 |
|
|
|
Chorus |
100 |
4,381 |
|
2.736 |
2.838 |
2.633 |
-0.102 |
-4 |
11,537 |
-14 |
|
| L/S | date buy | date sell | days | | instrument | spl | pieces | | prc buy | prc sell | ps short | prc diff | d % | asset | yield | |
| 14/05/18 |
2/03/20 |
658 |
|
- cash - |
| |
2/03/20 |
9/11/20 |
252 |
|
|
|
Sky Network Telev. |
100 |
3,479 |
|
3.316 |
1.003 |
10.963 |
7.647 |
231 |
38,142 |
465 |
|
| 9/11/20 |
12/07/21 |
245 |
|
- cash - |
| |
12/07/21 |
30/08/21 |
49 |
|
|
|
Chorus |
100 |
8,598 |
|
4.436 |
4.903 |
3.969 |
-0.467 |
-11 |
34,124 |
-56 |
|
| 30/08/21 |
20/09/21 |
21 |
|
- cash - |
| |
20/09/21 |
4/10/21 |
14 |
|
|
|
Chorus |
100 |
7,468 |
|
4.569 |
4.729 |
4.410 |
-0.160 |
-3 |
32,932 |
-60 |
|
| 4/10/21 |
22/11/21 |
49 |
|
- cash - |
| |
22/11/21 |
23/01/23 |
427 |
|
|
|
Meridian Energy (NS) |
100 |
10,466 |
|
3.146 |
3.418 |
2.875 |
-0.272 |
-9 |
30,087 |
-7 |
|
| 23/01/23 |
13/03/23 |
49 |
|
- cash - |
| |
13/03/23 |
8/05/23 |
56 |
|
|
|
Ryman Healthcare |
100 |
9,189 |
|
3.274 |
3.351 |
3.197 |
-0.077 |
-2 |
29,378 |
-14 |
|
| 8/05/23 |
11/09/23 |
126 |
|
- cash - |
| |
11/09/23 |
20/11/23 |
70 |
|
|
|
Skycity Entertainm. |
100 |
25,049 |
|
1.173 |
1.048 |
1.312 |
0.139 |
12 |
32,865 |
79 |
|
| 20/11/23 |
27/11/23 |
7 |
|
- cash - |
| |
27/11/23 |
1/01/24 |
35 |
|
|
|
Skycity Entertainm. |
100 |
30,503 |
|
1.077 |
1.153 |
1.002 |
-0.076 |
-7 |
30,562 |
-53 |
|
| 1/01/24 |
8/01/24 |
7 |
|
- cash - |
| |
8/01/24 |
5/02/24 |
28 |
|
|
|
Skycity Entertainm. |
100 |
27,489 |
|
1.112 |
1.284 |
0.939 |
-0.172 |
-16 |
25,823 |
-89 |
|
| 5/02/24 |
12/02/24 |
7 |
|
- cash - |
| |
12/02/24 |
1/04/24 |
49 |
|
|
|
Fletcher Building |
100 |
10,107 |
|
2.555 |
2.452 |
2.662 |
0.107 |
4 |
26,906 |
36 |
|
| 1/04/24 |
8/04/24 |
7 |
|
- cash - |
| |
8/04/24 |
15/04/24 |
7 |
|
|
|
Ryman Healthcare |
100 |
9,761 |
|
2.756 |
2.659 |
2.857 |
0.101 |
4 |
27,888 |
548 |
|
| 15/04/24 |
29/04/24 |
14 |
|
- cash - |
| |
29/04/24 |
6/05/24 |
7 |
|
|
|
Ryman Healthcare |
100 |
10,942 |
|
2.549 |
2.340 |
2.776 |
0.228 |
9 |
30,378 |
8,547 |
|
| 6/05/24 |
13/05/24 |
7 |
|
- cash - |
| |
13/05/24 |
12/08/24 |
91 |
|
|
|
Ryman Healthcare |
100 |
13,827 |
|
2.197 |
2.828 |
1.565 |
-0.632 |
-29 |
21,646 |
-74 |
|
| accum | 16/01/06 |
12/08/24 | 3170 |
days out of 7482 invested (42%) |
116 |
21,646 |
9 |
|
Instrument Related Contribution
| instrument | L/S | date buy | date sell | days | prc buy | prc sell | ps short | prc diff | d % | | | total |
| Sky Network Telev. | short | 27/02/17 | 5/06/17 | 98 | 27.21 | 25.88 | 28.62 | 1.40 | 5.16 | | | |
| | | 15/01/18 | 22/01/18 | 7 | 20.56 | 20.52 | 20.60 | 0.04 | 0.20 | | | |
| | | 29/01/18 | 5/02/18 | 7 | 20.56 | 20.50 | 20.62 | 0.06 | 0.30 | | | |
| | | 2/03/20 | 9/11/20 | 252 | 3.32 | 1.00 | 10.96 | 7.65 | 230.63 | | | 249.46 |
| Air New Zealand | | 10/12/07 | 27/07/09 | 595 | 1.44 | 0.64 | 3.21 | 1.77 | 123.50 | | | |
| | | 26/12/11 | 12/03/12 | 77 | 0.69 | 0.71 | 0.67 | -0.02 | -2.50 | | | 117.92 |
| Trade Me | | 9/12/13 | 10/02/14 | 63 | 3.39 | 3.13 | 3.66 | 0.27 | 8.09 | | | |
| | | 10/03/14 | 17/03/14 | 7 | 3.35 | 3.15 | 3.55 | 0.21 | 6.18 | | | |
| | | 31/03/14 | 7/04/14 | 7 | 3.53 | 3.36 | 3.71 | 0.18 | 4.96 | | | 20.47 |
| Fisher & Paykel HC | | 10/09/07 | 24/09/07 | 14 | 2.47 | 2.52 | 2.43 | -0.05 | -1.97 | | | |
| | | 12/11/07 | 3/12/07 | 21 | 2.45 | 2.45 | 2.46 | 0.01 | 0.29 | | | |
| | | 6/12/10 | 13/12/10 | 7 | 2.40 | 2.32 | 2.48 | 0.09 | 3.55 | | | |
| | | 18/07/11 | 25/07/11 | 7 | 2.20 | 2.14 | 2.26 | 0.06 | 2.90 | | | |
| | | 22/08/11 | 29/08/11 | 7 | 1.93 | 1.85 | 2.02 | 0.09 | 4.44 | | | |
| | | 28/05/12 | 4/06/12 | 7 | 1.64 | 1.54 | 1.76 | 0.11 | 6.83 | | | |
| | | 25/06/12 | 16/07/12 | 21 | 1.53 | 1.59 | 1.47 | -0.06 | -3.88 | | | 12.35 |
| Port of Tauranga | | 16/01/06 | 30/01/06 | 14 | 0.61 | 0.60 | 0.63 | 0.02 | 3.00 | | | 3.00 |
| Contact Energy | | 3/08/09 | 10/08/09 | 7 | 3.75 | 3.91 | 3.59 | -0.16 | -4.19 | | | -4.19 |
| Meridian Energy (NS) | | 22/11/21 | 23/01/23 | 427 | 3.15 | 3.42 | 2.87 | -0.27 | -8.64 | | | -8.64 |
| Fletcher Building | | 28/11/11 | 12/12/11 | 14 | 4.35 | 4.79 | 3.91 | -0.44 | -10.15 | | | |
| | | 12/06/17 | 19/06/17 | 7 | 5.44 | 5.72 | 5.17 | -0.27 | -5.00 | | | |
| | | 12/02/24 | 1/04/24 | 49 | 2.55 | 2.45 | 2.66 | 0.11 | 4.19 | | | -11.06 |
| Spark New Zealand | | 27/02/06 | 6/03/06 | 7 | 3.44 | 3.57 | 3.31 | -0.13 | -3.75 | | | |
| | | 24/05/10 | 27/09/10 | 126 | 1.33 | 1.50 | 1.16 | -0.17 | -12.57 | | | -15.85 |
| Chorus | | 12/02/18 | 14/05/18 | 91 | 2.74 | 2.84 | 2.63 | -0.10 | -3.75 | | | |
| | | 12/07/21 | 30/08/21 | 49 | 4.44 | 4.90 | 3.97 | -0.47 | -10.54 | | | |
| | | 20/09/21 | 4/10/21 | 14 | 4.57 | 4.73 | 4.41 | -0.16 | -3.49 | | | -16.89 |
| instrument | L/S | date buy | date sell | days | prc buy | prc sell | ps short | prc diff | d % | | | total |
| Ryman Healthcare | | 13/03/23 | 8/05/23 | 56 | 3.27 | 3.35 | 3.20 | -0.08 | -2.36 | | | |
| | | 8/04/24 | 15/04/24 | 7 | 2.76 | 2.66 | 2.86 | 0.10 | 3.65 | | | |
| | | 29/04/24 | 6/05/24 | 7 | 2.55 | 2.34 | 2.78 | 0.23 | 8.93 | | | |
| | | 13/05/24 | 12/08/24 | 91 | 2.20 | 2.83 | 1.57 | -0.63 | -28.75 | | | -21.45 |
| Skycity Entertainm. | | 20/08/07 | 3/09/07 | 14 | 2.90 | 3.15 | 2.65 | -0.25 | -8.61 | | | |
| | | 21/11/16 | 20/02/17 | 91 | 2.71 | 2.89 | 2.52 | -0.18 | -6.71 | | | |
| | | 11/09/23 | 20/11/23 | 70 | 1.17 | 1.05 | 1.31 | 0.14 | 11.87 | | | |
| | | 27/11/23 | 1/01/24 | 35 | 1.08 | 1.15 | 1.00 | -0.08 | -7.01 | | | |
| | | 8/01/24 | 5/02/24 | 28 | 1.11 | 1.28 | 0.94 | -0.17 | -15.50 | | | -25.06 |
| Xero | | 24/08/15 | 16/11/15 | 84 | 8.95 | 12.21 | 5.69 | -3.26 | -36.37 | | | -36.37 |
Annotations
| 23/02/24 | NZX 20 | | | Component update:
in: A2 Milk, Ebos, Freightways, Port of Tauranga and Summerset
out: Air New Zealand, Sky Network Television and Xero |
| 18/10/16 | Port of Tauranga | | | stock split 1:5 (five for one) |
| 29/07/16 | Mighty River Power | | | renames to Mercury NZ Limited |
| 17/06/16 | NZX 20 | | | Chorus replaces Port of Tauranga |
| 30/04/15 | Meridian Energy (NS) | | | replaces MELCA.NZ |
|
|