| | |
| | |

Auswertung - Medizintechnik - 1.07.24 - RS = 26
⇐
| |
|
⇓Wertpapier |
jüngster |
⇓ ΔTag |
1.07.24 |
⇓ ΔWo |
1.01.24 |
K-Diff |
⇓ Δ26 |
Whrg |
∅-RS |
| |  |
 |
 |
|
|
 |
SOM Medical Tech |
936,448 |
12.08.24 |
-0,02 |
924,069 |
1,34 |
961,781 |
-37,712 |
-3,92 |
USD |
1,19 |
| | |
|
|
|
L |
|
Ambu |
137,700 |
12.08.24 |
-0,40 |
136,550 |
0,84 |
105,200 |
31,350 |
29,80 |
DKK |
37,16 |
| | |
|
|
|
|
|
Intuitive Surgical |
465,530 |
12.08.24 |
0,46 |
436,240 |
6,71 |
337,360 |
98,880 |
29,31 |
USD |
27,85 |
| | |
|
|
|
L |
|
Fisher & Paykel HC |
32,790 |
12.08.24 |
0,89 |
29,950 |
9,48 |
23,600 |
6,350 |
26,91 |
NZD |
26,97 |
| | |
|
|
|
L |
|
Eckert & Ziegler |
42,420 |
12.08.24 |
1,34 |
46,020 |
-7,82 |
41,300 |
4,720 |
11,43 |
EUR |
20,02 |
| | |
|
|
|
L |
|
ResMed |
33,030 |
12.08.24 |
1,13 |
28,600 |
15,49 |
25,440 |
3,160 |
12,42 |
AUD |
18,50 |
| | |
|
|
|
|
|
Cochlear |
339,370 |
12.08.24 |
0,26 |
322,560 |
5,21 |
298,670 |
23,890 |
8,00 |
AUD |
17,08 |
| | |
|
|
|
L |
|
Amplifon |
28,150 |
12.08.24 |
1,33 |
33,220 |
-15,26 |
31,340 |
1,880 |
6,00 |
EUR |
12,85 |
| | |
|
|
|
L |
|
Sonova |
278,100 |
12.08.24 |
-1,52 |
280,300 |
-0,78 |
274,400 |
5,900 |
2,15 |
CHF |
8,87 |
| | |
|
|
|
|
|
Terumo |
2.611,000 |
9.08.24 |
5,05 |
2.548,000 |
2,47 |
2.311,000 |
237,000 |
10,26 |
JPY |
8,55 |
| | |
|
|
|
L |
|
Fresenius |
30,890 |
12.08.24 |
|
28,300 |
9,15 |
28,070 |
0,230 |
0,82 |
EUR |
8,43 |
| | |
|
|
|
|
|
DiaSorin |
100,100 |
12.08.24 |
0,48 |
93,280 |
7,31 |
93,240 |
0,040 |
0,04 |
EUR |
6,70 |
| | |
|
|
|
|
|
ConvaTec |
231,600 |
12.08.24 |
-0,17 |
236,400 |
-2,03 |
244,200 |
-7,800 |
-3,19 |
GBP |
4,59 |
| | |
|
|
|
L |
|
Stratec |
41,500 |
12.08.24 |
4,27 |
45,850 |
-9,49 |
45,550 |
0,300 |
0,66 |
EUR |
4,56 |
| | |
|
|
|
|
|
Drägerwerk |
45,750 |
12.08.24 |
0,44 |
49,950 |
-8,41 |
51,800 |
-1,850 |
-3,57 |
EUR |
4,48 |
| | |
|
|
|
|
|
Siemens Healthineers |
50,280 |
12.08.24 |
0,08 |
53,840 |
-6,61 |
52,600 |
1,240 |
2,36 |
EUR |
2,97 |
| | |
|
|
|
|
|
GE HealthCare |
82,370 |
12.08.24 |
-1,24 |
76,260 |
8,01 |
77,320 |
-1,060 |
-1,37 |
USD |
1,72 |
| | |
|
|
|
|
|
DexCom |
71,270 |
12.08.24 |
2,16 |
112,170 |
-36,46 |
124,090 |
-11,920 |
-9,61 |
USD |
1,43 |
| | |
|
|
|
|
|
Gerresheimer |
97,300 |
12.08.24 |
-1,47 |
101,100 |
-3,76 |
94,350 |
6,750 |
7,15 |
EUR |
-1,05 |
| | |
|
|
|
S |
|
Medtronic |
81,190 |
12.08.24 |
-1,04 |
77,120 |
5,28 |
82,380 |
-5,260 |
-6,39 |
USD |
-2,42 |
| | |
|
|
|
|
|
Fresenius MedCare |
33,130 |
12.08.24 |
-1,31 |
35,880 |
-7,66 |
37,960 |
-2,080 |
-5,48 |
EUR |
-3,75 |
| | |
|
|
|
S |
|
Sysmex |
2.624,000 |
9.08.24 |
1,04 |
2.526,500 |
3,86 |
2.619,330 |
-92,830 |
-3,54 |
JPY |
-5,26 |
| | |
|
|
|
|
|
Smith and Nephew |
1.156,000 |
12.08.24 |
-0,86 |
975,600 |
18,49 |
1.078,500 |
-102,900 |
-9,54 |
GBP |
-6,12 |
| | |
|
|
|
S |
|
Sino Biopharm |
2,950 |
12.08.24 |
2,08 |
2,670 |
10,49 |
3,470 |
-0,800 |
-23,05 |
HKD |
-11,18 |
| | |
|
|
|
S |
|
Getinge |
198,050 |
12.08.24 |
-0,10 |
181,450 |
9,15 |
224,600 |
-43,150 |
-19,21 |
SEK |
-12,69 |
| |
|
⇓Wertpapier |
jüngster |
⇓ ΔTag |
1.07.24 |
⇓ ΔWo |
1.01.24 |
K-Diff |
⇓ Δ26 |
Whrg |
∅-RS |
| | |
|
|
|
S |
|
Align Technology |
213,570 |
12.08.24 |
-0,63 |
238,640 |
-10,51 |
274,000 |
-35,360 |
-12,91 |
USD |
-13,41 |
| | |
|
|
|
|
|
Sonic Healthcare |
27,450 |
12.08.24 |
0,22 |
25,660 |
6,98 |
32,080 |
-6,420 |
-20,01 |
AUD |
-14,37 |
| | |
|
|
|
S |
|
Straumann |
112,350 |
12.08.24 |
0,76 |
112,700 |
-0,31 |
135,600 |
-22,900 |
-16,89 |
CHF |
-16,75 |
| | |
|
|
|
S |
|
Illumina |
124,540 |
12.08.24 |
0,79 |
105,500 |
18,05 |
139,240 |
-33,740 |
-24,23 |
USD |
-18,46 |
| | |
|
|
|
S |
|
Sartorius |
241,100 |
12.08.24 |
-2,90 |
211,700 |
13,89 |
333,200 |
-121,500 |
-36,46 |
EUR |
-21,62 |
| | |
|
|
|
S |
|
Carl Zeiss Meditec |
60,350 |
12.08.24 |
-5,33 |
66,250 |
-8,91 |
98,840 |
-32,590 |
-32,97 |
EUR |
-29,17 |
| | |
|
|
|
|
|
WuXi AppTec |
41,380 |
12.08.24 |
-0,29 |
38,660 |
7,04 |
72,760 |
-34,100 |
-46,87 |
CNY |
-29,23 |
| Medical Tech - 31 von 31 Wertpapieren bewertet - 1.07.24 / 1.01.24 - 14 davon sind besser, Markt-Kennzahl(26) = 45,16 % |
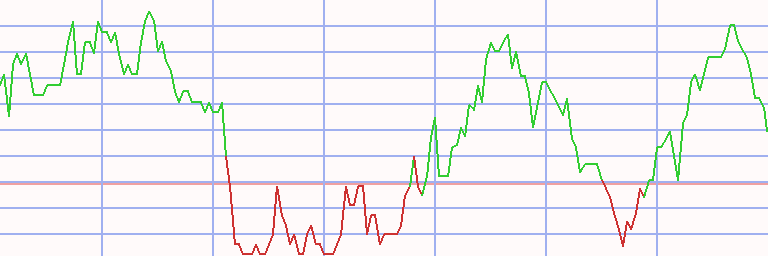
Technischer Chart
Transaktionen Medizintechnik * S26 - 28/28 (1)
|
⇐ |
| |
| L/S | K-Datum | V-Datum | Tage | | Wertpapier | Spl | Stück | Whrg | K-Kurs | V-Kurs | S-V-Kurs | K-Diff | D % | Kapital | Rdte | |
| 2.01.06 |
17.03.08 |
805 |
|
- cash - |
| short |
17.03.08 |
19.05.08 |
63 |
|
|
|
Drägerwerk |
100 |
281 |
EUR |
35,550 |
40,250 |
30,850 |
-4,700 |
-13 |
8.679 |
-56 |
|
| 19.05.08 |
2.06.08 |
14 |
|
- cash - |
| |
2.06.08 |
21.07.08 |
49 |
|
|
|
Fisher & Paykel HC |
100 |
3.616 |
NZD |
2,400 |
2,290 |
2,515 |
0,115 |
5 |
9.096 |
42 |
|
| 21.07.08 |
6.10.08 |
77 |
|
- cash - |
| |
6.10.08 |
13.04.09 |
189 |
|
|
|
Intuitive Surgical |
100 |
415 |
USD |
21,900 |
12,750 |
37,617 |
15,717 |
72 |
15.619 |
184 |
|
| 13.04.09 |
20.04.09 |
7 |
|
- cash - |
| |
20.04.09 |
27.04.09 |
7 |
|
|
|
Gerresheimer |
100 |
997 |
EUR |
15,660 |
17,240 |
14,080 |
-1,580 |
-10 |
14.043 |
-100 |
|
| 27.04.09 |
8.08.11 |
833 |
|
- cash - |
| |
8.08.11 |
15.08.11 |
7 |
|
|
|
Sonova |
100 |
220 |
CHF |
63,550 |
63,500 |
63,600 |
0,050 |
0 |
14.054 |
4 |
|
| 15.08.11 |
5.09.11 |
21 |
|
- cash - |
| |
5.09.11 |
12.09.11 |
7 |
|
|
|
Sonova |
100 |
223 |
CHF |
62,850 |
66,000 |
59,700 |
-3,150 |
-5 |
13.352 |
-93 |
|
| 12.09.11 |
3.10.11 |
21 |
|
- cash - |
| |
3.10.11 |
24.10.11 |
21 |
|
|
|
Illumina |
100 |
349 |
USD |
38,190 |
28,720 |
50,783 |
12,593 |
33 |
17.747 |
14.063 |
|
| 24.10.11 |
7.11.11 |
14 |
|
- cash - |
| |
7.11.11 |
5.12.11 |
28 |
|
|
|
Illumina |
100 |
542 |
USD |
32,740 |
29,440 |
36,410 |
3,670 |
11 |
19.736 |
299 |
|
| 5.12.11 |
12.12.11 |
7 |
|
- cash - |
| |
12.12.11 |
19.12.11 |
7 |
|
|
|
Illumina |
100 |
733 |
USD |
26,900 |
26,170 |
27,650 |
0,750 |
3 |
20.286 |
320 |
|
| 19.12.11 |
16.01.12 |
28 |
|
- cash - |
| |
16.01.12 |
23.01.12 |
7 |
|
|
|
Illumina |
100 |
563 |
USD |
36,000 |
36,310 |
35,690 |
-0,310 |
-1 |
20.111 |
-36 |
|
| 23.01.12 |
8.02.16 |
1477 |
|
- cash - |
| |
8.02.16 |
15.02.16 |
7 |
|
|
|
Drägerwerk |
100 |
370 |
EUR |
54,340 |
59,340 |
49,340 |
-5,000 |
-9 |
18.261 |
-99 |
|
| 15.02.16 |
21.11.16 |
280 |
|
- cash - |
| |
21.11.16 |
12.12.16 |
21 |
|
|
|
Getinge |
100 |
125 |
SEK |
146,000 |
144,000 |
148,028 |
2,028 |
1 |
18.515 |
27 |
|
| 12.12.16 |
2.01.17 |
21 |
|
- cash - |
| |
2.01.17 |
13.02.17 |
42 |
|
|
|
Illumina |
100 |
144 |
USD |
128,040 |
163,840 |
92,240 |
-35,800 |
-28 |
13.360 |
-94 |
|
| 13.02.17 |
24.12.18 |
679 |
|
- cash - |
| |
24.12.18 |
31.12.18 |
7 |
|
|
|
Align Technology |
100 |
68 |
USD |
193,720 |
209,430 |
178,010 |
-15,710 |
-8 |
12.291 |
-99 |
|
| 31.12.18 |
7.01.19 |
7 |
|
- cash - |
| |
7.01.19 |
21.01.19 |
14 |
|
|
|
Align Technology |
100 |
64 |
USD |
189,920 |
220,090 |
159,750 |
-30,170 |
-16 |
10.360 |
-99 |
|
| 21.01.19 |
28.01.19 |
7 |
|
- cash - |
| |
28.01.19 |
11.02.19 |
14 |
|
|
|
Fresenius |
100 |
231 |
EUR |
44,680 |
47,260 |
42,100 |
-2,580 |
-6 |
9.764 |
-79 |
|
| 11.02.19 |
25.02.19 |
14 |
|
- cash - |
| |
25.02.19 |
1.04.19 |
35 |
|
|
|
Henry Schein |
100 |
163 |
USD |
59,830 |
60,990 |
58,670 |
-1,160 |
-2 |
9.575 |
-18 |
|
| 1.04.19 |
16.03.20 |
350 |
|
- cash - |
| |
16.03.20 |
30.03.20 |
14 |
|
|
|
Fresenius |
100 |
323 |
EUR |
29,610 |
33,885 |
25,335 |
-4,275 |
-14 |
8.195 |
-98 |
|
| 30.03.20 |
17.01.22 |
658 |
|
- cash - |
| |
17.01.22 |
14.11.22 |
301 |
|
|
|
Ambu |
100 |
55 |
DKK |
147,200 |
98,000 |
221,100 |
73,900 |
50 |
12.259 |
64 |
|
| 14.11.22 |
21.11.22 |
7 |
|
- cash - |
| |
21.11.22 |
5.12.22 |
14 |
|
|
|
Align Technology |
100 |
63 |
USD |
191,630 |
187,910 |
195,424 |
3,794 |
2 |
12.498 |
67 |
|
| 5.12.22 |
2.10.23 |
301 |
|
- cash - |
| |
2.10.23 |
11.12.23 |
70 |
|
|
|
Stratec |
100 |
289 |
EUR |
43,200 |
39,500 |
47,247 |
4,047 |
9 |
13.667 |
60 |
|
| 11.12.23 |
5.07.25 |
572 |
|
- cash - |
| kum | 17.03.08 |
11.12.23 | 924 |
Tage von 7124 investiert (13%) |
37 |
13.667 |
13 |
|
Anteil der Einzelwerte
| Wertpapier | L/S | K-Datum | V-Datum | Tage | K-Kurs | V-Kurs | S-V-Kurs | K-Diff | D % | | | Summe |
| Intuitive Surgical | short | 6.10.08 | 13.04.09 | 189 | 21,90 | 12,75 | 37,62 | 15,72 | 71,76 | | | 71,76 |
| Ambu | | 17.01.22 | 14.11.22 | 301 | 147,20 | 98,00 | 221,10 | 73,90 | 50,20 | | | 50,20 |
| Stratec | | 2.10.23 | 11.12.23 | 70 | 43,20 | 39,50 | 47,25 | 4,05 | 9,37 | | | 9,37 |
| Illumina | | 3.10.11 | 24.10.11 | 21 | 38,19 | 28,72 | 50,78 | 12,59 | 32,97 | | | |
| | | 7.11.11 | 5.12.11 | 28 | 32,74 | 29,44 | 36,41 | 3,67 | 11,21 | | | |
| | | 12.12.11 | 19.12.11 | 7 | 26,90 | 26,17 | 27,65 | 0,75 | 2,79 | | | |
| | | 16.01.12 | 23.01.12 | 7 | 36,00 | 36,31 | 35,69 | -0,31 | -0,86 | | | |
| | | 2.01.17 | 13.02.17 | 42 | 128,04 | 163,84 | 92,24 | -35,80 | -27,96 | | | 8,56 |
| Fisher & Paykel HC | | 2.06.08 | 21.07.08 | 49 | 2,40 | 2,29 | 2,52 | 0,12 | 4,80 | | | 4,80 |
| Getinge | | 21.11.16 | 12.12.16 | 21 | 146,00 | 144,00 | 148,03 | 2,03 | 1,39 | | | 1,39 |
| Henry Schein | | 25.02.19 | 1.04.19 | 35 | 59,83 | 60,99 | 58,67 | -1,16 | -1,94 | | | -1,94 |
| Sonova | | 8.08.11 | 15.08.11 | 7 | 63,55 | 63,50 | 63,60 | 0,05 | 0,08 | | | |
| | | 5.09.11 | 12.09.11 | 7 | 62,85 | 66,00 | 59,70 | -3,15 | -5,01 | | | -4,94 |
| Gerresheimer | | 20.04.09 | 27.04.09 | 7 | 15,66 | 17,24 | 14,08 | -1,58 | -10,09 | | | -10,09 |
| Fresenius | | 28.01.19 | 11.02.19 | 14 | 44,68 | 47,26 | 42,10 | -2,58 | -5,77 | | | |
| | | 16.03.20 | 30.03.20 | 14 | 29,61 | 33,89 | 25,34 | -4,28 | -14,44 | | | -19,38 |
| Align Technology | | 24.12.18 | 31.12.18 | 7 | 193,72 | 209,43 | 178,01 | -15,71 | -8,11 | | | |
| | | 7.01.19 | 21.01.19 | 14 | 189,92 | 220,09 | 159,75 | -30,17 | -15,89 | | | |
| | | 21.11.22 | 5.12.22 | 14 | 191,63 | 187,91 | 195,42 | 3,79 | 1,98 | | | -21,18 |
| Drägerwerk | | 17.03.08 | 19.05.08 | 63 | 35,55 | 40,25 | 30,85 | -4,70 | -13,22 | | | |
| | | 8.02.16 | 15.02.16 | 7 | 54,34 | 59,34 | 49,34 | -5,00 | -9,20 | | | -21,21 |
Anmerkungen
| 28.03.24 | Sysmex | | | Aktien-Split 1:3 (drei für eine ) |
| | Terumo | | | Aktien-Split 1:2 (zwei für eine) |
| 20.04.22 | Straumann | | | Aktiensplit 1:10 (zehn für eine) |
| 5.10.21 | Intuitive Surgical | | | Aktiensplit 1:3 (drei für eine) |
| 13.06.16 | Sartorius | | | Aktien-Split 1:4 (vier für eine) |
| 27.08.15 | Med. Ausrüstung | | | vollständige Analyse |
|
|