| | Tue, Jun 23rd, 2026, 11:51UTC |
| | |

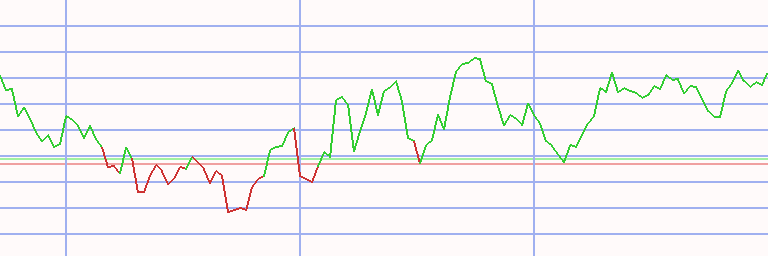
Assessment - United States in Pound sterling - 7/01/24 - RS = 39
⇐
| |
|
instrument |
freshest |
⇓ Δday |
7/01/24 |
⇓ Δwk |
10/02/23 |
prc diff |
⇓ Δ39 |
|
⇓∅-RS |
| |  |
 |
 |
|
|
 |
S&P 500 |
4,227.550 |
8/12/24 |
|
4,330.937 |
-2.39 |
3,535.370 |
795.567 |
22.50 |
|
15.07 |
| | |
|
|
|
L |
|
3M |
97.581 |
8/12/24 |
-0.65 |
79.585 |
22.61 |
74.378 |
5.207 |
7.00 |
|
1.84 |
| | |
|
|
|
|
|
Abbott Labs |
85.273 |
8/12/24 |
-0.84 |
81.634 |
4.46 |
78.920 |
2.714 |
3.44 |
|
-3.09 |
| | |
|
|
|
|
|
AbbVie |
150.437 |
8/12/24 |
0.13 |
134.767 |
11.63 |
122.218 |
12.549 |
10.27 |
|
9.27 |
| | |
|
|
|
|
|
Adobe |
419.979 |
8/12/24 |
-1.00 |
442.982 |
-5.19 |
429.622 |
13.360 |
3.11 |
|
4.23 |
| | |
|
|
|
L |
|
Adtalem |
56.527 |
8/12/24 |
-0.85 |
53.212 |
6.23 |
35.252 |
17.961 |
50.95 |
|
35.20 |
| | |
|
|
|
L |
|
AES |
13.218 |
8/12/24 |
0.30 |
13.795 |
-4.19 |
11.674 |
2.122 |
18.18 |
|
-1.19 |
| | |
|
|
|
|
|
Airbnb |
89.876 |
8/12/24 |
-1.27 |
119.943 |
-25.07 |
112.581 |
7.362 |
6.54 |
|
7.03 |
| | |
|
|
|
|
|
Alaska Air Group |
27.362 |
8/12/24 |
-0.26 |
31.712 |
-13.72 |
30.363 |
1.349 |
4.44 |
|
0.29 |
| | |
|
|
|
L |
|
Alphabet A |
128.376 |
8/12/24 |
-0.84 |
144.750 |
-11.31 |
110.610 |
34.139 |
30.86 |
|
29.57 |
| | |
|
|
|
L |
|
Alphabet C |
129.689 |
8/12/24 |
-0.87 |
145.936 |
-11.13 |
111.435 |
34.502 |
30.96 |
|
29.59 |
| | |
|
|
|
L |
|
Altria |
39.797 |
8/12/24 |
-0.24 |
36.411 |
9.30 |
34.279 |
2.132 |
6.22 |
|
7.41 |
| | |
|
|
|
|
|
Altus Power |
2.326 |
8/12/24 |
-6.96 |
2.951 |
-21.18 |
3.957 |
-1.007 |
-25.44 |
|
-29.33 |
| | |
|
|
|
|
|
Amazon.com |
131.943 |
8/12/24 |
-0.08 |
155.990 |
-15.42 |
106.727 |
49.263 |
46.16 |
|
29.06 |
| | |
|
|
|
|
|
AMD |
108.189 |
8/12/24 |
1.86 |
124.737 |
-13.27 |
85.136 |
39.601 |
46.51 |
|
18.11 |
| | |
|
|
|
L |
|
AEP |
76.840 |
8/12/24 |
-0.40 |
69.041 |
11.30 |
59.225 |
9.815 |
16.57 |
|
6.75 |
| | |
|
|
|
|
|
AIG |
56.645 |
8/12/24 |
-0.62 |
58.924 |
-3.87 |
49.506 |
9.418 |
19.02 |
|
11.39 |
| | |
|
|
|
S |
|
Align Technology |
168.939 |
8/12/24 |
-0.63 |
188.770 |
-10.51 |
247.124 |
-58.353 |
-23.61 |
|
-15.75 |
| | |
|
|
|
S |
|
American Airlines |
7.602 |
8/12/24 |
-2.54 |
8.733 |
-12.95 |
10.511 |
-1.778 |
-16.92 |
|
-21.05 |
| | |
|
|
|
|
|
American Express |
187.513 |
8/12/24 |
-0.34 |
184.950 |
1.39 |
123.232 |
61.718 |
50.08 |
|
26.28 |
| | |
|
|
|
L |
|
American Water |
112.769 |
8/12/24 |
0.20 |
101.061 |
11.58 |
98.722 |
2.339 |
2.37 |
|
-1.16 |
| | |
|
|
|
L |
|
Amgen |
253.128 |
8/12/24 |
-0.77 |
246.017 |
2.89 |
219.547 |
26.470 |
12.06 |
|
13.54 |
| | |
|
|
|
L |
|
Analog Devices |
167.761 |
8/12/24 |
0.36 |
178.123 |
-5.82 |
144.625 |
33.498 |
23.16 |
|
17.87 |
| | |
|
|
|
|
|
Ansys |
247.836 |
8/12/24 |
0.69 |
254.046 |
-2.44 |
245.178 |
8.868 |
3.62 |
|
0.12 |
| | |
|
|
|
L |
|
Apple |
172.072 |
8/12/24 |
0.71 |
171.455 |
0.36 |
143.240 |
28.214 |
19.70 |
|
17.76 |
| |
|
instrument |
freshest |
⇓ Δday |
7/01/24 |
⇓ Δwk |
10/02/23 |
prc diff |
⇓ Δ39 |
|
⇓∅-RS |
| | |
|
|
|
|
|
Applied Materials |
152.739 |
8/12/24 |
1.00 |
187.797 |
-18.67 |
115.013 |
72.785 |
63.28 |
|
43.01 |
| | |
|
|
|
L |
|
Array Tech |
5.561 |
8/12/24 |
-0.99 |
7.570 |
-26.54 |
17.609 |
-10.039 |
-57.01 |
|
-39.62 |
| | |
|
|
|
L |
|
AstraZeneca |
65.275 |
8/12/24 |
1.64 |
61.653 |
5.88 |
55.013 |
6.640 |
12.07 |
|
14.00 |
| | |
|
|
|
L |
|
AT&T |
15.370 |
8/12/24 |
-0.31 |
15.014 |
2.37 |
12.094 |
2.920 |
24.14 |
|
17.94 |
| | |
|
|
|
S |
|
Atlassian |
111.179 |
8/12/24 |
-0.62 |
141.000 |
-21.15 |
162.787 |
-21.787 |
-13.38 |
|
-7.80 |
| | |
|
|
|
|
|
Autodesk |
189.506 |
8/12/24 |
-0.36 |
194.458 |
-2.55 |
172.292 |
22.165 |
12.87 |
|
9.47 |
| | |
|
|
|
|
|
Automatic Data |
204.971 |
8/12/24 |
-1.17 |
186.421 |
9.95 |
197.338 |
-10.917 |
-5.53 |
|
-2.36 |
| | |
|
|
|
|
|
Avis Budget |
65.742 |
8/12/24 |
-4.43 |
80.115 |
-17.94 |
143.339 |
-63.224 |
-44.11 |
|
-34.63 |
| | |
|
|
|
|
|
Baker Hughes |
27.805 |
8/12/24 |
0.23 |
27.638 |
0.60 |
28.491 |
-0.853 |
-2.99 |
|
5.16 |
| | |
|
|
|
L |
|
Bank of America |
30.193 |
8/12/24 |
-0.29 |
31.649 |
-4.60 |
22.012 |
9.637 |
43.78 |
|
24.41 |
| | |
|
|
|
|
|
BNY Mellon |
50.048 |
8/12/24 |
-0.80 |
47.549 |
5.26 |
34.683 |
12.866 |
37.10 |
|
20.24 |
| | |
|
|
|
S |
|
Baxter |
29.213 |
8/12/24 |
-0.59 |
26.151 |
11.71 |
30.792 |
-4.640 |
-15.07 |
|
-15.08 |
| | |
|
|
|
|
|
Berkshire Hathaway |
340.450 |
8/12/24 |
-0.30 |
320.516 |
6.22 |
286.959 |
33.557 |
11.69 |
|
8.23 |
| | |
|
|
|
L |
|
Biogen |
159.028 |
8/12/24 |
-0.48 |
183.336 |
-13.26 |
208.459 |
-25.123 |
-12.05 |
|
-4.24 |
| | |
|
|
|
L |
|
Bloom Energy |
8.812 |
8/12/24 |
-3.05 |
8.994 |
-2.02 |
10.049 |
-1.056 |
-10.50 |
|
-10.36 |
| | |
|
|
|
|
|
Boeing |
129.831 |
8/12/24 |
-2.25 |
147.684 |
-12.09 |
154.848 |
-7.163 |
-4.63 |
|
-8.33 |
| | |
|
|
|
|
|
Booking |
2,720.480 |
8/12/24 |
-0.11 |
3,073.040 |
-11.47 |
2,550.511 |
522.529 |
20.49 |
|
17.70 |
| | |
|
|
|
S |
|
Bristol-Myers |
37.226 |
8/12/24 |
0.73 |
32.669 |
13.95 |
47.692 |
-15.022 |
-31.50 |
|
-21.14 |
| | |
|
|
|
|
|
Broadcom |
117.562 |
8/12/24 |
0.24 |
1,297.915 |
-90.94 |
688.337 |
609.578 |
88.56 |
|
55.20 |
| | |
|
|
|
L |
|
C.H. Robinson |
78.074 |
8/12/24 |
0.20 |
68.669 |
13.70 |
70.610 |
-1.941 |
-2.75 |
|
3.89 |
| | |
|
|
|
|
|
Cadence |
210.919 |
8/12/24 |
-1.29 |
245.946 |
-14.24 |
194.964 |
50.982 |
26.15 |
|
16.34 |
| | |
|
|
|
L |
|
California Water |
41.394 |
8/12/24 |
-0.42 |
38.262 |
8.19 |
38.153 |
0.108 |
0.28 |
|
-1.76 |
| | |
|
|
|
|
|
Capital One |
104.510 |
8/12/24 |
-1.56 |
110.506 |
-5.43 |
78.417 |
32.089 |
40.92 |
|
16.29 |
| | |
|
|
|
|
|
Caterpillar |
265.808 |
8/12/24 |
-0.66 |
260.311 |
2.11 |
224.007 |
36.303 |
16.21 |
|
12.45 |
| | |
|
|
|
|
|
CDW |
167.777 |
8/12/24 |
-0.76 |
173.385 |
-3.23 |
165.689 |
7.696 |
4.64 |
|
0.49 |
| |
|
instrument |
freshest |
⇓ Δday |
7/01/24 |
⇓ Δwk |
10/02/23 |
prc diff |
⇓ Δ39 |
|
⇓∅-RS |
| | |
|
|
|
L |
|
Charter Comm |
277.460 |
8/12/24 |
-3.75 |
234.159 |
18.49 |
361.502 |
-127.342 |
-35.23 |
|
-14.32 |
| | |
|
|
|
|
|
Chevron |
114.715 |
8/12/24 |
0.02 |
123.811 |
-7.35 |
137.296 |
-13.485 |
-9.82 |
|
0.30 |
| | |
|
|
|
|
|
Cintas |
600.887 |
8/12/24 |
0.53 |
549.051 |
9.44 |
399.729 |
149.322 |
37.36 |
|
21.49 |
| | |
|
|
|
S |
|
Cisco Systems |
35.485 |
8/12/24 |
-1.34 |
37.590 |
-5.60 |
44.839 |
-7.250 |
-16.17 |
|
-6.29 |
| | |
|
|
|
|
|
Citigroup |
45.753 |
8/12/24 |
|
50.175 |
-8.81 |
33.388 |
16.786 |
50.28 |
|
27.06 |
| | |
|
|
|
L |
|
Coca-Cola |
53.924 |
8/12/24 |
-0.74 |
50.056 |
7.73 |
45.738 |
4.318 |
9.44 |
|
5.94 |
| | |
|
|
|
S |
|
Cognizant |
57.856 |
8/12/24 |
-1.72 |
53.584 |
7.97 |
55.862 |
-2.278 |
-4.08 |
|
-3.97 |
| | |
|
|
|
L |
|
Colgate-Palmolive |
80.115 |
8/12/24 |
-0.77 |
75.575 |
6.01 |
58.335 |
17.240 |
29.55 |
|
18.18 |
| | |
|
|
|
S |
|
Comcast |
30.478 |
8/12/24 |
-1.41 |
30.193 |
0.94 |
36.678 |
-6.484 |
-17.68 |
|
-10.37 |
| | |
|
|
|
S |
|
ConocoPhilips |
87.037 |
8/12/24 |
2.04 |
90.462 |
-3.79 |
96.538 |
-6.076 |
-6.29 |
|
-2.12 |
| | |
|
|
|
|
|
Consolidated Edison |
80.637 |
8/12/24 |
0.91 |
70.251 |
14.78 |
67.288 |
2.963 |
4.40 |
|
-2.41 |
| | |
|
|
|
|
|
Constellation Energy |
148.183 |
8/12/24 |
-1.16 |
162.200 |
-8.64 |
86.340 |
75.860 |
87.86 |
|
59.40 |
| | |
|
|
|
|
|
Copart |
39.757 |
8/12/24 |
-1.43 |
42.201 |
-5.79 |
35.961 |
6.241 |
17.35 |
|
8.67 |
| | |
|
|
|
S |
|
CoStar |
56.978 |
8/12/24 |
-2.50 |
58.441 |
-2.50 |
62.630 |
-4.189 |
-6.69 |
|
-12.18 |
| | |
|
|
|
L |
|
Costco |
683.106 |
8/12/24 |
1.01 |
668.947 |
2.12 |
470.991 |
197.956 |
42.03 |
|
32.20 |
| | |
|
|
|
|
|
CrowdStrike |
189.324 |
8/12/24 |
-0.65 |
310.201 |
-38.97 |
139.770 |
170.431 |
121.94 |
|
76.48 |
| | |
|
|
|
S |
|
CSX |
26.499 |
8/12/24 |
-1.47 |
26.571 |
-0.27 |
25.177 |
1.393 |
5.53 |
|
0.26 |
| | |
|
|
|
S |
|
CVS Health |
44.147 |
8/12/24 |
-2.28 |
45.998 |
-4.02 |
57.453 |
-11.455 |
-19.94 |
|
-17.23 |
| | |
|
|
|
|
|
Datadog |
88.721 |
8/12/24 |
-0.11 |
103.229 |
-14.05 |
75.713 |
27.516 |
36.34 |
|
18.43 |
| | |
|
|
|
|
|
Deckers Outdoor |
726.399 |
8/12/24 |
3.15 |
748.548 |
-2.96 |
426.671 |
321.877 |
75.44 |
|
39.34 |
| | |
|
|
|
|
|
Delta Air Lines |
30.897 |
8/12/24 |
-0.61 |
37.115 |
-16.75 |
30.050 |
7.065 |
23.51 |
|
11.49 |
| | |
|
|
|
|
|
Devon Energy |
35.857 |
8/12/24 |
0.91 |
37.756 |
-5.03 |
37.634 |
0.122 |
0.32 |
|
0.31 |
| | |
|
|
|
|
|
DexCom |
56.376 |
8/12/24 |
2.16 |
88.729 |
-36.46 |
77.947 |
10.782 |
13.83 |
|
-2.69 |
| | |
|
|
|
|
|
Diamondback Energy |
159.226 |
8/12/24 |
0.76 |
161.140 |
-1.19 |
123.826 |
37.314 |
30.13 |
|
24.16 |
| | |
|
|
|
S |
|
Dollar Tree |
74.277 |
8/12/24 |
-1.21 |
84.838 |
-12.45 |
86.282 |
-1.445 |
-1.67 |
|
-15.50 |
| |
|
instrument |
freshest |
⇓ Δday |
7/01/24 |
⇓ Δwk |
10/02/23 |
prc diff |
⇓ Δ39 |
|
⇓∅-RS |
| | |
|
|
|
|
|
Dominion Resources |
43.285 |
8/12/24 |
0.46 |
37.977 |
13.98 |
34.881 |
3.097 |
8.88 |
|
-0.08 |
| | |
|
|
|
|
|
DoorDash |
98.119 |
8/12/24 |
0.19 |
85.834 |
14.31 |
65.491 |
20.343 |
31.06 |
|
11.21 |
| | |
|
|
|
|
|
Dow |
41.307 |
8/12/24 |
-0.84 |
41.632 |
-0.78 |
42.292 |
-0.660 |
-1.56 |
|
-3.17 |
| | |
|
|
|
L |
|
DuPont |
61.961 |
8/12/24 |
-0.25 |
62.705 |
-1.19 |
60.445 |
2.259 |
3.74 |
|
7.25 |
| | |
|
|
|
L |
|
Duke Energy |
89.679 |
8/12/24 |
0.62 |
78.588 |
14.11 |
70.437 |
8.151 |
11.57 |
|
5.53 |
| | |
|
|
|
L |
|
eBay |
44.147 |
8/12/24 |
-1.26 |
41.671 |
5.94 |
35.903 |
5.768 |
16.07 |
|
15.96 |
| | |
|
|
|
|
|
Edison International |
65.188 |
8/12/24 |
0.52 |
56.313 |
15.76 |
50.322 |
5.991 |
11.91 |
|
3.20 |
| | |
|
|
|
|
|
Electronic Arts |
115.419 |
8/12/24 |
-0.47 |
108.624 |
6.26 |
99.052 |
9.571 |
9.66 |
|
4.33 |
| | |
|
|
|
|
|
Eli Lilly |
699.567 |
8/12/24 |
-0.82 |
723.290 |
-3.28 |
443.769 |
279.521 |
62.99 |
|
47.37 |
| | |
|
|
|
|
|
Emerson Electric |
81.531 |
8/12/24 |
-0.60 |
85.470 |
-4.61 |
78.904 |
6.567 |
8.32 |
|
8.98 |
| | |
|
|
|
|
|
Encompass Health |
68.708 |
8/12/24 |
1.33 |
67.522 |
1.76 |
54.947 |
12.575 |
22.89 |
|
18.94 |
| | |
|
|
|
|
|
Energy Recovery |
13.131 |
8/12/24 |
-0.30 |
10.046 |
30.71 |
17.172 |
-7.126 |
-41.50 |
|
-29.44 |
| | |
|
|
|
L |
|
Enphase Energy |
86.309 |
8/12/24 |
1.16 |
76.935 |
12.18 |
96.323 |
-19.388 |
-20.13 |
|
-17.80 |
| | |
|
|
|
|
|
Exelon |
29.189 |
8/12/24 |
-0.54 |
27.330 |
6.80 |
30.181 |
-2.852 |
-9.45 |
|
-9.46 |
| | |
|
|
|
|
|
Expeditors Wash |
94.219 |
8/12/24 |
0.03 |
95.611 |
-1.46 |
94.584 |
1.027 |
1.09 |
|
0.67 |
| | |
|
|
|
|
|
Exxon Mobil |
94.132 |
8/12/24 |
0.13 |
90.936 |
3.51 |
95.326 |
-4.390 |
-4.60 |
|
5.70 |
| | |
|
|
|
|
|
Fastenal |
51.978 |
8/12/24 |
-1.02 |
49.115 |
5.83 |
45.227 |
3.888 |
8.60 |
|
-1.89 |
| | |
|
|
|
S |
|
FedEx |
220.815 |
8/12/24 |
0.63 |
236.264 |
-6.54 |
218.558 |
17.706 |
8.10 |
|
16.74 |
| | |
|
|
|
L |
|
First Solar |
173.417 |
8/12/24 |
3.51 |
176.169 |
-1.56 |
128.887 |
47.282 |
36.68 |
|
29.56 |
| | |
|
|
|
|
|
FirstEnergy |
33.381 |
8/12/24 |
0.55 |
30.304 |
10.15 |
26.876 |
3.429 |
12.76 |
|
2.19 |
| | |
|
|
|
|
|
Fiserv |
127.434 |
8/12/24 |
-0.30 |
116.392 |
9.49 |
93.034 |
23.357 |
25.11 |
|
9.70 |
| | |
|
|
|
S |
|
Ford Motor |
7.800 |
8/12/24 |
-2.38 |
10.093 |
-22.73 |
10.148 |
-0.055 |
-0.54 |
|
4.98 |
| | |
|
|
|
S |
|
Fortinet |
55.657 |
8/12/24 |
0.96 |
47.343 |
17.56 |
48.335 |
-0.992 |
-2.05 |
|
-3.91 |
| | |
|
|
|
L |
|
Fox A |
30.716 |
8/12/24 |
-1.27 |
26.990 |
13.80 |
25.433 |
1.557 |
6.12 |
|
7.99 |
| | |
|
|
|
|
|
Freeport-McMoRan |
32.875 |
8/12/24 |
1.24 |
38.294 |
-14.15 |
30.206 |
8.087 |
26.77 |
|
17.22 |
| |
|
instrument |
freshest |
⇓ Δday |
7/01/24 |
⇓ Δwk |
10/02/23 |
prc diff |
⇓ Δ39 |
|
⇓∅-RS |
| | |
|
|
|
|
|
FuelCell Energy |
0.349 |
8/12/24 |
-1.61 |
0.483 |
-27.76 |
0.989 |
-0.506 |
-51.18 |
|
-50.21 |
| | |
|
|
|
|
|
GE HealthCare |
65.157 |
8/12/24 |
-1.24 |
60.324 |
8.01 |
55.928 |
4.396 |
7.86 |
|
-0.38 |
| | |
|
|
|
|
|
General Dynamics |
230.347 |
8/12/24 |
-0.61 |
227.713 |
1.16 |
183.785 |
43.928 |
23.90 |
|
13.97 |
| | |
|
|
|
|
|
General Electric |
131.998 |
8/12/24 |
-0.16 |
125.749 |
4.97 |
89.687 |
36.062 |
40.21 |
|
22.39 |
| | |
|
|
|
L |
|
General Motors |
34.006 |
8/12/24 |
-1.13 |
36.925 |
-7.90 |
26.768 |
10.157 |
37.94 |
|
27.33 |
| | |
|
|
|
S |
|
Gilead Sciences |
57.737 |
8/12/24 |
-0.91 |
54.296 |
6.34 |
61.088 |
-6.792 |
-11.12 |
|
-8.03 |
| | |
|
|
|
|
|
GlobalFoundries |
34.196 |
8/12/24 |
-1.05 |
39.757 |
-13.99 |
47.791 |
-8.034 |
-16.81 |
|
-8.70 |
| | |
|
|
|
L |
|
Goldman Sachs |
384.043 |
8/12/24 |
-0.97 |
366.767 |
4.71 |
262.573 |
104.194 |
39.68 |
|
26.59 |
| | |
|
|
|
L |
|
Hannon Armstrong SIC |
23.897 |
8/12/24 |
-1.63 |
22.726 |
5.15 |
16.224 |
6.502 |
40.07 |
|
18.03 |
| | |
|
|
|
S |
|
Halliburton |
24.822 |
8/12/24 |
1.23 |
26.444 |
-6.13 |
32.787 |
-6.343 |
-19.35 |
|
-10.88 |
| | |
|
|
|
L |
|
HP |
26.721 |
8/12/24 |
0.72 |
27.662 |
-3.40 |
21.162 |
6.500 |
30.71 |
|
17.46 |
| | |
|
|
|
|
|
Home Depot |
273.545 |
8/12/24 |
-0.81 |
265.935 |
2.86 |
247.181 |
18.754 |
7.59 |
|
1.14 |
| | |
|
|
|
L |
|
Honeywell |
155.666 |
8/12/24 |
-0.73 |
166.867 |
-6.71 |
150.545 |
16.322 |
10.84 |
|
6.94 |
| | |
|
|
|
|
|
IBM |
149.884 |
8/12/24 |
-1.03 |
138.509 |
8.21 |
116.076 |
22.432 |
19.33 |
|
9.62 |
| | |
|
|
|
|
|
IDEXX Labs |
379.637 |
8/12/24 |
-0.60 |
376.845 |
0.74 |
355.277 |
21.567 |
6.07 |
|
-5.43 |
| | |
|
|
|
S |
|
Illumina |
98.514 |
8/12/24 |
0.79 |
83.453 |
18.05 |
112.482 |
-29.029 |
-25.81 |
|
-20.62 |
| | |
|
|
|
S |
|
Intel |
15.314 |
8/12/24 |
-1.78 |
24.395 |
-37.22 |
29.233 |
-4.838 |
-16.55 |
|
-18.28 |
| | |
|
|
|
|
|
Interface |
12.902 |
8/12/24 |
-0.79 |
11.525 |
11.94 |
7.947 |
3.578 |
45.02 |
|
25.11 |
| | |
|
|
|
|
|
Intuit |
496.297 |
8/12/24 |
-0.44 |
514.776 |
-3.59 |
426.877 |
87.899 |
20.59 |
|
14.31 |
| | |
|
|
|
|
|
Intuitive Surgical |
368.246 |
8/12/24 |
0.46 |
345.077 |
6.71 |
243.183 |
101.894 |
41.90 |
|
28.52 |
| | |
|
|
|
S |
|
J.B. Hunt |
128.755 |
8/12/24 |
-0.20 |
125.520 |
2.58 |
154.510 |
-28.990 |
-18.76 |
|
-15.06 |
| | |
|
|
|
|
|
JP Morgan Chase |
163.102 |
8/12/24 |
0.19 |
162.516 |
0.36 |
118.525 |
43.992 |
37.12 |
|
23.75 |
| | |
|
|
|
S |
|
Johnson & Johnson |
126.469 |
8/12/24 |
-0.46 |
115.838 |
9.18 |
127.906 |
-12.069 |
-9.44 |
|
-6.86 |
| | |
|
|
|
|
|
Kadant |
229.635 |
8/12/24 |
-1.48 |
229.666 |
-0.01 |
185.928 |
43.738 |
23.52 |
|
12.66 |
| | |
|
|
|
|
|
Keurig Dr Pepper |
27.528 |
8/12/24 |
0.69 |
25.977 |
5.97 |
25.730 |
0.248 |
0.96 |
|
2.55 |
| |
|
instrument |
freshest |
⇓ Δday |
7/01/24 |
⇓ Δwk |
10/02/23 |
prc diff |
⇓ Δ39 |
|
⇓∅-RS |
| | |
|
|
|
L |
|
Kirby |
92.162 |
8/12/24 |
-0.14 |
95.754 |
-3.75 |
67.057 |
28.697 |
42.79 |
|
40.62 |
| | |
|
|
|
|
|
KLA-Tencor |
599.234 |
8/12/24 |
1.44 |
654.803 |
-8.49 |
379.746 |
275.058 |
72.43 |
|
44.58 |
| | |
|
|
|
S |
|
Kraft Heinz |
27.029 |
8/12/24 |
-3.12 |
25.202 |
7.25 |
27.280 |
-2.077 |
-7.62 |
|
-9.64 |
| | |
|
|
|
|
|
Lam Research |
641.435 |
8/12/24 |
0.37 |
838.986 |
-23.55 |
520.101 |
318.885 |
61.31 |
|
38.32 |
| | |
|
|
|
|
|
Landstar System |
146.427 |
8/12/24 |
-1.04 |
145.074 |
0.93 |
143.710 |
1.364 |
0.95 |
|
-1.29 |
| | |
|
|
|
|
|
Lockheed Martin |
440.530 |
8/12/24 |
0.97 |
368.966 |
19.40 |
336.209 |
32.757 |
9.74 |
|
3.89 |
| | |
|
|
|
|
|
Lowe´s |
182.782 |
8/12/24 |
-2.02 |
168.931 |
8.20 |
169.613 |
-0.682 |
-0.40 |
|
-3.37 |
| | |
|
|
|
L |
|
LTC Properties |
28.398 |
8/12/24 |
-0.22 |
27.243 |
4.24 |
25.969 |
1.274 |
4.91 |
|
5.21 |
| | |
|
|
|
|
|
Marriott |
169.817 |
8/12/24 |
-1.51 |
189.459 |
-10.37 |
159.728 |
29.730 |
18.61 |
|
9.96 |
| | |
|
|
|
|
|
Marsh & McLennan |
171.929 |
8/12/24 |
-1.23 |
166.313 |
3.38 |
155.623 |
10.690 |
6.87 |
|
6.59 |
| | |
|
|
|
|
|
Marvell Tech |
47.865 |
8/12/24 |
-0.08 |
56.163 |
-14.77 |
45.004 |
11.159 |
24.79 |
|
14.45 |
| | |
|
|
|
|
|
Mastercard |
360.462 |
8/12/24 |
-0.24 |
346.161 |
4.13 |
326.341 |
19.820 |
6.07 |
|
2.59 |
| | |
|
|
|
|
|
Matson |
102.936 |
8/12/24 |
0.73 |
102.106 |
0.81 |
72.440 |
29.665 |
40.95 |
|
28.80 |
| | |
|
|
|
S |
|
McDonald´s |
213.150 |
8/12/24 |
0.58 |
197.749 |
7.79 |
212.490 |
-14.742 |
-6.94 |
|
-10.58 |
| | |
|
|
|
S |
|
Medtronic |
64.223 |
8/12/24 |
-1.04 |
61.004 |
5.28 |
64.114 |
-3.110 |
-4.85 |
|
-6.07 |
| | |
|
|
|
|
|
Merck (MSD) |
89.766 |
8/12/24 |
-0.93 |
101.172 |
-11.27 |
84.543 |
16.629 |
19.67 |
|
11.17 |
| | |
|
|
|
|
|
Meta Platforms |
408.130 |
8/12/24 |
-0.35 |
399.215 |
2.23 |
252.944 |
146.271 |
57.83 |
|
37.24 |
| | |
|
|
|
|
|
MetLife |
55.253 |
8/12/24 |
-0.40 |
55.277 |
-0.04 |
50.858 |
4.419 |
8.69 |
|
5.87 |
| | |
|
|
|
L |
|
Micron Technology |
74.863 |
8/12/24 |
1.68 |
104.036 |
-28.04 |
56.027 |
48.009 |
85.69 |
|
58.05 |
| | |
|
|
|
|
|
Microsoft |
321.797 |
8/12/24 |
0.19 |
361.285 |
-10.93 |
265.293 |
95.992 |
36.18 |
|
22.44 |
| | |
|
|
|
|
|
MillerKnoll |
21.468 |
8/12/24 |
-3.49 |
20.931 |
2.57 |
19.472 |
1.458 |
7.49 |
|
12.67 |
| | |
|
|
|
L |
|
Moderna |
64.302 |
8/12/24 |
-4.29 |
91.719 |
-29.89 |
85.169 |
6.550 |
7.69 |
|
13.02 |
| | |
|
|
|
S |
|
Molina Healthcare |
267.106 |
8/12/24 |
-0.15 |
231.106 |
15.58 |
274.082 |
-42.976 |
-15.68 |
|
-15.71 |
| | |
|
|
|
S |
|
Mondelez |
54.802 |
8/12/24 |
-0.63 |
51.607 |
6.19 |
56.463 |
-4.857 |
-8.60 |
|
-7.90 |
| | |
|
|
|
S |
|
MongoDB |
183.811 |
8/12/24 |
-1.08 |
208.443 |
-11.82 |
287.779 |
-79.336 |
-27.57 |
|
-28.62 |
| |
|
instrument |
freshest |
⇓ Δday |
7/01/24 |
⇓ Δwk |
10/02/23 |
prc diff |
⇓ Δ39 |
|
⇓∅-RS |
| | |
|
|
|
S |
|
Monster Beverage |
36.300 |
8/12/24 |
-0.37 |
39.472 |
-8.04 |
43.314 |
-3.842 |
-8.87 |
|
-10.15 |
| | |
|
|
|
L |
|
Morgan Stanley |
75.021 |
8/12/24 |
0.13 |
78.438 |
-4.36 |
66.290 |
12.148 |
18.32 |
|
13.97 |
| | |
|
|
|
|
|
Netflix |
500.830 |
8/12/24 |
-0.13 |
532.843 |
-6.01 |
313.546 |
219.297 |
69.94 |
|
36.70 |
| | |
|
|
|
L |
|
NextEra Energy |
61.368 |
8/12/24 |
0.15 |
55.293 |
10.99 |
42.993 |
12.300 |
28.61 |
|
10.32 |
| | |
|
|
|
|
|
Nike |
59.042 |
8/12/24 |
0.40 |
60.775 |
-2.85 |
77.956 |
-17.181 |
-22.04 |
|
-24.43 |
| | |
|
|
|
|
|
Norfolk Southern |
187.615 |
8/12/24 |
-1.02 |
169.327 |
10.80 |
157.874 |
11.453 |
7.25 |
|
-5.23 |
| | |
|
|
|
L |
|
NVidia |
86.238 |
8/12/24 |
4.08 |
98.324 |
-12.29 |
36.919 |
61.406 |
166.33 |
|
116.72 |
| | |
|
|
|
|
|
O'Reilly |
886.795 |
8/12/24 |
-0.30 |
803.935 |
10.31 |
740.827 |
63.108 |
8.52 |
|
2.69 |
| | |
|
|
|
S |
|
Old Dominion FL |
150.785 |
8/12/24 |
-1.35 |
141.356 |
6.67 |
166.196 |
-24.840 |
-14.95 |
|
-10.29 |
| | |
|
|
|
|
|
ON Semiconductor |
55.664 |
8/12/24 |
-1.30 |
54.723 |
1.72 |
76.975 |
-22.252 |
-28.91 |
|
-13.63 |
| | |
|
|
|
L |
|
Oracle |
104.874 |
8/12/24 |
0.39 |
113.188 |
-7.35 |
87.972 |
25.216 |
28.66 |
|
23.56 |
| | |
|
|
|
L |
|
Ormat Technologies |
56.724 |
8/12/24 |
-1.10 |
54.739 |
3.63 |
56.208 |
-1.469 |
-2.61 |
|
-1.65 |
| | |
|
|
|
|
|
Paccar |
72.909 |
8/12/24 |
-0.74 |
80.558 |
-9.50 |
69.877 |
10.681 |
15.29 |
|
5.51 |
| | |
|
|
|
|
|
Palo Alto Networks |
261.909 |
8/12/24 |
-0.11 |
269.661 |
-2.87 |
195.194 |
74.466 |
38.15 |
|
23.87 |
| | |
|
|
|
|
|
Paychex |
97.889 |
8/12/24 |
-0.57 |
92.550 |
5.77 |
93.801 |
-1.251 |
-1.33 |
|
-3.05 |
| | |
|
|
|
|
|
PayPal |
50.198 |
8/12/24 |
-1.95 |
45.729 |
9.77 |
48.277 |
-2.548 |
-5.28 |
|
-6.98 |
| | |
|
|
|
|
|
PepsiCo |
135.598 |
8/12/24 |
-0.56 |
128.850 |
5.24 |
139.465 |
-10.614 |
-7.61 |
|
-5.85 |
| | |
|
|
|
L |
|
Pfizer |
22.505 |
8/12/24 |
-0.35 |
22.323 |
0.82 |
27.980 |
-5.658 |
-20.22 |
|
-6.74 |
| | |
|
|
|
L |
|
Philip Morris |
91.830 |
8/12/24 |
0.07 |
80.091 |
14.66 |
75.359 |
4.732 |
6.28 |
|
6.82 |
| | |
|
|
|
L |
|
Plug Power |
1.543 |
8/12/24 |
-1.02 |
1.804 |
-14.47 |
5.627 |
-3.823 |
-67.95 |
|
-48.44 |
| | |
|
|
|
S |
|
Potlatch |
32.321 |
8/12/24 |
-1.99 |
29.885 |
8.15 |
37.428 |
-7.543 |
-20.15 |
|
-18.34 |
| | |
|
|
|
L |
|
Procter & Gamble |
131.951 |
8/12/24 |
-2.19 |
128.716 |
2.51 |
119.695 |
9.020 |
7.54 |
|
4.93 |
| | |
|
|
|
L |
|
PSEG |
63.685 |
8/12/24 |
0.81 |
58.243 |
9.34 |
45.087 |
13.157 |
29.18 |
|
16.12 |
| | |
|
|
|
L |
|
Qualcomm |
128.850 |
8/12/24 |
-0.97 |
158.229 |
-18.57 |
91.591 |
66.637 |
72.76 |
|
43.94 |
| | |
|
|
|
L |
|
Raytheon Tech |
92.234 |
8/12/24 |
0.39 |
78.747 |
17.13 |
58.813 |
19.934 |
33.89 |
|
12.07 |
| |
|
instrument |
freshest |
⇓ Δday |
7/01/24 |
⇓ Δwk |
10/02/23 |
prc diff |
⇓ Δ39 |
|
⇓∅-RS |
| | |
|
|
|
|
|
Regeneron |
886.811 |
8/12/24 |
-0.90 |
836.130 |
6.06 |
674.388 |
161.742 |
23.98 |
|
21.65 |
| | |
|
|
|
|
|
Roper Technologies |
411.389 |
8/12/24 |
-1.27 |
445.055 |
-7.56 |
398.913 |
46.142 |
11.57 |
|
8.07 |
| | |
|
|
|
|
|
Ross Stores |
111.274 |
8/12/24 |
0.74 |
114.889 |
-3.15 |
94.370 |
20.519 |
21.74 |
|
12.88 |
| | |
|
|
|
|
|
Ryder System |
104.289 |
8/12/24 |
-1.29 |
97.051 |
7.46 |
87.164 |
9.887 |
11.34 |
|
13.95 |
| | |
|
|
|
S |
|
salesforce.com |
198.793 |
8/12/24 |
-0.48 |
202.669 |
-1.91 |
167.940 |
34.729 |
20.68 |
|
4.56 |
| | |
|
|
|
S |
|
Shoals Technologies |
4.058 |
8/12/24 |
0.20 |
4.833 |
-16.04 |
14.130 |
-9.297 |
-65.80 |
|
-54.01 |
| | |
|
|
|
|
|
Simon Property |
121.106 |
8/12/24 |
-3.51 |
115.901 |
4.49 |
86.257 |
29.644 |
34.37 |
|
12.33 |
| | |
|
|
|
S |
|
Sirius XM |
2.357 |
8/12/24 |
-5.10 |
2.278 |
3.47 |
3.553 |
-1.275 |
-35.88 |
|
-30.71 |
| | |
|
|
|
L |
|
Southern |
68.977 |
8/12/24 |
0.46 |
60.909 |
13.25 |
51.698 |
9.211 |
17.82 |
|
9.10 |
| | |
|
|
|
|
|
Southwest Airlines |
20.076 |
8/12/24 |
0.20 |
22.236 |
-9.71 |
22.416 |
-0.180 |
-0.80 |
|
-4.29 |
| | |
|
|
|
L |
|
Sprouts |
76.081 |
8/12/24 |
-0.10 |
66.106 |
15.09 |
34.625 |
31.481 |
90.92 |
|
70.56 |
| | |
|
|
|
|
|
Starbucks |
60.933 |
8/12/24 |
2.58 |
61.012 |
-0.13 |
75.128 |
-14.116 |
-18.79 |
|
-17.05 |
| | |
|
|
|
|
|
Steelcase |
9.722 |
8/12/24 |
-1.76 |
10.252 |
-5.17 |
8.961 |
1.290 |
14.40 |
|
17.26 |
| | |
|
|
|
L |
|
Sunnova Energy |
5.237 |
8/12/24 |
-4.47 |
4.137 |
26.58 |
7.980 |
-3.843 |
-48.16 |
|
-35.71 |
| | |
|
|
|
L |
|
SunPower |
0.158 |
8/12/24 |
-4.76 |
2.144 |
-92.62 |
4.633 |
-2.489 |
-53.73 |
|
-32.66 |
| | |
|
|
|
L |
|
Sunrun |
13.708 |
8/12/24 |
-3.13 |
8.634 |
58.77 |
9.266 |
-0.632 |
-6.82 |
|
-17.65 |
| | |
|
|
|
|
|
Synopsys |
411.998 |
8/12/24 |
-0.74 |
476.000 |
-13.45 |
382.375 |
93.624 |
24.48 |
|
17.61 |
| | |
|
|
|
L |
|
T-Mobile US |
154.210 |
8/12/24 |
0.39 |
141.657 |
8.86 |
114.807 |
26.850 |
23.39 |
|
17.27 |
| | |
|
|
|
L |
|
Take-Two Interactive |
116.510 |
8/12/24 |
1.71 |
122.047 |
-4.54 |
114.592 |
7.455 |
6.51 |
|
3.09 |
| | |
|
|
|
|
|
Target |
106.804 |
8/12/24 |
-0.35 |
115.284 |
-7.36 |
87.956 |
27.328 |
31.07 |
|
6.31 |
| | |
|
|
|
|
|
Tesla Motors |
156.220 |
8/12/24 |
-1.26 |
166.005 |
-5.89 |
207.420 |
-41.416 |
-19.97 |
|
-1.30 |
| | |
|
|
|
L |
|
Texas Instruments |
151.924 |
8/12/24 |
-0.08 |
153.934 |
-1.31 |
131.864 |
22.070 |
16.74 |
|
15.25 |
| | |
|
|
|
L |
|
The Trade Desk |
76.761 |
8/12/24 |
-2.28 |
77.497 |
-0.95 |
64.559 |
12.938 |
20.04 |
|
24.07 |
| | |
|
|
|
|
|
Thermo Fisher |
473.880 |
8/12/24 |
0.48 |
428.514 |
10.59 |
408.732 |
19.783 |
4.84 |
|
1.22 |
| | |
|
|
|
|
|
Travelers Companies |
165.902 |
8/12/24 |
-1.29 |
160.554 |
3.33 |
133.776 |
26.778 |
20.02 |
|
7.33 |
| |
|
instrument |
freshest |
⇓ Δday |
7/01/24 |
⇓ Δwk |
10/02/23 |
prc diff |
⇓ Δ39 |
|
⇓∅-RS |
| | |
|
|
|
|
|
U.S. Bancorp |
32.804 |
8/12/24 |
-1.43 |
31.040 |
5.68 |
26.496 |
4.543 |
17.15 |
|
1.73 |
| | |
|
|
|
|
|
Uber Technologies |
54.786 |
8/12/24 |
1.05 |
56.242 |
-2.59 |
37.659 |
18.583 |
49.35 |
|
25.53 |
| | |
|
|
|
S |
|
Union Pacific |
187.275 |
8/12/24 |
-0.32 |
177.870 |
5.29 |
167.057 |
10.813 |
6.47 |
|
-1.66 |
| | |
|
|
|
|
|
United Airlines |
31.973 |
8/12/24 |
-2.51 |
38.230 |
-16.37 |
34.312 |
3.919 |
11.42 |
|
6.73 |
| | |
|
|
|
L |
|
United Natural Foods |
9.745 |
8/12/24 |
-1.28 |
10.117 |
-3.67 |
10.857 |
-0.740 |
-6.82 |
|
-12.37 |
| | |
|
|
|
S |
|
UnitedHealth |
447.159 |
8/12/24 |
1.17 |
391.281 |
14.28 |
424.214 |
-32.933 |
-7.76 |
|
-2.37 |
| | |
|
|
|
S |
|
UPS |
98.767 |
8/12/24 |
-0.76 |
107.540 |
-8.16 |
127.849 |
-20.309 |
-15.89 |
|
-12.57 |
| | |
|
|
|
L |
|
Verisk Analytics |
207.533 |
8/12/24 |
-0.67 |
212.082 |
-2.14 |
194.848 |
17.234 |
8.84 |
|
12.29 |
| | |
|
|
|
|
|
Verizon |
32.060 |
8/12/24 |
-0.54 |
33.017 |
-2.90 |
26.183 |
6.834 |
26.10 |
|
12.51 |
| | |
|
|
|
L |
|
Vertex |
367.439 |
8/12/24 |
-0.84 |
372.771 |
-1.43 |
286.753 |
86.018 |
30.00 |
|
21.28 |
| | |
|
|
|
|
|
Visa |
205.580 |
8/12/24 |
0.05 |
208.230 |
-1.27 |
190.660 |
17.569 |
9.22 |
|
2.09 |
| | |
|
|
|
L |
|
Walmart |
54.343 |
8/12/24 |
1.10 |
53.378 |
1.81 |
43.996 |
9.383 |
21.33 |
|
20.49 |
| | |
|
|
|
S |
|
Walgreens Boots |
8.068 |
8/12/24 |
-4.49 |
9.160 |
-11.92 |
18.483 |
-9.323 |
-50.44 |
|
-46.87 |
| | |
|
|
|
|
|
Walt Disney |
67.989 |
8/12/24 |
-0.30 |
77.552 |
-12.33 |
67.329 |
10.223 |
15.18 |
|
2.83 |
| | |
|
|
|
|
|
Warner Bros. Disc |
5.308 |
8/12/24 |
-4.55 |
5.616 |
-5.49 |
8.664 |
-3.048 |
-35.18 |
|
-29.84 |
| | |
|
|
|
|
|
Wells Fargo |
41.181 |
8/12/24 |
-1.33 |
47.928 |
-14.08 |
32.655 |
15.274 |
46.77 |
|
25.84 |
| | |
|
|
|
S |
|
Workday |
166.566 |
8/12/24 |
-0.65 |
177.759 |
-6.30 |
176.142 |
1.617 |
0.92 |
|
-9.03 |
| | |
|
|
|
L |
|
Xcel Energy |
45.895 |
8/12/24 |
0.10 |
41.473 |
10.66 |
45.367 |
-3.894 |
-8.58 |
|
-9.81 |
| | |
|
|
|
S |
|
Xerox |
7.681 |
8/12/24 |
-2.51 |
9.136 |
-15.93 |
12.787 |
-3.650 |
-28.55 |
|
-25.87 |
| | |
|
|
|
|
|
Zscaler |
136.491 |
8/12/24 |
-1.04 |
157.114 |
-13.13 |
132.639 |
24.475 |
18.45 |
|
10.53 |
| USA - 219 out of 219 instruments rated - 7/01/24 / 10/02/23 - 148 did rise, Market-Ratio(39) in GBP = 67.58 % |
| Stock Exchange Currency: USD $ Dollar |
Technical Chart
Transactions United States in Pound sterling * A39 - 38/36 (1)
|
⇐ |
| |
| L/S | date buy | date sell | days | | instrument | spl | pieces | | prc buy | prc sell | ps short | prc diff | d % | asset | yield | |
| 1/02/06 |
2/25/08 |
784 |
|
- cash - |
| short |
2/25/08 |
3/17/08 |
21 |
|
|
|
Citigroup |
100 |
79 |
|
125.794 |
92.191 |
171.645 |
45.851 |
36 |
13,622 |
22,078 |
|
| long |
3/17/08 |
4/07/08 |
21 |
|
|
|
First Solar |
100 |
142 |
|
95.885 |
134.602 |
|
38.717 |
40 |
19,120 |
36,228 |
|
| short |
4/07/08 |
4/14/08 |
7 |
|
|
|
Citigroup |
100 |
154 |
|
123.414 |
114.395 |
133.145 |
9.731 |
8 |
20,619 |
5,131 |
|
| long |
4/14/08 |
6/16/08 |
63 |
|
|
|
First Solar |
100 |
141 |
|
145.237 |
137.728 |
|
-7.509 |
-5 |
19,560 |
-26 |
|
| short |
6/16/08 |
8/04/08 |
49 |
|
|
|
Delta Air Lines |
100 |
6,851 |
|
2.855 |
4.111 |
1.599 |
-1.256 |
-44 |
10,954 |
-99 |
|
| long |
8/04/08 |
9/01/08 |
28 |
|
|
|
First Solar |
100 |
83 |
|
130.559 |
129.625 |
|
-0.934 |
-1 |
10,877 |
-9 |
|
| short |
9/01/08 |
7/06/09 |
308 |
|
|
|
AIG |
100 |
45 |
|
241.223 |
9.913 |
5,870.090 |
5,628.867 |
2,333 |
264,176 |
4,293 |
|
| long |
7/06/09 |
11/21/11 |
868 |
|
|
|
Avis Budget |
100 |
80,049 |
|
3.300 |
7.885 |
|
4.585 |
139 |
631,163 |
44 |
|
| short |
11/21/11 |
11/28/11 |
7 |
|
|
|
Netflix |
100 |
93,754 |
|
6.732 |
6.468 |
7.007 |
0.275 |
4 |
656,906 |
704 |
|
| long |
11/28/11 |
8/24/15 |
1365 |
|
|
|
Alexion |
100 |
15,041 |
|
43.673 |
105.847 |
|
62.174 |
142 |
1,592,065 |
27 |
|
| short |
8/24/15 |
9/14/15 |
21 |
|
|
|
Keurig Dr Pepper |
100 |
48,961 |
|
32.517 |
38.476 |
26.557 |
-5.960 |
-18 |
1,300,282 |
-97 |
|
| long |
9/14/15 |
9/21/15 |
7 |
|
|
|
JetBlue Airways |
100 |
76,190 |
|
17.066 |
17.303 |
|
0.237 |
1 |
1,318,342 |
105 |
|
| short |
9/21/15 |
10/05/15 |
14 |
|
|
|
Wynn Resorts |
100 |
30,723 |
|
42.910 |
42.830 |
42.990 |
0.080 |
0 |
1,320,797 |
5 |
|
| long |
10/05/15 |
12/14/15 |
70 |
|
|
|
Netflix |
100 |
17,986 |
|
73.431 |
79.718 |
|
6.287 |
9 |
1,433,883 |
53 |
|
| short |
12/14/15 |
12/28/15 |
14 |
|
|
|
SunEdison |
100 |
494,413 |
|
2.900 |
3.690 |
2.110 |
-0.790 |
-27 |
1,043,360 |
-100 |
|
| long |
12/28/15 |
1/11/16 |
14 |
|
|
|
Energy Recovery |
100 |
218,634 |
|
4.772 |
4.256 |
|
-0.516 |
-11 |
930,604 |
-95 |
|
| short |
1/11/16 |
3/07/16 |
56 |
|
|
|
SunEdison |
100 |
405,193 |
|
2.297 |
1.304 |
4.046 |
1.750 |
76 |
1,639,533 |
3,910 |
|
| long |
3/07/16 |
10/29/18 |
966 |
|
|
|
Energy Recovery |
100 |
272,961 |
|
6.006 |
5.505 |
|
-0.501 |
-8 |
1,502,766 |
-3 |
|
| short |
10/29/18 |
11/05/18 |
7 |
|
|
|
Western Digital |
100 |
46,314 |
|
32.447 |
37.136 |
27.758 |
-4.689 |
-14 |
1,285,606 |
-100 |
|
| long |
11/05/18 |
12/24/18 |
49 |
|
|
|
Enphase Energy |
100 |
310,608 |
|
4.139 |
3.647 |
|
-0.492 |
-12 |
1,132,714 |
-61 |
|
| short |
12/24/18 |
12/31/18 |
7 |
|
|
|
United Natural Foods |
100 |
148,426 |
|
7.631 |
8.296 |
6.967 |
-0.665 |
-9 |
1,034,046 |
-99 |
|
| long |
12/31/18 |
3/16/20 |
441 |
|
|
|
Eli Lilly |
100 |
11,406 |
|
90.656 |
105.762 |
|
15.106 |
17 |
1,206,350 |
14 |
|
| short |
3/16/20 |
5/04/20 |
49 |
|
|
|
Occidental Pet |
100 |
122,774 |
|
9.826 |
12.474 |
7.178 |
-2.648 |
-27 |
881,236 |
-90 |
|
| long |
5/04/20 |
5/09/22 |
735 |
|
|
|
Tesla Motors |
100 |
21,606 |
|
40.786 |
212.374 |
|
171.588 |
421 |
4,588,566 |
127 |
|
| short |
5/09/22 |
5/30/22 |
21 |
|
|
|
Netflix |
100 |
32,748 |
|
140.115 |
154.140 |
126.090 |
-14.025 |
-10 |
4,129,263 |
-84 |
|
| L/S | date buy | date sell | days | | instrument | spl | pieces | | prc buy | prc sell | ps short | prc diff | d % | asset | yield | | | long |
5/30/22 |
6/13/22 |
14 |
|
|
|
Occidental Pet |
100 |
73,792 |
|
55.958 |
49.134 |
|
-6.824 |
-12 |
3,625,731 |
-97 |
|
| short |
6/13/22 |
8/15/22 |
63 |
|
|
|
Beyond Meat |
100 |
198,249 |
|
18.289 |
29.534 |
7.043 |
-11.245 |
-61 |
1,396,338 |
-100 |
|
| long |
8/15/22 |
8/22/22 |
7 |
|
|
|
Array Tech |
100 |
73,641 |
|
18.961 |
17.412 |
|
-1.549 |
-8 |
1,282,260 |
-99 |
|
| short |
8/22/22 |
11/14/22 |
84 |
|
|
|
Gaia |
100 |
464,505 |
|
2.760 |
2.397 |
3.179 |
0.418 |
15 |
1,476,431 |
85 |
|
| long |
11/14/22 |
12/19/22 |
35 |
|
|
|
First Solar |
100 |
11,304 |
|
130.608 |
128.675 |
|
-1.933 |
-1 |
1,454,576 |
-14 |
|
| short |
12/19/22 |
1/16/23 |
28 |
|
|
|
Tesla Motors |
100 |
11,824 |
|
123.011 |
100.350 |
150.790 |
27.779 |
23 |
1,783,032 |
1,321 |
|
| long |
1/16/23 |
5/15/23 |
119 |
|
|
|
First Solar |
100 |
12,069 |
|
147.729 |
176.773 |
|
29.043 |
20 |
2,133,557 |
73 |
|
| short |
5/15/23 |
5/22/23 |
7 |
|
|
|
Plug Power |
100 |
340,698 |
|
6.262 |
7.106 |
5.419 |
-0.844 |
-13 |
1,846,175 |
-100 |
|
| long |
5/22/23 |
8/12/24 |
448 |
|
|
|
NVidia |
100 |
73,586 |
|
25.089 |
86.238 |
|
61.149 |
244 |
6,345,888 |
173 |
|
| accum | 2/25/08 |
8/12/24 | 6693 |
days out of 7477 invested (90%) |
63,359 |
6,345,888 |
42 |
|
Instrument Related Contribution
| instrument | L/S | date buy | date sell | days | prc buy | prc sell | ps short | prc diff | d % | | | total |
| AIG | short | 9/01/08 | 7/06/09 | 308 | 241.22 | 9.91 | 5,870.09 | 5,628.87 | 2,333.47 | | | 2,333.47 |
| Tesla Motors | long | 5/04/20 | 5/09/22 | 735 | 40.79 | 212.37 | | 171.59 | 420.70 | | | |
| | short | 12/19/22 | 1/16/23 | 28 | 123.01 | 100.35 | 150.79 | 27.78 | 22.58 | | | 538.29 |
| NVidia | long | 5/22/23 | 8/12/24 | 448 | 25.09 | 86.24 | | 61.15 | 243.73 | | | 243.73 |
| Alexion | long | 11/28/11 | 8/24/15 | 1365 | 43.67 | 105.85 | | 62.17 | 142.36 | | | 142.36 |
| Avis Budget | long | 7/06/09 | 11/21/11 | 868 | 3.30 | 7.88 | | 4.58 | 138.92 | | | 138.92 |
| First Solar | long | 3/17/08 | 4/07/08 | 21 | 95.88 | 134.60 | | 38.72 | 40.38 | | | |
| | long | 4/14/08 | 6/16/08 | 63 | 145.24 | 137.73 | | -7.51 | -5.17 | | | |
| | long | 8/04/08 | 9/01/08 | 28 | 130.56 | 129.62 | | -0.93 | -0.72 | | | |
| | long | 11/14/22 | 12/19/22 | 35 | 130.61 | 128.67 | | -1.93 | -1.48 | | | |
| | long | 1/16/23 | 5/15/23 | 119 | 147.73 | 176.77 | | 29.04 | 19.66 | | | 55.81 |
| Citigroup | short | 2/25/08 | 3/17/08 | 21 | 125.79 | 92.19 | 171.64 | 45.85 | 36.45 | | | |
| | short | 4/07/08 | 4/14/08 | 7 | 123.41 | 114.39 | 133.14 | 9.73 | 7.88 | | | 47.21 |
| SunEdison | short | 12/14/15 | 12/28/15 | 14 | 2.90 | 3.69 | 2.11 | -0.79 | -27.24 | | | |
| | short | 1/11/16 | 3/07/16 | 56 | 2.30 | 1.30 | 4.05 | 1.75 | 76.18 | | | 28.20 |
| Eli Lilly | long | 12/31/18 | 3/16/20 | 441 | 90.66 | 105.76 | | 15.11 | 16.66 | | | 16.66 |
| Gaia | short | 8/22/22 | 11/14/22 | 84 | 2.76 | 2.40 | 3.18 | 0.42 | 15.14 | | | 15.14 |
| Netflix | short | 11/21/11 | 11/28/11 | 7 | 6.73 | 6.47 | 7.01 | 0.27 | 4.08 | | | |
| | long | 10/05/15 | 12/14/15 | 70 | 73.43 | 79.72 | | 6.29 | 8.56 | | | |
| | short | 5/09/22 | 5/30/22 | 21 | 140.11 | 154.14 | 126.09 | -14.03 | -10.01 | | | 1.68 |
| JetBlue Airways | long | 9/14/15 | 9/21/15 | 7 | 17.07 | 17.30 | | 0.24 | 1.39 | | | 1.39 |
| Wynn Resorts | short | 9/21/15 | 10/05/15 | 14 | 42.91 | 42.83 | 42.99 | 0.08 | 0.19 | | | 0.19 |
| Array Tech | long | 8/15/22 | 8/22/22 | 7 | 18.96 | 17.41 | | -1.55 | -8.17 | | | -8.17 |
| United Natural Foods | short | 12/24/18 | 12/31/18 | 7 | 7.63 | 8.30 | 6.97 | -0.66 | -8.71 | | | -8.71 |
| Enphase Energy | long | 11/05/18 | 12/24/18 | 49 | 4.14 | 3.65 | | -0.49 | -11.89 | | | -11.89 |
| instrument | L/S | date buy | date sell | days | prc buy | prc sell | ps short | prc diff | d % | | | total |
| Plug Power | short | 5/15/23 | 5/22/23 | 7 | 6.26 | 7.11 | 5.42 | -0.84 | -13.47 | | | -13.47 |
| Western Digital | short | 10/29/18 | 11/05/18 | 7 | 32.45 | 37.14 | 27.76 | -4.69 | -14.45 | | | -14.45 |
| Energy Recovery | long | 12/28/15 | 1/11/16 | 14 | 4.77 | 4.26 | | -0.52 | -10.81 | | | |
| | long | 3/07/16 | 10/29/18 | 966 | 6.01 | 5.51 | | -0.50 | -8.34 | | | -18.25 |
| Keurig Dr Pepper | short | 8/24/15 | 9/14/15 | 21 | 32.52 | 38.48 | 26.56 | -5.96 | -18.33 | | | -18.33 |
| Occidental Pet | short | 3/16/20 | 5/04/20 | 49 | 9.83 | 12.47 | 7.18 | -2.65 | -26.95 | | | |
| | long | 5/30/22 | 6/13/22 | 14 | 55.96 | 49.13 | | -6.82 | -12.19 | | | -35.86 |
| Delta Air Lines | short | 6/16/08 | 8/04/08 | 49 | 2.85 | 4.11 | 1.60 | -1.26 | -44.00 | | | -44.00 |
| Beyond Meat | short | 6/13/22 | 8/15/22 | 63 | 18.29 | 29.53 | 7.04 | -11.25 | -61.49 | | | -61.49 |
Annotations
| 6/10/24 | NVidia | | | stock split 1:10 (ten for one) |
| 2/26/24 | Walmart | | | stock split 1:3 (three for one) |
| 8/22/23 | Copart | | | stock split 1:2 (two for one) |
| 4/01/23 | Monster Beverage | | | stock split 1:2 (two for one) |
| 11/04/22 | Copart | | | stock split 1:2 (two for one) |
| 8/25/22 | Tesla Motors | | | stock split 1:3 (three for one) |
| 7/18/22 | Alphabet C | | | stock split 1:20 (twenty for one) |
| | Alphabet A | | | stock split 1:20 (twenty for one) |
| 6/06/22 | Amazon.com | | | stock split 1:20 (twenty for one) |
| 10/05/21 | Intuitive Surgical | | | stock split 1:3 (three for one) |
| 8/02/21 | General Electric | | | reverse stock split 8:1 (eight become one) |
| 7/20/21 | NVidia | | | stock split 1:4 (four for one) |
| 6/29/21 | CSX | | | stock split 1:3 (three for one) |
| 6/28/21 | CoStar | | | stock split 1:10 (ten for one) |
| 4/03/20 | Raytheon Tech | | | spin-off Carrier and Otis = split 1000:1589 due to UTX-RTN merger |
| 5/23/19 | Fastenal | | | stock split 1:2 (two for one) |
| 3/20/18 | Fiserv | | | stock split 1:2 (two for one) |
| 3/02/18 | Priceline | | | changed name to Booking Holdings |
| 1/02/18 | HealthSouth | | | renames herself Encompass Health Corporation and gets new IDs and ticker |
| 6/15/17 | Xerox | | | reverse stock split 4:1 (one for four) |
| 2/21/17 | Comcast | | | split 1:2 (two for one) |
| 11/10/16 | Monster Beverage | | | stock split 1:3 (three for one) |
| 1/25/16 | HealthSouth | | | recording started |
| 1/01/16 | Sunrun | | | recording started |
| 12/24/15 | Nike | | | stock split 1:2 (two for one) |
| 11/02/15 | Hewlett-Packard | | | forward stock split 1000:2202 (two thousand two hundred and two for one thousand) |
| | Hewlett-Packard | | | spin-off of HP Enterprise |
| 10/02/15 | Google A | | | changes name to Alphabet |
| 7/20/15 | eBay | | | spin-off of PayPal ratio 2790 : 3839 |
| | PayPal | | | recording started |
| 7/14/15 | Netflix | | | forward stock split 1:7 (seven for one) |
| 6/30/15 | Priceline | | | joins the S&P 100 |
| | Baxter | | | drops out of S&P 100 |
| 6/12/15 | Ross Stores | | | forward stock split 1:2 (two for one) |
| 4/09/15 | Starbucks | | | forward stock split 1:2 (two for one) |
| 3/19/15 | Visa | | | forward stock split 1:4 (four for one) |
| 5/01/13 | T-Mobile US | | | reverse split 2:1 (one for two) and special dividend 4,06 |
|
|