Sun, 21st Jun 2026, 14:35UTC
Assessment - BSE Sensex 50 - 1/07/24 - RS = 13
⇐
⇓ freshest
⇓ 1/07/24
Δwk
1/04/24
prc diff
⇓
⇓
BSE Sensex
79,648.900
12/08/24
-0.07
79,476.200
0.22
74,014.500
5,461.700
7.38
11.19
ONGC
341.300
12/08/24
2.63
272.950
25.04
269.900
3.050
1.13
30.31
HDFC Life
702.450
12/08/24
0.01
600.750
16.93
634.750
-34.000
-5.36
-3.50
ITC
494.600
12/08/24
-0.26
429.050
15.28
426.700
2.350
0.55
-2.20
Sun Pharma
1,733.850
12/08/24
-0.08
1,520.100
14.06
1,629.250
-109.150
-6.70
19.15
SBI Life
1,705.000
12/08/24
-1.17
1,501.850
13.53
1,489.950
11.900
0.80
6.00
Infosys
1,797.400
12/08/24
1.51
1,590.800
12.99
1,495.450
95.350
6.38
1.41
Coal India
523.950
12/08/24
-1.10
474.800
10.35
442.050
32.750
7.41
46.80
L
Hindustan Unilever
2,748.700
12/08/24
0.05
2,505.100
9.72
2,285.900
219.200
9.59
0.55
Bharat Petroleum
333.400
12/08/24
304.550
9.47
300.350
4.200
1.40
40.12
NTPC
400.850
12/08/24
-2.39
369.750
8.41
342.350
27.400
8.00
36.59
Dr. Reddy's Labs
6,886.550
12/08/24
-1.81
6,353.700
8.39
6,250.350
103.350
1.65
6.04
HCL Technologies
1,585.250
12/08/24
-0.30
1,468.850
7.92
1,556.700
-87.850
-5.64
6.54
Tata Motors
1,076.150
12/08/24
0.75
1,002.050
7.39
992.250
9.800
0.99
33.28
Cipla
1,586.250
12/08/24
0.73
1,479.100
7.24
1,498.650
-19.550
-1.30
23.43
Tata Consumer
1,170.800
12/08/24
-1.29
1,094.550
6.97
1,086.900
7.650
0.70
13.11
L
Divi's Laboratories
4,891.000
12/08/24
1.26
4,602.100
6.28
3,567.950
1,034.150
28.98
23.37
Apollo Hospitals
6,502.400
12/08/24
-1.30
6,140.500
5.89
6,457.250
-316.750
-4.91
11.66
Tata Consultancy
4,195.650
12/08/24
-0.78
3,978.200
5.47
3,916.750
61.450
1.57
4.87
L
Asian Paints
3,053.200
12/08/24
0.41
2,927.800
4.28
2,871.000
56.800
1.98
-5.50
L
Eicher Motors
4,808.800
12/08/24
-0.45
4,635.550
3.74
3,946.650
688.900
17.46
30.64
L
Power Grid
341.150
12/08/24
-1.40
329.600
3.50
280.150
49.450
17.65
40.21
L
Britannia
5,645.750
12/08/24
-1.65
5,476.500
3.09
4,895.200
581.300
11.87
10.98
Tech Mahindra
1,512.500
12/08/24
0.38
1,472.100
2.74
1,244.550
227.550
18.28
11.18
Bajaj Auto
9,710.850
12/08/24
-0.56
9,532.400
1.87
9,042.150
490.250
5.42
60.07
⇓ freshest
⇓ 1/07/24
Δwk
1/04/24
prc diff
⇓
⇓
Adani Ports & SEZ
1,501.400
12/08/24
-2.11
1,474.500
1.82
1,375.900
98.600
7.17
46.21
Maruti Suzuki
12,273.200
12/08/24
0.40
12,108.700
1.36
12,569.600
-460.900
-3.67
19.59
Larsen & Toubro
3,571.950
12/08/24
-0.56
3,526.550
1.29
3,838.000
-311.450
-8.11
17.86
L
Bharti Airtel
1,458.600
12/08/24
-0.38
1,454.000
0.32
1,217.350
236.650
19.44
38.71
LTIMindtree
5,400.450
12/08/24
0.50
5,447.500
-0.86
4,882.600
564.900
11.57
-3.59
Adani Enterprises
3,151.750
12/08/24
-1.12
3,183.800
-1.01
3,252.100
-68.300
-2.10
19.90
Bajaj Finserv
1,559.000
12/08/24
-0.08
1,580.200
-1.34
1,646.000
-65.800
-4.00
-0.25
L
Kotak Mahindra Bank
1,772.550
12/08/24
0.16
1,808.100
-1.97
1,790.700
17.400
0.97
-3.32
L
Bharat Electronics
301.400
12/08/24
-0.26
307.650
-2.03
211.100
96.550
45.74
88.66
L
HDFC Bank
1,660.100
12/08/24
0.60
1,705.200
-2.64
1,470.500
234.700
15.96
3.28
L
JSW Steel
917.350
12/08/24
1.35
943.900
-2.81
871.950
71.950
8.25
12.89
ICICI Bank
1,172.800
12/08/24
0.10
1,211.850
-3.22
1,099.650
112.200
10.20
9.59
Titan
3,320.850
12/08/24
-0.33
3,431.450
-3.22
3,738.400
-306.950
-8.21
4.98
L
State Bank of India
812.600
12/08/24
-1.42
841.950
-3.49
758.300
83.650
11.03
29.64
Nestlé India
2,473.100
12/08/24
-1.26
2,568.100
-3.70
2,585.600
-17.500
-0.68
5.55
L
UltraTech Cement
11,302.800
12/08/24
0.02
11,904.700
-5.06
9,954.400
1,950.300
19.59
23.30
Hero Motocorp
5,311.850
12/08/24
2.01
5,603.100
-5.20
4,680.750
922.350
19.71
57.23
L
Mahindra & Mahindra
2,717.650
12/08/24
-1.15
2,875.850
-5.50
1,915.950
959.900
50.10
71.22
L
Grasim Industries
2,571.100
12/08/24
-0.06
2,726.400
-5.70
2,292.550
433.850
18.92
21.43
Reliance Industries
2,921.250
12/08/24
-0.93
3,120.300
-6.38
2,969.550
150.750
5.08
12.30
Wipro
489.050
12/08/24
-0.46
527.350
-7.26
484.950
42.400
8.74
9.24
IndusInd Bank
1,350.850
12/08/24
0.08
1,456.900
-7.28
1,542.400
-85.500
-5.54
2.15
L
Axis Bank
1,164.300
12/08/24
1.89
1,261.900
-7.73
1,053.100
208.800
19.83
12.99
L
Hindalco Industries
629.350
12/08/24
1.04
689.850
-8.77
568.600
121.250
21.32
31.92
L
Bajaj Finance
6,608.150
12/08/24
-0.15
7,276.750
-9.19
7,250.950
25.800
0.36
2.28
⇓ freshest
⇓ 1/07/24
Δwk
1/04/24
prc diff
⇓
⇓
L
Tata Steel
152.060
12/08/24
0.16
174.070
-12.64
163.150
10.920
6.69
36.02
BSE Sensex 50 - 50 out of 50 instruments rated - 1/07/24 / 1/04/24 - 38 did rise, Market-Ratio(13) = 76.00 % Stock Exchange Currency: INR ₹ Indian rupee
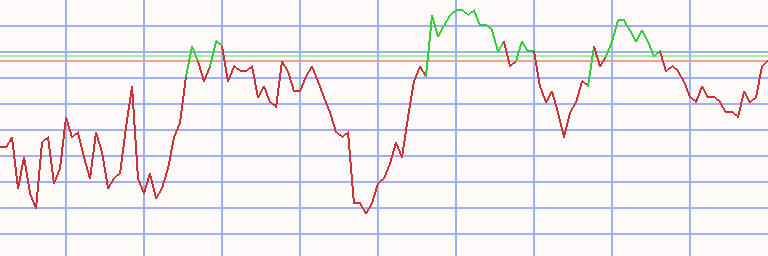
Technical Chart
Transactions BSE Sensex 50 * L13 - 78/76 (1)
⇐ L/S date buy date sell days instrument spl pieces prc buy prc sell prc diff d % asset yield
2/01/06 21/08/06 231 - cash -
long
21/08/06
20/11/06
91
UltraTech Cement
100
128
77.535
88.340
10.805
14
11,383
69
20/11/06 27/11/06 7 - cash -
27/11/06
4/12/06
7
Zee Entertainment
100
630
18.063
18.560
0.497
3
11,696
312
4/12/06 22/01/07 49 - cash -
22/01/07
5/02/07
14
Bharti Airtel
100
325
35.983
37.640
1.657
5
12,235
223
5/02/07 4/06/07 119 - cash -
4/06/07
11/06/07
7
Kotak Mahindra Bank
100
850
14.385
14.221
-0.164
-1
12,096
-45
11/06/07 2/07/07 21 - cash -
2/07/07
9/07/07
7
Kotak Mahindra Bank
100
729
16.581
16.483
-0.099
-1
12,024
-27
9/07/07 10/12/07 154 - cash -
10/12/07
24/12/07
14
IndusInd Bank
100
920
13.065
12.570
-0.495
-4
11,568
-63
24/12/07 13/04/09 476 - cash -
13/04/09
31/08/09
140
Maruti Suzuki
100
138
83.735
154.640
70.905
85
21,353
395
31/08/09 7/09/09 7 - cash -
7/09/09
26/10/09
49
Aurobindo Pharma
100
3,023
7.062
8.468
1.406
20
25,604
287
26/10/09 2/11/09 7 - cash -
2/11/09
25/01/10
84
Aurobindo Pharma
100
3,391
7.549
8.866
1.317
17
30,070
101
25/01/10 10/05/10 105 - cash -
10/05/10
17/05/10
7
Bajaj Finance
100
7,100
4.235
4.799
0.564
13
34,074
67,737
17/05/10 23/08/10 98 - cash -
23/08/10
22/11/10
91
Bajaj Finance
100
5,444
6.258
7.421
1.164
19
40,408
98
22/11/10 25/04/11 154 - cash -
25/04/11
23/05/11
28
Titan
100
1,963
20.580
21.103
0.523
3
41,435
39
23/05/11 13/02/12 266 - cash -
13/02/12
23/04/12
70
Tata Motors
100
1,604
25.825
30.975
5.150
20
49,696
158
23/04/12 17/09/12 147 - cash -
17/09/12
10/12/12
84
Bajaj Finance
100
4,565
10.884
12.785
1.900
17
58,371
101
10/12/12 7/01/13 28 - cash -
7/01/13
28/01/13
21
Aurobindo Pharma
100
5,790
10.080
9.500
-0.580
-6
55,013
-64
28/01/13 4/11/13 280 - cash -
4/11/13
16/12/13
42
Tech Mahindra
100
1,442
38.146
43.626
5.480
14
62,915
221
16/12/13 30/12/13 14 - cash -
30/12/13
6/01/14
7
Aurobindo Pharma
100
3,207
19.615
20.560
0.945
5
65,946
1,063
6/01/14 7/04/14 91 - cash -
7/04/14
6/10/14
182
Aurobindo Pharma
100
2,371
27.805
48.313
20.508
74
114,569
203
6/10/14 13/10/14 7 - cash -
13/10/14
27/10/14
14
Aurobindo Pharma
100
2,434
47.068
47.145
0.078
0
114,758
4
27/10/14 3/11/14 7 - cash -
3/11/14
8/12/14
35
Eicher Motors
100
900
127.396
149.523
22.127
17
134,672
431
8/12/14 19/01/15 42 - cash -
19/01/15
2/02/15
14
Eicher Motors
100
870
154.746
165.618
10.872
7
144,131
487
2/02/15 13/04/15 70 - cash -
13/04/15
20/04/15
7
Bosch
100
54
2,644.060
2,467.620
-176.440
-7
134,603
-97
20/04/15 18/04/16 364 - cash -
18/04/16
2/05/16
14
Bajaj Finance
100
1,840
73.139
70.538
-2.601
-4
129,816
-61
2/05/16 9/05/16 7 - cash -
9/05/16
23/05/16
14
Bajaj Finance
100
1,759
73.787
76.537
2.751
4
134,654
160
23/05/16 30/05/16 7 - cash -
30/05/16
3/10/16
126
Bajaj Finance
100
1,761
76.435
108.670
32.236
42
191,421
177
L/S date buy date sell days instrument spl pieces prc buy prc sell prc diff d % asset yield
3/10/16 20/02/17 140 - cash -
20/02/17
1/05/17
70
Indian Oil
100
9,931
19.275
22.045
2.770
14
218,930
101
1/05/17 5/06/17 35 - cash -
5/06/17
12/06/17
7
Indiabulls HF
100
1,869
117.105
115.825
-1.280
-1
216,538
-44
12/06/17 24/07/17 42 - cash -
24/07/17
31/07/17
7
Bajaj Finance
100
1,351
160.200
170.565
10.365
6
230,541
2,529
31/07/17 13/11/17 105 - cash -
13/11/17
27/11/17
14
Titan
100
3,013
76.510
83.260
6.750
9
250,879
806
27/11/17 8/01/18 42 - cash -
8/01/18
15/01/18
7
Titan
100
2,708
92.610
91.825
-0.785
-1
248,753
-36
15/01/18 29/04/19 469 - cash -
29/04/19
6/05/19
7
Bajaj Finance
100
803
309.685
303.430
-6.255
-2
243,730
-65
6/05/19 22/06/20 413 - cash -
22/06/20
21/09/20
91
Aurobindo Pharma
100
3,098
78.665
79.235
0.570
1
245,496
3
21/09/20 7/12/20 77 - cash -
7/12/20
29/03/21
112
Tata Steel
100
39,947
6.146
7.653
1.507
25
305,696
104
29/03/21 7/06/21 70 - cash -
7/06/21
9/08/21
63
Tata Steel
100
27,083
11.287
14.122
2.835
25
382,476
266
9/08/21 11/10/21 63 - cash -
11/10/21
25/10/21
14
Tata Motors
100
9,199
41.575
47.990
6.415
15
441,488
4,114
25/10/21 15/08/22 294 - cash -
15/08/22
29/08/22
14
Mahindra & Mahindra
100
3,492
126.400
127.680
1.280
1
445,958
30
29/08/22 12/09/22 14 - cash -
12/09/22
26/09/22
14
Mahindra & Mahindra
100
3,438
129.705
123.640
-6.065
-5
425,106
-71
26/09/22 29/05/23 245 - cash -
29/05/23
28/08/23
91
ITC
100
9,465
44.910
44.140
-0.770
-2
417,818
-7
28/08/23 11/09/23 14 - cash -
11/09/23
2/10/23
21
NTPC
100
17,187
24.310
24.600
0.290
1
422,802
23
2/10/23 4/12/23 63 - cash -
4/12/23
11/12/23
7
Coal India
100
11,919
35.470
35.365
-0.105
0
421,551
-14
11/12/23 25/12/23 14 - cash -
25/12/23
26/02/24
63
NTPC
100
13,921
30.280
33.760
3.480
11
469,996
88
26/02/24 21/06/26 846 - cash -
accum 21/08/06
26/02/24 1771
days out of 7475 invested (24%)
4,600
469,996
121
Instrument Related Contribution
instrument L/S date buy date sell days prc buy prc sell prc diff d % total Aurobindo Pharma long 7/09/09 26/10/09 49 7.06 8.47 1.41 19.91 2/11/09 25/01/10 84 7.55 8.87 1.32 17.45 7/01/13 28/01/13 21 10.08 9.50 -0.58 -5.75 30/12/13 6/01/14 7 19.62 20.56 0.95 4.82 7/04/14 6/10/14 182 27.81 48.31 20.51 73.75 13/10/14 27/10/14 14 47.07 47.15 0.08 0.16 22/06/20 21/09/20 91 78.67 79.24 0.57 0.72 143.88 Bajaj Finance 10/05/10 17/05/10 7 4.23 4.80 0.56 13.32 23/08/10 22/11/10 91 6.26 7.42 1.16 18.59 17/09/12 10/12/12 84 10.88 12.78 1.90 17.46 18/04/16 2/05/16 14 73.14 70.54 -2.60 -3.56 9/05/16 23/05/16 14 73.79 76.54 2.75 3.73 30/05/16 3/10/16 126 76.43 108.67 32.24 42.17 24/07/17 31/07/17 7 160.20 170.57 10.37 6.47 29/04/19 6/05/19 7 309.69 303.43 -6.26 -2.02 134.21 Maruti Suzuki 13/04/09 31/08/09 140 83.74 154.64 70.91 84.68 84.68 Tata Steel 7/12/20 29/03/21 112 6.15 7.65 1.51 24.52 7/06/21 9/08/21 63 11.29 14.12 2.84 25.12 55.80 Tata Motors 13/02/12 23/04/12 70 25.83 30.98 5.15 19.94 11/10/21 25/10/21 14 41.58 47.99 6.42 15.43 38.45 Eicher Motors 3/11/14 8/12/14 35 127.40 149.52 22.13 17.37 19/01/15 2/02/15 14 154.75 165.62 10.87 7.03 25.61 Indian Oil 20/02/17 1/05/17 70 19.28 22.05 2.77 14.37 14.37 Tech Mahindra 4/11/13 16/12/13 42 38.15 43.63 5.48 14.37 14.37 UltraTech Cement 21/08/06 20/11/06 91 77.54 88.34 10.81 13.94 13.94 instrument L/S date buy date sell days prc buy prc sell prc diff d % total NTPC 11/09/23 2/10/23 21 24.31 24.60 0.29 1.19 25/12/23 26/02/24 63 30.28 33.76 3.48 11.49 12.82 Titan 25/04/11 23/05/11 28 20.58 21.10 0.52 2.54 13/11/17 27/11/17 14 76.51 83.26 6.75 8.82 8/01/18 15/01/18 7 92.61 91.83 -0.79 -0.85 10.64 Bharti Airtel 22/01/07 5/02/07 14 35.98 37.64 1.66 4.60 4.60 Zee Entertainment 27/11/06 4/12/06 7 18.06 18.56 0.50 2.75 2.75 Coal India 4/12/23 11/12/23 7 35.47 35.37 -0.10 -0.30 -0.30 Indiabulls HF 5/06/17 12/06/17 7 117.11 115.83 -1.28 -1.09 -1.09 ITC 29/05/23 28/08/23 91 44.91 44.14 -0.77 -1.71 -1.71 Kotak Mahindra Bank 4/06/07 11/06/07 7 14.39 14.22 -0.16 -1.14 2/07/07 9/07/07 7 16.58 16.48 -0.10 -0.60 -1.73 Mahindra & Mahindra 15/08/22 29/08/22 14 126.40 127.68 1.28 1.01 12/09/22 26/09/22 14 129.71 123.64 -6.07 -4.68 -3.71 IndusInd Bank 10/12/07 24/12/07 14 13.07 12.57 -0.50 -3.79 -3.79 Bosch 13/04/15 20/04/15 7 2,644.06 2,467.62 -176.44 -6.67 -6.67
Annotations
4/03/24 BSE Sensex 50 Component update: Apollo Hospitals, Bharat Electronics and LTIMindtree replace Dabur, HDFC and UPL 5/01/24 Nestlé India stock split 1:10 (ten for one) 18/09/23 Power Grid stock split 3:4 (four for three) 28/07/22 Tata Steel stock split 1:10 (ten for one) 29/07/21 Power Grid stock split 3:4 (four for three) 5/12/19 HCL Technologies splits 1:2 (two for one) 4/09/18 Infosys stock split 1:2 (teo for one) 31/05/18 Tata Consultancy stock split 1:2 (two for one) 21/12/17 Mahindra & Mahindra stock split 1:2 (two for one) 7/09/17 Reliance Industries stock split 1:2 (two for one) 25/07/17 Grasim Industries due to lack of kowledge about an exact split ratio we have adapted history with a factor of 0.8 19/07/17 Grasim Industries demerger of Aditya Birla FS (7 new Aditya Birla for 5 old Grasim shares) 17/07/17 Bharat Petroleum stock split 2:3 (three for two) 13/07/17 Larsen & Toubro stock split 2:3 (three for two) 13/06/17 Wipro stock split 1:2 (two for one) 10/04/17 BSE Sensex 50 machine learning processed for all techniques BSE Sensex 50 implementation: this market contains the components of the BSE Sensex 50 Index which was launched on 15/12/16 ONGC stock split 2:3 (three for two) 1/07/16 ITC stock split 2:3 (three for two)
write an annotation