| | Mon, 29th Jun 2026, 15:08UTC |
| | |

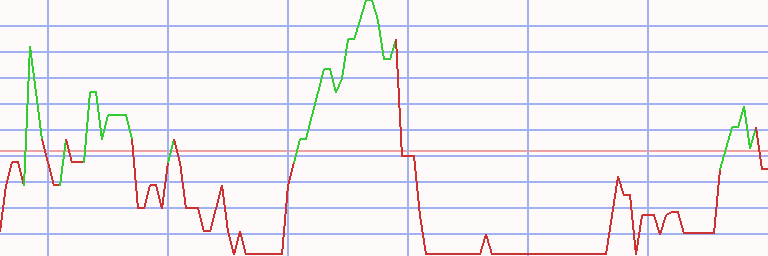
Assessment - Hang Seng Property in Euro - 1/07/24 - RS = 20
⇐
| |
|
instrument |
freshest |
⇓ Δday |
1/07/24 |
⇓ Δwk |
12/02/24 |
prc diff |
⇓ Δ20 |
|
⇓∅-RS |
| |  |
 |
 |
|
|
 |
HSI-Ppty |
1,768.436 |
12/08/24 |
-1.16 |
1,766.968 |
0.08 |
1,838.071 |
-71.104 |
-3.87 |
|
-15.19 |
| | |
|
|
|
S |
|
CK Property |
3.695 |
12/08/24 |
0.32 |
3.492 |
5.81 |
4.186 |
-0.694 |
-16.59 |
|
-21.09 |
| | |
|
|
|
L |
|
China Ov Land & Inv |
1.526 |
12/08/24 |
-0.93 |
1.616 |
-5.61 |
1.347 |
0.269 |
19.99 |
|
-2.06 |
| | |
|
|
|
L |
|
China Res Land |
2.716 |
12/08/24 |
-1.09 |
3.170 |
-14.31 |
2.787 |
0.383 |
13.73 |
|
-4.30 |
| | |
|
|
|
L |
|
China Res Mixc |
2.608 |
12/08/24 |
-1.13 |
3.086 |
-15.47 |
2.562 |
0.524 |
20.47 |
|
-8.65 |
| | |
|
|
|
|
|
Country Garden Svcs |
0.560 |
12/08/24 |
-1.47 |
0.575 |
-2.70 |
0.629 |
-0.053 |
-8.45 |
|
-25.15 |
| | |
|
|
|
S |
|
Hang Lung |
0.667 |
12/08/24 |
-1.41 |
0.795 |
-16.07 |
0.987 |
-0.192 |
-19.42 |
|
-29.57 |
| | |
|
|
|
|
|
Henderson Land |
2.632 |
12/08/24 |
-2.43 |
2.501 |
5.25 |
2.490 |
0.011 |
0.43 |
|
-4.67 |
| | |
|
|
|
S |
|
Link REIT |
4.160 |
12/08/24 |
-0.57 |
3.623 |
14.83 |
4.542 |
-0.919 |
-20.23 |
|
-19.01 |
| | |
|
|
|
L |
|
Longfor |
1.140 |
12/08/24 |
-1.95 |
1.280 |
-10.91 |
1.012 |
0.268 |
26.51 |
|
-11.92 |
| | |
|
|
|
|
|
New World Dev |
0.864 |
12/08/24 |
-2.69 |
0.873 |
-0.96 |
1.114 |
-0.241 |
-21.63 |
|
-35.87 |
| | |
|
|
|
|
|
Sun Hung Kai |
8.542 |
12/08/24 |
-1.85 |
8.064 |
5.92 |
8.479 |
-0.415 |
-4.89 |
|
-14.97 |
| | |
|
|
|
|
|
Wharf REIC |
2.573 |
12/08/24 |
-1.60 |
2.471 |
4.11 |
2.858 |
-0.387 |
-13.54 |
|
-23.66 |
| HSI-Prop - 12 out of 12 instruments rated - 1/07/24 / 12/02/24 - 5 did rise, Market-Ratio(20) in EUR = 41.67 % |
| Stock Exchange Currency: HKD $ Hong Kong dollar |
Technical Chart
Transactions Hang Seng Property in Euro * L20 - 41 ex 4 (2)
|
⇐ |
| |
| L/S | date buy | date sell | days | | instrument | spl | pieces | | prc buy | prc sell | | prc diff | d % | asset | yield | | | long |
2/01/06 |
5/06/06 |
154 |
|
|
|
China Ov Land & Inv |
50 |
12,719 |
|
0.393 |
0.452 |
|
0.059 |
15 |
10,750 |
39 |
|
| |
|
|
|
|
|
|
China Res Land |
50 |
13,505 |
|
0.370 |
0.399 |
|
0.029 |
8 |
11,141 |
20 |
|
| 5/06/06 |
19/06/06 |
14 |
|
- cash - |
| |
19/06/06 |
10/07/06 |
21 |
|
|
|
China Ov Land & Inv |
50 |
14,154 |
|
0.394 |
0.438 |
|
0.044 |
11 |
11,768 |
538 |
|
| |
|
|
|
|
|
|
China Res Land |
50 |
15,746 |
|
0.354 |
0.399 |
|
0.045 |
13 |
12,474 |
697 |
|
| 10/07/06 |
17/07/06 |
7 |
|
- cash - |
| |
17/07/06 |
21/08/06 |
35 |
|
|
|
China Ov Land & Inv |
50 |
13,481 |
|
0.463 |
0.500 |
|
0.037 |
8 |
12,973 |
123 |
|
| |
|
|
|
|
|
|
China Res Land |
50 |
15,369 |
|
0.406 |
0.470 |
|
0.064 |
16 |
13,953 |
358 |
|
| 21/08/06 |
28/08/06 |
7 |
|
- cash - |
| |
28/08/06 |
4/09/06 |
7 |
|
|
|
China Ov Land & Inv |
50 |
13,448 |
|
0.519 |
0.571 |
|
0.052 |
10 |
14,655 |
14,752 |
|
| |
|
|
|
|
|
|
China Res Land |
50 |
14,735 |
|
0.473 |
0.501 |
|
0.027 |
6 |
15,059 |
1,784 |
|
| 4/09/06 |
11/09/06 |
7 |
|
- cash - |
| |
11/09/06 |
18/09/06 |
7 |
|
|
|
China Ov Land & Inv |
50 |
13,158 |
|
0.572 |
0.613 |
|
0.040 |
7 |
15,591 |
3,417 |
|
| |
|
|
|
|
|
|
China Res Land |
50 |
15,398 |
|
0.489 |
0.541 |
|
0.052 |
11 |
16,386 |
18,611 |
|
| 18/09/06 |
25/09/06 |
7 |
|
- cash - |
| |
25/09/06 |
10/12/07 |
441 |
|
|
|
China Ov Land & Inv |
50 |
13,989 |
|
0.586 |
1.277 |
|
0.691 |
118 |
26,053 |
91 |
|
| |
|
|
|
|
|
|
China Res Land |
50 |
15,536 |
|
0.527 |
1.334 |
|
0.806 |
153 |
38,579 |
116 |
|
| |
10/12/07 |
4/02/08 |
56 |
|
|
|
Henderson Land |
50 |
3,195 |
|
6.036 |
4.931 |
|
-1.105 |
-18 |
35,047 |
-73 |
|
| |
|
|
|
|
|
|
Sun Hung Kai |
50 |
1,472 |
|
13.101 |
11.300 |
|
-1.802 |
-14 |
32,395 |
-62 |
|
| 4/02/08 |
28/04/08 |
84 |
|
- cash - |
| |
28/04/08 |
5/05/08 |
7 |
|
|
|
Sun Hung Kai |
50 |
1,487 |
|
10.889 |
10.601 |
|
-0.288 |
-3 |
31,967 |
-75 |
|
| |
|
|
|
|
|
|
China Res Land |
50 |
12,046 |
|
1.345 |
1.205 |
|
-0.140 |
-10 |
30,285 |
-100 |
|
| 5/05/08 |
28/07/08 |
84 |
|
- cash - |
| |
28/07/08 |
4/08/08 |
7 |
|
|
|
China Ov Land & Inv |
50 |
13,267 |
|
1.141 |
0.982 |
|
-0.159 |
-14 |
28,178 |
-100 |
|
| |
|
|
|
|
|
|
Sun Hung Kai |
50 |
1,668 |
|
9.079 |
8.570 |
|
-0.509 |
-6 |
27,330 |
-95 |
|
| 4/08/08 |
23/02/09 |
203 |
|
- cash - |
| |
23/02/09 |
17/08/09 |
175 |
|
|
|
China Ov Land & Inv |
50 |
13,227 |
|
1.033 |
1.521 |
|
0.488 |
47 |
33,789 |
124 |
|
| |
|
30/03/09 |
35 |
|
|
|
Link REIT |
50 |
8,978 |
|
1.522 |
1.522 |
|
0.000 |
0 |
33,791 |
0 |
|
| |
30/03/09 |
16/11/09 |
231 |
|
|
|
China Res Land |
50 |
10,433 |
|
1.310 |
1.522 |
|
0.212 |
16 |
36,001 |
27 |
|
| |
17/08/09 |
14/12/09 |
119 |
|
|
|
New World Dev |
50 |
3,273 |
|
6.148 |
5.400 |
|
-0.748 |
-12 |
33,555 |
-33 |
|
| |
16/11/09 |
30/11/09 |
14 |
|
|
|
Hang Lung |
50 |
5,770 |
|
2.752 |
2.422 |
|
-0.330 |
-12 |
31,649 |
-96 |
|
| |
30/11/09 |
14/12/09 |
14 |
|
|
|
China Res Land |
50 |
8,203 |
|
1.703 |
1.537 |
|
-0.166 |
-10 |
30,284 |
-93 |
|
| L/S | date buy | date sell | days | | instrument | spl | pieces | | prc buy | prc sell | | prc diff | d % | asset | yield | |
| 14/12/09 |
21/12/09 |
7 |
|
- cash - |
| |
21/12/09 |
25/01/10 |
35 |
|
|
|
Henderson Land |
50 |
2,919 |
|
5.186 |
4.635 |
|
-0.550 |
-11 |
28,678 |
-69 |
|
| |
|
|
|
|
|
|
New World Dev |
50 |
2,667 |
|
5.678 |
4.775 |
|
-0.903 |
-16 |
26,269 |
-84 |
|
| 25/01/10 |
8/02/10 |
14 |
|
- cash - |
| |
8/02/10 |
22/02/10 |
14 |
|
|
|
Hang Lung |
50 |
4,869 |
|
2.697 |
2.721 |
|
0.023 |
1 |
26,383 |
25 |
|
| |
|
|
|
|
|
|
Henderson Land |
50 |
2,752 |
|
4.772 |
4.738 |
|
-0.035 |
-1 |
26,288 |
-17 |
|
| 22/02/10 |
1/03/10 |
7 |
|
- cash - |
| |
1/03/10 |
8/03/10 |
7 |
|
|
|
Hang Lung |
50 |
4,782 |
|
2.748 |
2.939 |
|
0.191 |
7 |
27,201 |
3,216 |
|
| |
|
|
|
|
|
|
Henderson Land |
50 |
2,563 |
|
5.128 |
5.186 |
|
0.058 |
1 |
27,349 |
80 |
|
| 8/03/10 |
22/03/10 |
14 |
|
- cash - |
| |
22/03/10 |
19/04/10 |
28 |
|
|
|
Hang Lung |
50 |
4,733 |
|
2.889 |
2.859 |
|
-0.030 |
-1 |
27,207 |
-13 |
|
| |
|
|
|
|
|
|
Henderson Land |
50 |
2,631 |
|
5.197 |
4.990 |
|
-0.206 |
-4 |
26,664 |
-41 |
|
| 19/04/10 |
14/06/10 |
56 |
|
- cash - |
| |
14/06/10 |
16/08/10 |
63 |
|
|
|
Hang Lung |
50 |
4,292 |
|
3.106 |
3.421 |
|
0.316 |
10 |
28,019 |
75 |
|
| |
|
|
|
|
|
|
Link REIT |
50 |
6,132 |
|
2.174 |
2.167 |
|
-0.008 |
0 |
27,970 |
-2 |
|
| 16/08/10 |
30/08/10 |
14 |
|
- cash - |
| |
30/08/10 |
10/01/11 |
133 |
|
|
|
Hang Lung |
50 |
4,022 |
|
3.477 |
3.597 |
|
0.120 |
3 |
28,455 |
10 |
|
| |
|
7/02/11 |
161 |
|
|
|
Link REIT |
50 |
6,136 |
|
2.279 |
2.305 |
|
0.025 |
1 |
28,611 |
3 |
|
| |
10/01/11 |
|
28 |
|
|
|
Longfor |
50 |
11,818 |
|
1.224 |
1.118 |
|
-0.106 |
-9 |
27,354 |
-69 |
|
| 7/02/11 |
11/04/11 |
63 |
|
- cash - |
| |
11/04/11 |
18/04/11 |
7 |
|
|
|
Link REIT |
50 |
6,331 |
|
2.160 |
2.152 |
|
-0.008 |
0 |
27,301 |
-18 |
|
| |
|
|
|
|
|
|
Longfor |
50 |
11,835 |
|
1.156 |
1.149 |
|
-0.006 |
-1 |
27,227 |
-25 |
|
| 18/04/11 |
16/05/11 |
28 |
|
- cash - |
| |
16/05/11 |
23/05/11 |
7 |
|
|
|
Link REIT |
50 |
6,063 |
|
2.245 |
2.251 |
|
0.006 |
0 |
27,263 |
15 |
|
| |
|
|
|
|
|
|
Longfor |
50 |
11,788 |
|
1.155 |
1.140 |
|
-0.015 |
-1 |
27,089 |
-49 |
|
| 23/05/11 |
27/06/11 |
35 |
|
- cash - |
| |
27/06/11 |
8/08/11 |
42 |
|
|
|
Link REIT |
50 |
5,645 |
|
2.399 |
2.366 |
|
-0.033 |
-1 |
26,901 |
-11 |
|
| |
|
|
|
|
|
|
Longfor |
50 |
12,765 |
|
1.061 |
1.035 |
|
-0.026 |
-2 |
26,566 |
-20 |
|
| 8/08/11 |
30/01/12 |
175 |
|
- cash - |
| |
30/01/12 |
19/03/12 |
49 |
|
|
|
China Res Land |
50 |
9,591 |
|
1.385 |
1.251 |
|
-0.133 |
-10 |
25,286 |
-53 |
|
| |
|
20/02/12 |
21 |
|
|
|
Link REIT |
50 |
4,830 |
|
2.750 |
2.752 |
|
0.002 |
0 |
25,294 |
1 |
|
| |
20/02/12 |
27/02/12 |
7 |
|
|
|
Longfor |
50 |
11,761 |
|
1.130 |
1.074 |
|
-0.056 |
-5 |
24,634 |
-93 |
|
| |
27/02/12 |
5/03/12 |
7 |
|
|
|
New World Dev |
50 |
3,118 |
|
4.050 |
3.922 |
|
-0.128 |
-3 |
24,233 |
-81 |
|
| |
5/03/12 |
20/08/12 |
168 |
|
|
|
Link REIT |
50 |
4,297 |
|
2.846 |
3.513 |
|
0.667 |
23 |
27,099 |
58 |
|
| L/S | date buy | date sell | days | | instrument | spl | pieces | | prc buy | prc sell | | prc diff | d % | asset | yield | | | |
19/03/12 |
23/07/12 |
126 |
|
|
|
Longfor |
50 |
11,223 |
|
1.070 |
1.241 |
|
0.171 |
16 |
29,022 |
54 |
|
| |
23/07/12 |
17/09/12 |
56 |
|
|
|
China Res Land |
50 |
8,450 |
|
1.648 |
1.617 |
|
-0.031 |
-2 |
28,756 |
-12 |
|
| |
20/08/12 |
27/05/13 |
280 |
|
|
|
China Ov Land & Inv |
50 |
7,898 |
|
1.911 |
2.285 |
|
0.374 |
20 |
31,712 |
26 |
|
| |
17/09/12 |
10/12/12 |
84 |
|
|
|
New World Dev |
50 |
3,082 |
|
4.432 |
4.862 |
|
0.430 |
10 |
33,039 |
50 |
|
| |
10/12/12 |
27/05/13 |
168 |
|
|
|
China Res Land |
50 |
7,308 |
|
2.051 |
2.345 |
|
0.294 |
14 |
35,189 |
34 |
|
| 27/05/13 |
5/08/13 |
70 |
|
- cash - |
| |
5/08/13 |
12/08/13 |
7 |
|
|
|
China Ov Land & Inv |
50 |
7,816 |
|
2.251 |
2.336 |
|
0.085 |
4 |
35,855 |
595 |
|
| |
|
|
|
|
|
|
China Res Land |
50 |
8,023 |
|
2.193 |
2.191 |
|
-0.002 |
0 |
35,839 |
-5 |
|
| 12/08/13 |
4/11/13 |
84 |
|
- cash - |
| |
4/11/13 |
2/12/13 |
28 |
|
|
|
China Ov Land & Inv |
50 |
7,989 |
|
2.243 |
2.263 |
|
0.020 |
1 |
36,002 |
13 |
|
| |
|
|
|
|
|
|
China Res Land |
50 |
8,573 |
|
2.090 |
2.011 |
|
-0.079 |
-4 |
35,322 |
-40 |
|
| 2/12/13 |
9/12/13 |
7 |
|
- cash - |
| |
9/12/13 |
16/12/13 |
7 |
|
|
|
China Ov Land & Inv |
50 |
8,197 |
|
2.155 |
2.095 |
|
-0.060 |
-3 |
34,832 |
-77 |
|
| |
|
|
|
|
|
|
Link REIT |
50 |
4,931 |
|
3.581 |
3.524 |
|
-0.057 |
-2 |
34,549 |
-57 |
|
| 16/12/13 |
26/05/14 |
161 |
|
- cash - |
| |
26/05/14 |
9/06/14 |
14 |
|
|
|
Henderson Land |
50 |
3,666 |
|
4.712 |
5.011 |
|
0.300 |
6 |
35,647 |
399 |
|
| |
|
|
|
|
|
|
Link REIT |
50 |
4,480 |
|
3.856 |
3.977 |
|
0.120 |
3 |
36,187 |
123 |
|
| 9/06/14 |
16/06/14 |
7 |
|
- cash - |
| |
16/06/14 |
1/12/14 |
168 |
|
|
|
Sun Hung Kai |
50 |
1,780 |
|
10.161 |
11.588 |
|
1.427 |
14 |
38,727 |
33 |
|
| |
|
30/03/15 |
287 |
|
|
|
Link REIT |
50 |
4,539 |
|
3.987 |
5.714 |
|
1.727 |
43 |
46,564 |
58 |
|
| |
1/12/14 |
17/08/15 |
259 |
|
|
|
China Res Land |
50 |
10,693 |
|
1.929 |
2.351 |
|
0.422 |
22 |
51,080 |
32 |
|
| |
30/03/15 |
|
140 |
|
|
|
China Ov Land & Inv |
50 |
8,380 |
|
3.095 |
2.724 |
|
-0.371 |
-12 |
47,968 |
-28 |
|
| 17/08/15 |
28/12/15 |
133 |
|
- cash - |
| |
28/12/15 |
18/01/16 |
21 |
|
|
|
China Ov Land & Inv |
50 |
7,678 |
|
3.123 |
2.590 |
|
-0.533 |
-17 |
43,871 |
-96 |
|
| |
|
|
|
|
|
|
Longfor |
50 |
17,917 |
|
1.339 |
1.187 |
|
-0.152 |
-11 |
41,146 |
-88 |
|
| 18/01/16 |
18/04/16 |
91 |
|
- cash - |
| |
18/04/16 |
9/05/16 |
21 |
|
|
|
Link REIT |
50 |
3,831 |
|
5.369 |
5.324 |
|
-0.045 |
-1 |
40,975 |
-14 |
|
| |
|
|
|
|
|
|
Longfor |
50 |
15,889 |
|
1.295 |
1.161 |
|
-0.134 |
-10 |
38,847 |
-85 |
|
| 9/05/16 |
30/05/16 |
21 |
|
- cash - |
| |
30/05/16 |
6/06/16 |
7 |
|
|
|
Henderson Land |
50 |
3,622 |
|
5.361 |
4.886 |
|
-0.475 |
-9 |
37,126 |
-99 |
|
| |
|
5/12/16 |
189 |
|
|
|
Link REIT |
50 |
3,562 |
|
5.454 |
6.359 |
|
0.905 |
17 |
40,351 |
35 |
|
| |
6/06/16 |
25/07/16 |
49 |
|
|
|
China Ov Land & Inv |
50 |
6,559 |
|
2.698 |
3.030 |
|
0.332 |
12 |
42,530 |
137 |
|
| L/S | date buy | date sell | days | | instrument | spl | pieces | | prc buy | prc sell | | prc diff | d % | asset | yield | | | |
25/07/16 |
5/12/16 |
133 |
|
|
|
New World Dev |
50 |
4,747 |
|
4.187 |
4.139 |
|
-0.048 |
-1 |
42,302 |
-3 |
|
| 5/12/16 |
27/02/17 |
84 |
|
- cash - |
| |
27/02/17 |
5/06/17 |
98 |
|
|
|
Hang Lung |
50 |
8,823 |
|
2.397 |
2.318 |
|
-0.079 |
-3 |
41,605 |
-12 |
|
| |
|
10/04/17 |
42 |
|
|
|
New World Dev |
50 |
4,251 |
|
4.975 |
4.738 |
|
-0.237 |
-5 |
40,600 |
-35 |
|
| |
10/04/17 |
7/05/18 |
392 |
|
|
|
Longfor |
50 |
12,319 |
|
1.635 |
2.462 |
|
0.827 |
51 |
50,788 |
46 |
|
| |
5/06/17 |
12/06/17 |
7 |
|
|
|
China Res Land |
50 |
7,770 |
|
2.632 |
2.603 |
|
-0.029 |
-1 |
50,563 |
-44 |
|
| |
12/06/17 |
19/06/17 |
7 |
|
|
|
Hang Lung |
50 |
8,499 |
|
2.380 |
2.273 |
|
-0.107 |
-5 |
49,650 |
-91 |
|
| |
19/06/17 |
3/07/17 |
14 |
|
|
|
Link REIT |
50 |
2,665 |
|
7.247 |
6.645 |
|
-0.602 |
-8 |
48,046 |
-90 |
|
| |
3/07/17 |
28/08/17 |
56 |
|
|
|
China Res Land |
50 |
6,822 |
|
2.596 |
2.497 |
|
-0.099 |
-4 |
47,371 |
-22 |
|
| |
28/08/17 |
18/09/17 |
21 |
|
|
|
CK Property |
50 |
2,337 |
|
7.289 |
7.249 |
|
-0.040 |
-1 |
47,277 |
-9 |
|
| |
18/09/17 |
25/09/17 |
7 |
|
|
|
China Res Land |
50 |
5,843 |
|
2.900 |
2.566 |
|
-0.334 |
-12 |
45,326 |
-100 |
|
| |
25/09/17 |
22/01/18 |
119 |
|
|
|
New World Dev |
50 |
3,114 |
|
4.813 |
5.142 |
|
0.329 |
7 |
46,350 |
22 |
|
| |
22/01/18 |
7/05/18 |
105 |
|
|
|
China Res Land |
50 |
5,099 |
|
3.141 |
3.012 |
|
-0.129 |
-4 |
45,694 |
-14 |
|
| 7/05/18 |
14/05/18 |
7 |
|
- cash - |
| |
14/05/18 |
28/05/18 |
14 |
|
|
|
China Res Land |
50 |
7,067 |
|
3.233 |
3.184 |
|
-0.049 |
-2 |
45,347 |
-33 |
|
| |
|
|
|
|
|
|
Longfor |
50 |
8,904 |
|
2.566 |
2.581 |
|
0.015 |
1 |
45,481 |
16 |
|
| 28/05/18 |
4/06/18 |
7 |
|
- cash - |
| |
4/06/18 |
11/06/18 |
7 |
|
|
|
China Res Land |
50 |
6,832 |
|
3.328 |
3.368 |
|
0.039 |
1 |
45,749 |
85 |
|
| |
|
|
|
|
|
|
Longfor |
50 |
8,771 |
|
2.593 |
2.681 |
|
0.088 |
3 |
46,523 |
473 |
|
| 11/06/18 |
19/11/18 |
161 |
|
- cash - |
| |
19/11/18 |
26/11/18 |
7 |
|
|
|
China Ov Land & Inv |
50 |
7,590 |
|
3.065 |
2.982 |
|
-0.083 |
-3 |
45,895 |
-76 |
|
| |
|
|
|
|
|
|
China Res Land |
50 |
7,004 |
|
3.321 |
3.247 |
|
-0.074 |
-2 |
45,376 |
-69 |
|
| 26/11/18 |
3/12/18 |
7 |
|
- cash - |
| |
3/12/18 |
10/12/18 |
7 |
|
|
|
China Res Land |
50 |
6,599 |
|
3.438 |
3.165 |
|
-0.272 |
-8 |
43,580 |
-99 |
|
| |
|
|
|
|
|
|
Link REIT |
50 |
2,661 |
|
8.527 |
8.640 |
|
0.114 |
1 |
43,882 |
99 |
|
| 10/12/18 |
24/12/18 |
14 |
|
- cash - |
| |
24/12/18 |
28/01/19 |
35 |
|
|
|
China Res Land |
50 |
6,648 |
|
3.300 |
3.288 |
|
-0.012 |
0 |
43,803 |
-4 |
|
| |
|
29/07/19 |
217 |
|
|
|
Link REIT |
50 |
2,489 |
|
8.815 |
10.594 |
|
1.779 |
20 |
48,230 |
36 |
|
| |
28/01/19 |
11/02/19 |
14 |
|
|
|
China Ov Land & Inv |
50 |
6,918 |
|
3.160 |
3.264 |
|
0.104 |
3 |
48,951 |
133 |
|
| |
11/02/19 |
18/02/19 |
7 |
|
|
|
Longfor |
50 |
7,995 |
|
2.824 |
2.624 |
|
-0.200 |
-7 |
47,351 |
-98 |
|
| L/S | date buy | date sell | days | | instrument | spl | pieces | | prc buy | prc sell | | prc diff | d % | asset | yield | | | |
18/02/19 |
25/03/19 |
35 |
|
|
|
New World Dev |
50 |
3,690 |
|
5.686 |
5.489 |
|
-0.197 |
-3 |
46,626 |
-31 |
|
| |
25/03/19 |
1/04/19 |
7 |
|
|
|
Hang Lung |
50 |
9,625 |
|
2.105 |
2.264 |
|
0.160 |
8 |
48,163 |
4,430 |
|
| |
1/04/19 |
29/07/19 |
119 |
|
|
|
Longfor |
50 |
6,715 |
|
3.245 |
3.390 |
|
0.145 |
4 |
49,133 |
14 |
|
| 29/07/19 |
5/08/19 |
7 |
|
- cash - |
| |
5/08/19 |
12/08/19 |
7 |
|
|
|
Hang Lung |
50 |
11,312 |
|
2.172 |
2.172 |
|
0.000 |
0 |
49,133 |
0 |
|
| |
|
|
|
|
|
|
Country Garden Svcs |
50 |
12,333 |
|
1.992 |
2.044 |
|
0.052 |
3 |
49,779 |
287 |
|
| 12/08/19 |
23/12/19 |
133 |
|
- cash - |
| |
23/12/19 |
3/02/20 |
42 |
|
|
|
Longfor |
50 |
6,096 |
|
4.082 |
3.911 |
|
-0.171 |
-4 |
48,736 |
-31 |
|
| |
|
|
|
|
|
|
Country Garden Svcs |
50 |
8,235 |
|
3.023 |
3.079 |
|
0.056 |
2 |
49,200 |
17 |
|
| 3/02/20 |
10/02/20 |
7 |
|
- cash - |
| |
10/02/20 |
2/03/20 |
21 |
|
|
|
Longfor |
50 |
5,929 |
|
4.149 |
4.208 |
|
0.060 |
1 |
49,554 |
28 |
|
| |
|
|
|
|
|
|
Country Garden Svcs |
50 |
7,066 |
|
3.482 |
3.506 |
|
0.024 |
1 |
49,724 |
13 |
|
| 2/03/20 |
3/08/20 |
154 |
|
- cash - |
| |
3/08/20 |
28/09/20 |
56 |
|
|
|
Longfor |
50 |
5,949 |
|
4.179 |
4.815 |
|
0.636 |
15 |
53,510 |
152 |
|
| |
|
|
|
|
|
|
Country Garden Svcs |
50 |
4,730 |
|
5.255 |
5.424 |
|
0.169 |
3 |
54,308 |
23 |
|
| 28/09/20 |
5/10/20 |
7 |
|
- cash - |
| |
5/10/20 |
9/11/20 |
35 |
|
|
|
Longfor |
50 |
5,727 |
|
4.741 |
5.223 |
|
0.482 |
10 |
57,068 |
175 |
|
| |
|
|
|
|
|
|
Country Garden Svcs |
50 |
4,955 |
|
5.480 |
5.441 |
|
-0.039 |
-1 |
56,877 |
-7 |
|
| 9/11/20 |
16/11/20 |
7 |
|
- cash - |
| |
16/11/20 |
8/02/21 |
84 |
|
|
|
Longfor |
50 |
5,339 |
|
5.326 |
4.444 |
|
-0.882 |
-17 |
52,167 |
-54 |
|
| |
|
12/07/21 |
238 |
|
|
|
Country Garden Svcs |
50 |
5,423 |
|
5.244 |
8.356 |
|
3.112 |
59 |
69,042 |
104 |
|
| |
8/02/21 |
|
154 |
|
|
|
Wharf REIC |
50 |
5,201 |
|
4.561 |
4.816 |
|
0.254 |
6 |
70,365 |
14 |
|
| 12/07/21 |
19/07/21 |
7 |
|
- cash - |
| |
19/07/21 |
9/08/21 |
21 |
|
|
|
CK Property |
50 |
6,040 |
|
5.824 |
5.726 |
|
-0.099 |
-2 |
69,770 |
-26 |
|
| |
|
26/07/21 |
7 |
|
|
|
Country Garden Svcs |
50 |
4,178 |
|
8.420 |
6.481 |
|
-1.939 |
-23 |
61,670 |
-100 |
|
| |
26/07/21 |
9/08/21 |
14 |
|
|
|
Wharf REIC |
50 |
5,573 |
|
4.860 |
4.292 |
|
-0.568 |
-12 |
58,504 |
-96 |
|
| 9/08/21 |
17/01/22 |
161 |
|
- cash - |
| |
17/01/22 |
7/03/22 |
49 |
|
|
|
China Ov Land & Inv |
50 |
11,901 |
|
2.458 |
2.899 |
|
0.441 |
18 |
63,758 |
242 |
|
| |
|
|
|
|
|
|
China Res Land |
50 |
7,203 |
|
4.061 |
4.446 |
|
0.385 |
9 |
66,533 |
96 |
|
| 7/03/22 |
21/03/22 |
14 |
|
- cash - |
| |
21/03/22 |
28/03/22 |
7 |
|
|
|
China Ov Land & Inv |
50 |
12,538 |
|
2.653 |
2.762 |
|
0.109 |
4 |
67,897 |
713 |
|
| |
|
|
|
|
|
|
China Res Land |
50 |
7,998 |
|
4.159 |
4.163 |
|
0.004 |
0 |
67,929 |
5 |
|
| 28/03/22 |
4/04/22 |
7 |
|
- cash - |
| |
4/04/22 |
13/06/22 |
70 |
|
|
|
China Ov Land & Inv |
50 |
11,724 |
|
2.897 |
2.624 |
|
-0.273 |
-9 |
64,729 |
-40 |
|
| L/S | date buy | date sell | days | | instrument | spl | pieces | | prc buy | prc sell | | prc diff | d % | asset | yield | | | |
|
|
|
|
|
|
China Res Land |
50 |
7,563 |
|
4.491 |
3.960 |
|
-0.530 |
-12 |
60,718 |
-48 |
|
| 13/06/22 |
12/12/22 |
182 |
|
- cash - |
| |
12/12/22 |
15/05/23 |
154 |
|
|
|
Sun Hung Kai |
50 |
2,464 |
|
12.319 |
12.325 |
|
0.006 |
0 |
60,733 |
0 |
|
| |
|
|
|
|
|
|
Wharf REIC |
50 |
5,872 |
|
5.171 |
5.037 |
|
-0.134 |
-3 |
59,947 |
-6 |
|
| 15/05/23 |
6/05/24 |
357 |
|
- cash - |
| |
6/05/24 |
17/06/24 |
42 |
|
|
|
China Ov Land & Inv |
50 |
16,897 |
|
1.774 |
1.702 |
|
-0.071 |
-4 |
58,740 |
-30 |
|
| |
|
|
|
|
|
|
Henderson Land |
50 |
10,388 |
|
2.885 |
2.564 |
|
-0.321 |
-11 |
55,407 |
-64 |
|
| 17/06/24 |
29/06/26 |
742 |
|
- cash - |
| accum | 2/01/06 |
17/06/24 | 4018 |
days out of 7483 invested (54%) |
454 |
55,407 |
17 |
|
Instrument Related Contribution
| instrument | L/S | date buy | date sell | days | prc buy | prc sell | | prc diff | d % | spl | di % | total |
| China Ov Land & Inv | long | 2/01/06 | 5/06/06 | 154 | 0.39 | 0.45 | | 0.06 | 15.00 | 50 | 7.50 | |
| | | 19/06/06 | 10/07/06 | 21 | 0.39 | 0.44 | | 0.04 | 11.25 | | 5.63 | |
| | | 17/07/06 | 21/08/06 | 35 | 0.46 | 0.50 | | 0.04 | 8.00 | | 4.00 | |
| | | 28/08/06 | 4/09/06 | 7 | 0.52 | 0.57 | | 0.05 | 10.07 | | 5.03 | |
| | | 11/09/06 | 18/09/06 | 7 | 0.57 | 0.61 | | 0.04 | 7.07 | | 3.53 | |
| | | 25/09/06 | 10/12/07 | 441 | 0.59 | 1.28 | | 0.69 | 118.01 | | 59.00 | |
| | | 28/07/08 | 4/08/08 | 7 | 1.14 | 0.98 | | -0.16 | -13.91 | | -6.96 | |
| | | 23/02/09 | 17/08/09 | 175 | 1.03 | 1.52 | | 0.49 | 47.27 | | 23.63 | |
| | | 20/08/12 | 27/05/13 | 280 | 1.91 | 2.29 | | 0.37 | 19.58 | | 9.79 | |
| | | 5/08/13 | 12/08/13 | 7 | 2.25 | 2.34 | | 0.09 | 3.79 | | 1.89 | |
| | | 4/11/13 | 2/12/13 | 28 | 2.24 | 2.26 | | 0.02 | 0.91 | | 0.46 | |
| | | 9/12/13 | 16/12/13 | 7 | 2.15 | 2.09 | | -0.06 | -2.78 | | -1.39 | |
| | | 30/03/15 | 17/08/15 | 140 | 3.10 | 2.72 | | -0.37 | -12.00 | | -6.00 | |
| | | 28/12/15 | 18/01/16 | 21 | 3.12 | 2.59 | | -0.53 | -17.08 | | -8.54 | |
| | | 6/06/16 | 25/07/16 | 49 | 2.70 | 3.03 | | 0.33 | 12.31 | | 6.16 | |
| | | 19/11/18 | 26/11/18 | 7 | 3.06 | 2.98 | | -0.08 | -2.70 | | -1.35 | |
| | | 28/01/19 | 11/02/19 | 14 | 3.16 | 3.26 | | 0.10 | 3.30 | | 1.65 | |
| | | 17/01/22 | 7/03/22 | 49 | 2.46 | 2.90 | | 0.44 | 17.96 | | 8.98 | |
| | | 21/03/22 | 28/03/22 | 7 | 2.65 | 2.76 | | 0.11 | 4.10 | | 2.05 | |
| | | 4/04/22 | 13/06/22 | 70 | 2.90 | 2.62 | | -0.27 | -9.42 | | -4.71 | |
| | | 6/05/24 | 17/06/24 | 42 | 1.77 | 1.70 | | -0.07 | -4.03 | | -2.01 | 147.38 |
| China Res Land | | 2/01/06 | 5/06/06 | 154 | 0.37 | 0.40 | | 0.03 | 7.82 | | 3.91 | |
| | | 19/06/06 | 10/07/06 | 21 | 0.35 | 0.40 | | 0.04 | 12.69 | | 6.34 | |
| | | 17/07/06 | 21/08/06 | 35 | 0.41 | 0.47 | | 0.06 | 15.70 | | 7.85 | |
| | | 28/08/06 | 4/09/06 | 7 | 0.47 | 0.50 | | 0.03 | 5.79 | | 2.90 | |
| | | 11/09/06 | 18/09/06 | 7 | 0.49 | 0.54 | | 0.05 | 10.55 | | 5.28 | |
| | | 25/09/06 | 10/12/07 | 441 | 0.53 | 1.33 | | 0.81 | 152.88 | | 76.44 | |
| | | 28/04/08 | 5/05/08 | 7 | 1.35 | 1.21 | | -0.14 | -10.38 | | -5.19 | |
| | | 30/03/09 | 16/11/09 | 231 | 1.31 | 1.52 | | 0.21 | 16.18 | | 8.09 | |
| | | 30/11/09 | 14/12/09 | 14 | 1.70 | 1.54 | | -0.17 | -9.77 | | -4.88 | |
| | | 30/01/12 | 19/03/12 | 49 | 1.38 | 1.25 | | -0.13 | -9.64 | | -4.82 | |
| | | 23/07/12 | 17/09/12 | 56 | 1.65 | 1.62 | | -0.03 | -1.91 | | -0.95 | |
| | | 10/12/12 | 27/05/13 | 168 | 2.05 | 2.35 | | 0.29 | 14.35 | | 7.17 | |
| | | 5/08/13 | 12/08/13 | 7 | 2.19 | 2.19 | | -0.00 | -0.09 | | -0.05 | |
| | | 4/11/13 | 2/12/13 | 28 | 2.09 | 2.01 | | -0.08 | -3.80 | | -1.90 | |
| | | 1/12/14 | 17/08/15 | 259 | 1.93 | 2.35 | | 0.42 | 21.89 | | 10.95 | |
| | | 5/06/17 | 12/06/17 | 7 | 2.63 | 2.60 | | -0.03 | -1.10 | | -0.55 | |
| | | 3/07/17 | 28/08/17 | 56 | 2.60 | 2.50 | | -0.10 | -3.82 | | -1.91 | |
| | | 18/09/17 | 25/09/17 | 7 | 2.90 | 2.57 | | -0.33 | -11.52 | | -5.76 | |
| | | 22/01/18 | 7/05/18 | 105 | 3.14 | 3.01 | | -0.13 | -4.09 | | -2.05 | |
| | | 14/05/18 | 28/05/18 | 14 | 3.23 | 3.18 | | -0.05 | -1.52 | | -0.76 | |
| | | 4/06/18 | 11/06/18 | 7 | 3.33 | 3.37 | | 0.04 | 1.18 | | 0.59 | |
| | | 19/11/18 | 26/11/18 | 7 | 3.32 | 3.25 | | -0.07 | -2.23 | | -1.12 | |
| | | 3/12/18 | 10/12/18 | 7 | 3.44 | 3.17 | | -0.27 | -7.92 | | -3.96 | |
| | | 24/12/18 | 28/01/19 | 35 | 3.30 | 3.29 | | -0.01 | -0.36 | | -0.18 | |
| | | 17/01/22 | 7/03/22 | 49 | 4.06 | 4.45 | | 0.39 | 9.49 | | 4.74 | |
| | | 21/03/22 | 28/03/22 | 7 | 4.16 | 4.16 | | 0.00 | 0.09 | | 0.05 | |
| | | 4/04/22 | 13/06/22 | 70 | 4.49 | 3.96 | | -0.53 | -11.81 | | -5.91 | 105.07 |
| instrument | L/S | date buy | date sell | days | prc buy | prc sell | | prc diff | d % | spl | di % | total |
| Link REIT | | 23/02/09 | 30/03/09 | 35 | 1.52 | 1.52 | | 0.00 | 0.01 | | 0.01 | |
| | | 14/06/10 | 16/08/10 | 63 | 2.17 | 2.17 | | -0.01 | -0.36 | | -0.18 | |
| | | 30/08/10 | 7/02/11 | 161 | 2.28 | 2.30 | | 0.03 | 1.12 | | 0.56 | |
| | | 11/04/11 | 18/04/11 | 7 | 2.16 | 2.15 | | -0.01 | -0.39 | | -0.19 | |
| | | 16/05/11 | 23/05/11 | 7 | 2.25 | 2.25 | | 0.01 | 0.27 | | 0.13 | |
| | | 27/06/11 | 8/08/11 | 42 | 2.40 | 2.37 | | -0.03 | -1.39 | | -0.69 | |
| | | 30/01/12 | 20/02/12 | 21 | 2.75 | 2.75 | | 0.00 | 0.06 | | 0.03 | |
| | | 5/03/12 | 20/08/12 | 168 | 2.85 | 3.51 | | 0.67 | 23.43 | | 11.71 | |
| | | 9/12/13 | 16/12/13 | 7 | 3.58 | 3.52 | | -0.06 | -1.60 | | -0.80 | |
| | | 26/05/14 | 9/06/14 | 14 | 3.86 | 3.98 | | 0.12 | 3.12 | | 1.56 | |
| | | 16/06/14 | 30/03/15 | 287 | 3.99 | 5.71 | | 1.73 | 43.30 | | 21.65 | |
| | | 18/04/16 | 9/05/16 | 21 | 5.37 | 5.32 | | -0.04 | -0.83 | | -0.42 | |
| | | 30/05/16 | 5/12/16 | 189 | 5.45 | 6.36 | | 0.91 | 16.60 | | 8.30 | |
| | | 19/06/17 | 3/07/17 | 14 | 7.25 | 6.65 | | -0.60 | -8.30 | | -4.15 | |
| | | 3/12/18 | 10/12/18 | 7 | 8.53 | 8.64 | | 0.11 | 1.33 | | 0.67 | |
| | | 24/12/18 | 29/07/19 | 217 | 8.82 | 10.59 | | 1.78 | 20.18 | | 10.09 | 56.31 |
| Country Garden Svcs | | 5/08/19 | 12/08/19 | 7 | 1.99 | 2.04 | | 0.05 | 2.63 | | 1.31 | |
| | | 23/12/19 | 3/02/20 | 42 | 3.02 | 3.08 | | 0.06 | 1.86 | | 0.93 | |
| | | 10/02/20 | 2/03/20 | 21 | 3.48 | 3.51 | | 0.02 | 0.69 | | 0.35 | |
| | | 3/08/20 | 28/09/20 | 56 | 5.26 | 5.42 | | 0.17 | 3.21 | | 1.61 | |
| | | 5/10/20 | 9/11/20 | 35 | 5.48 | 5.44 | | -0.04 | -0.71 | | -0.35 | |
| | | 16/11/20 | 12/07/21 | 238 | 5.24 | 8.36 | | 3.11 | 59.34 | | 29.67 | |
| | | 19/07/21 | 26/07/21 | 7 | 8.42 | 6.48 | | -1.94 | -23.03 | | -11.51 | 19.21 |
| Longfor | | 10/01/11 | 7/02/11 | 28 | 1.22 | 1.12 | | -0.11 | -8.69 | | -4.34 | |
| | | 11/04/11 | 18/04/11 | 7 | 1.16 | 1.15 | | -0.01 | -0.54 | | -0.27 | |
| | | 16/05/11 | 23/05/11 | 7 | 1.15 | 1.14 | | -0.01 | -1.28 | | -0.64 | |
| | | 27/06/11 | 8/08/11 | 42 | 1.06 | 1.03 | | -0.03 | -2.47 | | -1.24 | |
| | | 20/02/12 | 27/02/12 | 7 | 1.13 | 1.07 | | -0.06 | -4.97 | | -2.48 | |
| | | 19/03/12 | 23/07/12 | 126 | 1.07 | 1.24 | | 0.17 | 16.02 | | 8.01 | |
| | | 28/12/15 | 18/01/16 | 21 | 1.34 | 1.19 | | -0.15 | -11.36 | | -5.68 | |
| | | 18/04/16 | 9/05/16 | 21 | 1.29 | 1.16 | | -0.13 | -10.34 | | -5.17 | |
| | | 10/04/17 | 7/05/18 | 392 | 1.64 | 2.46 | | 0.83 | 50.58 | | 25.29 | |
| | | 14/05/18 | 28/05/18 | 14 | 2.57 | 2.58 | | 0.01 | 0.58 | | 0.29 | |
| | | 4/06/18 | 11/06/18 | 7 | 2.59 | 2.68 | | 0.09 | 3.40 | | 1.70 | |
| | | 11/02/19 | 18/02/19 | 7 | 2.82 | 2.62 | | -0.20 | -7.09 | | -3.54 | |
| | | 1/04/19 | 29/07/19 | 119 | 3.25 | 3.39 | | 0.14 | 4.45 | | 2.23 | |
| | | 23/12/19 | 3/02/20 | 42 | 4.08 | 3.91 | | -0.17 | -4.19 | | -2.09 | |
| | | 10/02/20 | 2/03/20 | 21 | 4.15 | 4.21 | | 0.06 | 1.44 | | 0.72 | |
| | | 3/08/20 | 28/09/20 | 56 | 4.18 | 4.82 | | 0.64 | 15.23 | | 7.61 | |
| | | 5/10/20 | 9/11/20 | 35 | 4.74 | 5.22 | | 0.48 | 10.17 | | 5.08 | |
| | | 16/11/20 | 8/02/21 | 84 | 5.33 | 4.44 | | -0.88 | -16.56 | | -8.28 | 13.66 |
| instrument | L/S | date buy | date sell | days | prc buy | prc sell | | prc diff | d % | spl | di % | total |
| Hang Lung | | 16/11/09 | 30/11/09 | 14 | 2.75 | 2.42 | | -0.33 | -12.00 | | -6.00 | |
| | | 8/02/10 | 22/02/10 | 14 | 2.70 | 2.72 | | 0.02 | 0.87 | | 0.43 | |
| | | 1/03/10 | 8/03/10 | 7 | 2.75 | 2.94 | | 0.19 | 6.95 | | 3.47 | |
| | | 22/03/10 | 19/04/10 | 28 | 2.89 | 2.86 | | -0.03 | -1.04 | | -0.52 | |
| | | 14/06/10 | 16/08/10 | 63 | 3.11 | 3.42 | | 0.32 | 10.16 | | 5.08 | |
| | | 30/08/10 | 10/01/11 | 133 | 3.48 | 3.60 | | 0.12 | 3.47 | | 1.73 | |
| | | 27/02/17 | 5/06/17 | 98 | 2.40 | 2.32 | | -0.08 | -3.29 | | -1.65 | |
| | | 12/06/17 | 19/06/17 | 7 | 2.38 | 2.27 | | -0.11 | -4.51 | | -2.26 | |
| | | 25/03/19 | 1/04/19 | 7 | 2.10 | 2.26 | | 0.16 | 7.59 | | 3.79 | |
| | | 5/08/19 | 12/08/19 | 7 | 2.17 | 2.17 | | 0.00 | 0.00 | | 0.00 | 3.65 |
| CK Property | | 28/08/17 | 18/09/17 | 21 | 7.29 | 7.25 | | -0.04 | -0.55 | | -0.27 | |
| | | 19/07/21 | 9/08/21 | 21 | 5.82 | 5.73 | | -0.10 | -1.69 | | -0.85 | -1.12 |
| Sun Hung Kai | | 10/12/07 | 4/02/08 | 56 | 13.10 | 11.30 | | -1.80 | -13.75 | | -6.88 | |
| | | 28/04/08 | 5/05/08 | 7 | 10.89 | 10.60 | | -0.29 | -2.65 | | -1.32 | |
| | | 28/07/08 | 4/08/08 | 7 | 9.08 | 8.57 | | -0.51 | -5.60 | | -2.80 | |
| | | 16/06/14 | 1/12/14 | 168 | 10.16 | 11.59 | | 1.43 | 14.04 | | 7.02 | |
| | | 12/12/22 | 15/05/23 | 154 | 12.32 | 12.33 | | 0.01 | 0.05 | | 0.02 | -4.39 |
| Wharf REIC | | 8/02/21 | 12/07/21 | 154 | 4.56 | 4.82 | | 0.25 | 5.58 | | 2.79 | |
| | | 26/07/21 | 9/08/21 | 14 | 4.86 | 4.29 | | -0.57 | -11.69 | | -5.84 | |
| | | 12/12/22 | 15/05/23 | 154 | 5.17 | 5.04 | | -0.13 | -2.59 | | -1.29 | -4.47 |
| New World Dev | | 17/08/09 | 14/12/09 | 119 | 6.15 | 5.40 | | -0.75 | -12.16 | | -6.08 | |
| | | 21/12/09 | 25/01/10 | 35 | 5.68 | 4.77 | | -0.90 | -15.91 | | -7.95 | |
| | | 27/02/12 | 5/03/12 | 7 | 4.05 | 3.92 | | -0.13 | -3.17 | | -1.58 | |
| | | 17/09/12 | 10/12/12 | 84 | 4.43 | 4.86 | | 0.43 | 9.71 | | 4.86 | |
| | | 25/07/16 | 5/12/16 | 133 | 4.19 | 4.14 | | -0.05 | -1.15 | | -0.57 | |
| | | 27/02/17 | 10/04/17 | 42 | 4.97 | 4.74 | | -0.24 | -4.76 | | -2.38 | |
| | | 25/09/17 | 22/01/18 | 119 | 4.81 | 5.14 | | 0.33 | 6.83 | | 3.42 | |
| | | 18/02/19 | 25/03/19 | 35 | 5.69 | 5.49 | | -0.20 | -3.46 | | -1.73 | -12.00 |
| instrument | L/S | date buy | date sell | days | prc buy | prc sell | | prc diff | d % | spl | di % | total |
| Henderson Land | | 10/12/07 | 4/02/08 | 56 | 6.04 | 4.93 | | -1.11 | -18.31 | | -9.15 | |
| | | 21/12/09 | 25/01/10 | 35 | 5.19 | 4.64 | | -0.55 | -10.61 | | -5.31 | |
| | | 8/02/10 | 22/02/10 | 14 | 4.77 | 4.74 | | -0.03 | -0.72 | | -0.36 | |
| | | 1/03/10 | 8/03/10 | 7 | 5.13 | 5.19 | | 0.06 | 1.13 | | 0.57 | |
| | | 22/03/10 | 19/04/10 | 28 | 5.20 | 4.99 | | -0.21 | -3.97 | | -1.98 | |
| | | 26/05/14 | 9/06/14 | 14 | 4.71 | 5.01 | | 0.30 | 6.36 | | 3.18 | |
| | | 30/05/16 | 6/06/16 | 7 | 5.36 | 4.89 | | -0.48 | -8.86 | | -4.43 | |
| | | 6/05/24 | 17/06/24 | 42 | 2.89 | 2.56 | | -0.32 | -11.12 | | -5.56 | -21.32 |
Annotations
| 1/03/24 | HSI-Prop | | | Component update: Country Garden Holding removed |
|
|