| | Fri, 19th Jun 2026, 16:31UTC |
| | |

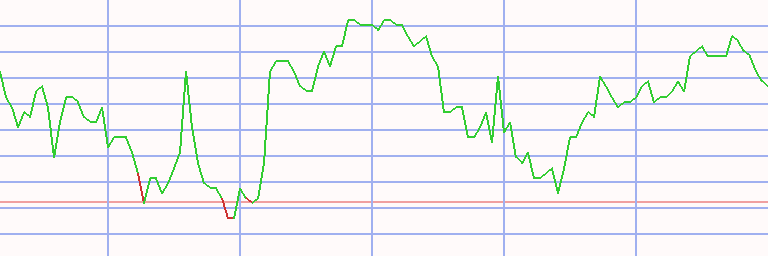
Assessment - STOXX Europe 50 in Pound sterling - 1/07/24 - RS = 22
⇐
| |
|
instrument |
freshest |
⇓ Δday |
1/07/24 |
⇓ Δwk |
29/01/24 |
prc diff |
⇓ Δ22 |
|
⇓∅-RS |
| |  |
 |
 |
|
|
 |
Stoxx 50 |
3,685.940 |
12/08/24 |
-0.16 |
3,824.835 |
-3.63 |
3,591.661 |
233.174 |
6.49 |
|
7.89 |
| | |
|
|
|
L |
|
ABB |
39.839 |
12/08/24 |
0.55 |
44.102 |
-9.67 |
33.717 |
10.385 |
30.80 |
|
32.59 |
| | |
|
|
|
S |
|
Air Liquide |
137.707 |
12/08/24 |
-0.79 |
137.978 |
-0.20 |
146.864 |
-8.885 |
-6.05 |
|
-6.38 |
| | |
|
|
|
|
|
Airbus |
113.491 |
12/08/24 |
-0.45 |
111.693 |
1.61 |
127.086 |
-15.394 |
-12.11 |
|
-8.06 |
| | |
|
|
|
|
|
Allianz |
217.123 |
12/08/24 |
|
222.723 |
-2.51 |
210.176 |
12.547 |
5.97 |
|
8.53 |
| | |
|
|
|
|
|
Anheuser-Busch InBev |
46.836 |
12/08/24 |
-0.47 |
46.191 |
1.40 |
48.966 |
-2.775 |
-5.67 |
|
-2.46 |
| | |
|
|
|
|
|
ASML |
665.710 |
12/08/24 |
0.08 |
809.695 |
-17.78 |
686.068 |
123.627 |
18.02 |
|
34.43 |
| | |
|
|
|
L |
|
AstraZeneca |
12,780.000 |
12/08/24 |
0.63 |
12,304.000 |
3.87 |
10,568.000 |
1,736.000 |
16.43 |
|
15.63 |
| | |
|
|
|
|
|
Axa |
27.448 |
12/08/24 |
-0.77 |
26.523 |
3.49 |
26.452 |
0.071 |
0.27 |
|
3.30 |
| | |
|
|
|
|
|
Banco Santander |
3.469 |
12/08/24 |
-0.24 |
3.774 |
-8.06 |
3.045 |
0.729 |
23.93 |
|
14.23 |
| | |
|
|
|
S |
|
BASF |
35.025 |
12/08/24 |
-0.22 |
37.664 |
-7.01 |
38.412 |
-0.749 |
-1.95 |
|
-4.82 |
| | |
|
|
|
L |
|
BAT |
2,801.000 |
12/08/24 |
|
2,451.000 |
14.28 |
2,355.000 |
96.000 |
4.08 |
|
-1.76 |
| | |
|
|
|
L |
|
Bayer |
22.026 |
12/08/24 |
-0.04 |
22.204 |
-0.80 |
26.209 |
-4.005 |
-15.28 |
|
-25.29 |
| | |
|
|
|
|
|
BNP Paribas |
50.272 |
12/08/24 |
|
52.325 |
-3.92 |
52.887 |
-0.562 |
-1.06 |
|
1.02 |
| | |
|
|
|
|
|
BP |
439.600 |
12/08/24 |
1.35 |
478.500 |
-8.13 |
465.800 |
12.700 |
2.73 |
|
-5.19 |
| | |
|
|
|
|
|
Deutsche Post |
30.579 |
12/08/24 |
-0.36 |
32.683 |
-6.44 |
38.208 |
-5.525 |
-14.46 |
|
-8.06 |
| | |
|
|
|
L |
|
Deutsche Telekom |
20.983 |
12/08/24 |
0.49 |
20.092 |
4.43 |
19.615 |
0.476 |
2.43 |
|
10.11 |
| | |
|
|
|
S |
|
Diageo |
2,451.500 |
12/08/24 |
1.03 |
2,480.000 |
-1.15 |
2,841.500 |
-361.500 |
-12.72 |
|
-13.31 |
| | |
|
|
|
|
|
Enel |
5.462 |
12/08/24 |
0.44 |
5.606 |
-2.56 |
5.305 |
0.301 |
5.67 |
|
5.31 |
| | |
|
|
|
|
|
EssilorLuxottica |
175.888 |
12/08/24 |
-0.58 |
171.221 |
2.73 |
155.320 |
15.901 |
10.24 |
|
8.17 |
| | |
|
|
|
|
|
Glencore |
410.250 |
12/08/24 |
1.27 |
461.700 |
-11.14 |
424.950 |
36.750 |
8.65 |
|
1.18 |
| | |
|
|
|
|
|
GSK |
1,572.000 |
12/08/24 |
0.42 |
1,526.000 |
3.01 |
1,533.600 |
-7.600 |
-0.50 |
|
5.65 |
| | |
|
|
|
|
|
Hermes International |
1,702.031 |
12/08/24 |
-0.50 |
1,783.484 |
-4.57 |
1,676.468 |
107.016 |
6.38 |
|
3.68 |
| | |
|
|
|
L |
|
HSBC |
643.900 |
12/08/24 |
0.22 |
690.900 |
-6.80 |
617.000 |
73.900 |
11.98 |
|
9.01 |
| | |
|
|
|
L |
|
Iberdrola |
10.271 |
12/08/24 |
0.29 |
10.453 |
-1.75 |
9.394 |
1.059 |
11.27 |
|
8.51 |
| |
|
instrument |
freshest |
⇓ Δday |
1/07/24 |
⇓ Δwk |
29/01/24 |
prc diff |
⇓ Δ22 |
|
⇓∅-RS |
| | |
|
|
|
|
|
ING Groep |
12.924 |
12/08/24 |
0.21 |
13.879 |
-6.88 |
11.143 |
2.736 |
24.55 |
|
20.15 |
| | |
|
|
|
|
|
L´Oreal |
319.576 |
12/08/24 |
-1.59 |
349.782 |
-8.64 |
379.051 |
-29.269 |
-7.72 |
|
-4.07 |
| | |
|
|
|
S |
|
LVMH |
538.863 |
12/08/24 |
-0.14 |
604.111 |
-10.80 |
661.772 |
-57.662 |
-8.71 |
|
-7.83 |
| | |
|
|
|
S |
|
Mercedes-Benz |
48.770 |
12/08/24 |
-0.57 |
54.981 |
-11.30 |
52.751 |
2.230 |
4.23 |
|
-3.80 |
| | |
|
|
|
L |
|
Münchener Rück |
372.648 |
12/08/24 |
1.01 |
396.151 |
-5.93 |
337.152 |
58.999 |
17.50 |
|
18.27 |
| | |
|
|
|
S |
|
National Grid |
978.400 |
12/08/24 |
-0.04 |
885.400 |
10.50 |
1,045.500 |
-160.100 |
-15.31 |
|
-13.65 |
| | |
|
|
|
L |
|
Nestlé |
77.594 |
12/08/24 |
-0.40 |
80.431 |
-3.53 |
90.695 |
-10.264 |
-11.32 |
|
-9.40 |
| | |
|
|
|
L |
|
Novartis |
84.685 |
12/08/24 |
0.16 |
84.668 |
0.02 |
84.782 |
-0.114 |
-0.13 |
|
6.59 |
| | |
|
|
|
|
|
Novo Nordisk |
101.590 |
12/08/24 |
-2.80 |
114.299 |
-11.12 |
85.280 |
29.019 |
34.03 |
|
37.83 |
| | |
|
|
|
L |
|
Prosus |
27.872 |
12/08/24 |
1.77 |
28.097 |
-0.80 |
23.899 |
4.198 |
17.57 |
|
11.31 |
| | |
|
|
|
|
|
Reckitt Benckiser |
4,180.000 |
12/08/24 |
|
4,289.000 |
-2.54 |
5,670.000 |
-1,381.000 |
-24.36 |
|
-16.63 |
| | |
|
|
|
|
|
RELX |
3,531.000 |
12/08/24 |
0.57 |
3,577.000 |
-1.29 |
3,266.000 |
311.000 |
9.52 |
|
18.92 |
| | |
|
|
|
L |
|
Richemont |
112.225 |
12/08/24 |
1.22 |
123.036 |
-8.79 |
117.486 |
5.550 |
4.72 |
|
9.07 |
| | |
|
|
|
|
|
Rio Tinto |
4,942.000 |
12/08/24 |
0.56 |
5,234.000 |
-5.58 |
5,578.000 |
-344.000 |
-6.17 |
|
-0.91 |
| | |
|
|
|
L |
|
Roche |
243.183 |
12/08/24 |
0.25 |
218.935 |
11.08 |
225.163 |
-6.228 |
-2.77 |
|
0.51 |
| | |
|
|
|
|
|
Safran |
163.076 |
12/08/24 |
-0.18 |
171.476 |
-4.90 |
148.756 |
22.720 |
15.27 |
|
18.88 |
| | |
|
|
|
|
|
Sanofi |
81.173 |
12/08/24 |
-0.60 |
77.932 |
4.16 |
78.998 |
-1.066 |
-1.35 |
|
-1.40 |
| | |
|
|
|
|
|
SAP |
160.615 |
12/08/24 |
-0.33 |
157.544 |
1.95 |
138.100 |
19.444 |
14.08 |
|
26.58 |
| | |
|
|
|
|
|
Schneider Electric |
179.239 |
12/08/24 |
0.38 |
191.203 |
-6.26 |
155.593 |
35.610 |
22.89 |
|
24.40 |
| | |
|
|
|
|
|
Shell |
28.021 |
12/08/24 |
0.93 |
28.746 |
-2.52 |
24.811 |
3.935 |
15.86 |
|
10.68 |
| | |
|
|
|
|
|
Siemens |
133.379 |
12/08/24 |
0.01 |
150.281 |
-11.25 |
142.652 |
7.629 |
5.35 |
|
12.22 |
| | |
|
|
|
|
|
TotalEnergies |
52.368 |
12/08/24 |
0.60 |
53.971 |
-2.97 |
51.327 |
2.644 |
5.15 |
|
3.19 |
| | |
|
|
|
|
|
UBS |
21.753 |
12/08/24 |
0.44 |
23.618 |
-7.89 |
23.424 |
0.194 |
0.83 |
|
11.98 |
| | |
|
|
|
L |
|
Unilever Plc |
4,714.000 |
12/08/24 |
-0.34 |
4,345.000 |
8.49 |
3,826.000 |
519.000 |
13.57 |
|
11.64 |
| | |
|
|
|
S |
|
Vinci |
87.095 |
12/08/24 |
-0.77 |
85.611 |
1.73 |
99.654 |
-14.043 |
-14.09 |
|
-9.23 |
| |
|
instrument |
freshest |
⇓ Δday |
1/07/24 |
⇓ Δwk |
29/01/24 |
prc diff |
⇓ Δ22 |
|
⇓∅-RS |
| | |
|
|
|
L |
|
Zurich Insurance |
406.793 |
12/08/24 |
0.85 |
422.637 |
-3.75 |
405.156 |
17.481 |
4.31 |
|
7.26 |
| Europe 50 - 50 out of 50 instruments rated - 1/07/24 / 29/01/24 - 31 did rise, Market-Ratio(22) in GBP = 62.00 % |
Technical Chart
Transactions STOXX Europe 50 in Pound sterling * S22 - 21 ex 7 (1)
|
⇐ |
| |
| L/S | date buy | date sell | days | | instrument | spl | pieces | | prc buy | prc sell | ps short | prc diff | d % | asset | yield | |
| 2/01/06 |
28/01/08 |
756 |
|
- cash - |
| short |
28/01/08 |
18/02/08 |
21 |
|
|
|
Safran |
100 |
1,290 |
|
7.751 |
9.813 |
5.689 |
-2.062 |
-27 |
7,340 |
-100 |
|
| 18/02/08 |
25/02/08 |
7 |
|
- cash - |
| |
25/02/08 |
21/04/08 |
56 |
|
|
|
UBS |
100 |
428 |
|
17.128 |
17.667 |
16.590 |
-0.538 |
-3 |
7,109 |
-19 |
|
| 21/04/08 |
5/05/08 |
14 |
|
- cash - |
| |
5/05/08 |
19/05/08 |
14 |
|
|
|
UBS |
100 |
401 |
|
17.693 |
15.728 |
19.903 |
2.210 |
12 |
7,996 |
2,052 |
|
| 19/05/08 |
26/05/08 |
7 |
|
- cash - |
| |
26/05/08 |
23/06/08 |
28 |
|
|
|
UBS |
100 |
575 |
|
13.892 |
10.780 |
17.904 |
4.012 |
29 |
10,302 |
2,630 |
|
| 23/06/08 |
14/07/08 |
21 |
|
- cash - |
| |
14/07/08 |
4/08/08 |
21 |
|
|
|
UBS |
100 |
1,066 |
|
9.664 |
9.435 |
9.898 |
0.235 |
2 |
10,553 |
52 |
|
| 4/08/08 |
8/09/08 |
35 |
|
- cash - |
| |
8/09/08 |
15/09/08 |
7 |
|
|
|
UBS |
100 |
859 |
|
12.274 |
9.916 |
15.192 |
2.919 |
24 |
13,060 |
> 999,999 |
|
| 15/09/08 |
22/09/08 |
7 |
|
- cash - |
| |
22/09/08 |
27/10/08 |
35 |
|
|
|
UBS |
100 |
1,271 |
|
10.271 |
7.759 |
13.597 |
3.325 |
32 |
17,286 |
1,763 |
|
| |
27/10/08 |
5/01/09 |
70 |
|
|
|
ING Groep |
100 |
4,347 |
|
3.976 |
5.570 |
2.383 |
-1.593 |
-40 |
10,360 |
-93 |
|
| 5/01/09 |
12/01/09 |
7 |
|
- cash - |
| |
12/01/09 |
23/02/09 |
42 |
|
|
|
Rio Tinto |
100 |
780 |
|
13.276 |
15.060 |
11.491 |
-1.784 |
-13 |
8,968 |
-71 |
|
| |
23/02/09 |
30/03/09 |
35 |
|
|
|
ING Groep |
100 |
3,676 |
|
2.439 |
2.851 |
2.028 |
-0.412 |
-17 |
7,455 |
-85 |
|
| 30/03/09 |
6/04/09 |
7 |
|
- cash - |
| |
6/04/09 |
13/04/09 |
7 |
|
|
|
ING Groep |
100 |
2,015 |
|
3.698 |
4.625 |
2.770 |
-0.928 |
-25 |
5,586 |
-100 |
|
| 13/04/09 |
30/08/10 |
504 |
|
- cash - |
| |
30/08/10 |
6/09/10 |
7 |
|
|
|
BP |
100 |
1,467 |
|
3.806 |
4.065 |
3.547 |
-0.259 |
-7 |
5,206 |
-97 |
|
| 6/09/10 |
8/08/11 |
336 |
|
- cash - |
| |
8/08/11 |
15/08/11 |
7 |
|
|
|
UBS |
100 |
622 |
|
8.363 |
9.348 |
7.379 |
-0.984 |
-12 |
4,593 |
-100 |
|
| 15/08/11 |
22/08/11 |
7 |
|
- cash - |
| |
22/08/11 |
29/08/11 |
7 |
|
|
|
BNP Paribas |
100 |
160 |
|
28.607 |
30.467 |
26.747 |
-1.860 |
-7 |
4,296 |
-97 |
|
| 29/08/11 |
5/09/11 |
7 |
|
- cash - |
| |
5/09/11 |
19/09/11 |
14 |
|
|
|
BNP Paribas |
100 |
156 |
|
27.428 |
23.284 |
32.310 |
4.882 |
18 |
5,057 |
7,056 |
|
| 19/09/11 |
26/09/11 |
7 |
|
- cash - |
| |
26/09/11 |
24/10/11 |
28 |
|
|
|
BNP Paribas |
100 |
219 |
|
22.992 |
27.866 |
18.119 |
-4.873 |
-21 |
3,990 |
-96 |
|
| 24/10/11 |
31/10/11 |
7 |
|
- cash - |
| |
31/10/11 |
14/11/11 |
14 |
|
|
|
BNP Paribas |
100 |
138 |
|
28.823 |
27.234 |
30.504 |
1.682 |
6 |
4,222 |
339 |
|
| 14/11/11 |
24/08/15 |
1379 |
|
- cash - |
| |
24/08/15 |
12/10/15 |
49 |
|
|
|
Glencore |
100 |
3,061 |
|
1.379 |
1.212 |
1.570 |
0.191 |
14 |
4,806 |
162 |
|
| 12/10/15 |
14/12/15 |
63 |
|
- cash - |
| |
14/12/15 |
28/12/15 |
14 |
|
|
|
Glencore |
100 |
6,007 |
|
0.800 |
0.924 |
0.676 |
-0.124 |
-16 |
4,061 |
-99 |
|
| 28/12/15 |
4/01/16 |
7 |
|
- cash - |
| |
4/01/16 |
25/01/16 |
21 |
|
|
|
Glencore |
100 |
4,762 |
|
0.853 |
0.809 |
0.899 |
0.047 |
5 |
4,283 |
152 |
|
| 25/01/16 |
11/04/16 |
77 |
|
- cash - |
| |
11/04/16 |
18/04/16 |
7 |
|
|
|
Banco Santander |
100 |
1,433 |
|
2.988 |
3.272 |
2.705 |
-0.283 |
-9 |
3,877 |
-99 |
|
| 18/04/16 |
2/05/16 |
14 |
|
- cash - |
| |
2/05/16 |
9/05/16 |
7 |
|
|
|
Mercedes-Benz |
100 |
80 |
|
48.005 |
47.181 |
48.843 |
0.838 |
2 |
3,944 |
147 |
|
| 9/05/16 |
26/03/18 |
686 |
|
- cash - |
| |
26/03/18 |
16/04/18 |
21 |
|
|
|
BAT |
100 |
101 |
|
39.000 |
40.430 |
37.570 |
-1.430 |
-4 |
3,800 |
-48 |
|
| 16/04/18 |
15/10/18 |
182 |
|
- cash - |
| |
15/10/18 |
29/10/18 |
14 |
|
|
|
ING Groep |
100 |
399 |
|
9.510 |
9.207 |
9.823 |
0.313 |
3 |
3,925 |
133 |
|
| 29/10/18 |
10/12/18 |
42 |
|
- cash - |
| |
10/12/18 |
17/12/18 |
7 |
|
|
|
Bayer |
100 |
71 |
|
54.994 |
57.591 |
52.397 |
-2.597 |
-5 |
3,740 |
-92 |
|
| L/S | date buy | date sell | days | | instrument | spl | pieces | | prc buy | prc sell | ps short | prc diff | d % | asset | yield | |
| 17/12/18 |
24/12/18 |
7 |
|
- cash - |
| |
24/12/18 |
21/01/19 |
28 |
|
|
|
BAT |
100 |
148 |
|
25.190 |
25.650 |
24.730 |
-0.460 |
-2 |
3,672 |
-21 |
|
| 21/01/19 |
28/01/19 |
7 |
|
- cash - |
| |
28/01/19 |
4/02/19 |
7 |
|
|
|
BAT |
100 |
154 |
|
23.750 |
26.805 |
20.695 |
-3.055 |
-13 |
3,202 |
-100 |
|
| 4/02/19 |
9/03/20 |
399 |
|
- cash - |
| |
9/03/20 |
23/03/20 |
14 |
|
|
|
Anheuser-Busch InBev |
100 |
85 |
|
37.311 |
36.342 |
38.304 |
0.994 |
3 |
3,286 |
98 |
|
| |
23/03/20 |
30/03/20 |
7 |
|
|
|
Safran |
100 |
61 |
|
53.112 |
75.493 |
30.731 |
-22.381 |
-42 |
1,921 |
-100 |
|
| |
30/03/20 |
20/04/20 |
21 |
|
|
|
Glencore |
100 |
1,614 |
|
1.190 |
1.431 |
0.949 |
-0.241 |
-20 |
1,533 |
-98 |
|
| 20/04/20 |
27/04/20 |
7 |
|
- cash - |
| |
27/04/20 |
11/05/20 |
14 |
|
|
|
Airbus |
100 |
34 |
|
44.551 |
47.714 |
41.389 |
-3.163 |
-7 |
1,425 |
-85 |
|
| 11/05/20 |
18/05/20 |
7 |
|
- cash - |
| |
18/05/20 |
8/06/20 |
21 |
|
|
|
Airbus |
100 |
28 |
|
49.418 |
72.810 |
26.025 |
-23.392 |
-47 |
770 |
-100 |
|
| 8/06/20 |
20/06/22 |
742 |
|
- cash - |
| |
20/06/22 |
27/06/22 |
7 |
|
|
|
Deutsche Post |
100 |
25 |
|
29.944 |
31.485 |
28.403 |
-1.541 |
-5 |
732 |
-94 |
|
| 27/06/22 |
26/09/22 |
91 |
|
- cash - |
| |
26/09/22 |
10/10/22 |
14 |
|
|
|
Deutsche Post |
100 |
27 |
|
27.015 |
28.405 |
25.625 |
-1.390 |
-5 |
694 |
-75 |
|
| 10/10/22 |
19/06/26 |
1348 |
|
- cash - |
| accum | 28/01/08 |
10/10/22 | 686 |
days out of 7473 invested (9%) |
-93 |
694 |
-76 |
|
Instrument Related Contribution
| instrument | L/S | date buy | date sell | days | prc buy | prc sell | ps short | prc diff | d % | | | total |
| UBS | short | 25/02/08 | 21/04/08 | 56 | 17.13 | 17.67 | 16.59 | -0.54 | -3.14 | | | |
| | | 5/05/08 | 19/05/08 | 14 | 17.69 | 15.73 | 19.90 | 2.21 | 12.49 | | | |
| | | 26/05/08 | 23/06/08 | 28 | 13.89 | 10.78 | 17.90 | 4.01 | 28.88 | | | |
| | | 14/07/08 | 4/08/08 | 21 | 9.66 | 9.43 | 9.90 | 0.23 | 2.43 | | | |
| | | 8/09/08 | 15/09/08 | 7 | 12.27 | 9.92 | 15.19 | 2.92 | 23.78 | | | |
| | | 22/09/08 | 27/10/08 | 35 | 10.27 | 7.76 | 13.60 | 3.33 | 32.38 | | | |
| | | 8/08/11 | 15/08/11 | 7 | 8.36 | 9.35 | 7.38 | -0.98 | -11.77 | | | 107.93 |
| Anheuser-Busch InBev | | 9/03/20 | 23/03/20 | 14 | 37.31 | 36.34 | 38.30 | 0.99 | 2.66 | | | 2.66 |
| Mercedes-Benz | | 2/05/16 | 9/05/16 | 7 | 48.00 | 47.18 | 48.84 | 0.84 | 1.75 | | | 1.75 |
| Bayer | | 10/12/18 | 17/12/18 | 7 | 54.99 | 57.59 | 52.40 | -2.60 | -4.72 | | | -4.72 |
| BP | | 30/08/10 | 6/09/10 | 7 | 3.81 | 4.07 | 3.55 | -0.26 | -6.81 | | | -6.81 |
| BNP Paribas | | 22/08/11 | 29/08/11 | 7 | 28.61 | 30.47 | 26.75 | -1.86 | -6.50 | | | |
| | | 5/09/11 | 19/09/11 | 14 | 27.43 | 23.28 | 32.31 | 4.88 | 17.80 | | | |
| | | 26/09/11 | 24/10/11 | 28 | 22.99 | 27.87 | 18.12 | -4.87 | -21.20 | | | |
| | | 31/10/11 | 14/11/11 | 14 | 28.82 | 27.23 | 30.50 | 1.68 | 5.83 | | | -8.14 |
| Banco Santander | | 11/04/16 | 18/04/16 | 7 | 2.99 | 3.27 | 2.71 | -0.28 | -9.48 | | | -9.48 |
| Deutsche Post | | 20/06/22 | 27/06/22 | 7 | 29.94 | 31.48 | 28.40 | -1.54 | -5.15 | | | |
| | | 26/09/22 | 10/10/22 | 14 | 27.01 | 28.40 | 25.62 | -1.39 | -5.15 | | | -10.03 |
| Rio Tinto | | 12/01/09 | 23/02/09 | 42 | 13.28 | 15.06 | 11.49 | -1.78 | -13.44 | | | -13.44 |
| BAT | | 26/03/18 | 16/04/18 | 21 | 39.00 | 40.43 | 37.57 | -1.43 | -3.67 | | | |
| | | 24/12/18 | 21/01/19 | 28 | 25.19 | 25.65 | 24.73 | -0.46 | -1.83 | | | |
| | | 28/01/19 | 4/02/19 | 7 | 23.75 | 26.81 | 20.70 | -3.06 | -12.86 | | | -17.59 |
| Glencore | | 24/08/15 | 12/10/15 | 49 | 1.38 | 1.21 | 1.57 | 0.19 | 13.83 | | | |
| | | 14/12/15 | 28/12/15 | 14 | 0.80 | 0.92 | 0.68 | -0.12 | -15.50 | | | |
| | | 4/01/16 | 25/01/16 | 21 | 0.85 | 0.81 | 0.90 | 0.05 | 5.46 | | | |
| | | 30/03/20 | 20/04/20 | 21 | 1.19 | 1.43 | 0.95 | -0.24 | -20.22 | | | -19.07 |
| instrument | L/S | date buy | date sell | days | prc buy | prc sell | ps short | prc diff | d % | | | total |
| Airbus | | 27/04/20 | 11/05/20 | 14 | 44.55 | 47.71 | 41.39 | -3.16 | -7.10 | | | |
| | | 18/05/20 | 8/06/20 | 21 | 49.42 | 72.81 | 26.03 | -23.39 | -47.34 | | | -51.07 |
| Safran | | 28/01/08 | 18/02/08 | 21 | 7.75 | 9.81 | 5.69 | -2.06 | -26.61 | | | |
| | | 23/03/20 | 30/03/20 | 7 | 53.11 | 75.49 | 30.73 | -22.38 | -42.14 | | | -57.53 |
| ING Groep | | 27/10/08 | 5/01/09 | 70 | 3.98 | 5.57 | 2.38 | -1.59 | -40.07 | | | |
| | | 23/02/09 | 30/03/09 | 35 | 2.44 | 2.85 | 2.03 | -0.41 | -16.88 | | | |
| | | 6/04/09 | 13/04/09 | 7 | 3.70 | 4.63 | 2.77 | -0.93 | -25.08 | | | |
| | | 15/10/18 | 29/10/18 | 14 | 9.51 | 9.21 | 9.82 | 0.31 | 3.29 | | | -61.45 |
Annotations
| 19/02/24 | Stoxx 50 | | | Component update: Glencore, ING and Munich Re replace Adidas, Adyen and Kering |
| 14/09/23 | Prosus | | | stock split 1:2.1796 (two-point-onesevenninesix for one) |
| 13/09/23 | Novo Nordisk | | | stock split 1:2 (two for one) |
| 18/07/22 | GlaxoSmithKline | | | demergers OTC business -> Haleon |
| 24/09/18 | Europe 50 | | | Safran replaces Imperial Brands |
| 31/05/17 | Europe 50 | | | Glencore replaces Syngenta (acquired by ChemChina) |
| 4/10/16 | AB InBev | | | acquisition of SAB Miller completed |
| 19/09/16 | Europe 50 | | | Syngenta replaces Richemont |
| 8/08/16 | Europe 50 | | | ASML and Vinci replace Credit Suisse and Deutsche Bank |
| 21/09/15 | Europe 50 | | | Imperial Tobacco and Intesa Sanpaolo replace BHP Biliton and Glencore |
| 14/09/15 | Europe 50 | | | complete analysis
ex BHP Biliton, Glencore - in Imperial Tobacco, Intesa Sanpaolo |
| 5/09/15 | Europe 50 | | | complete analysis |
| 9/07/15 | Europe 50 | | | market adjustment to index: Novo Nordisk replaces Standard Chartered |
| 22/09/14 | Europe 50 | | | BT Group and Prudential replace Ericsson and Tesco. |
|
|