| | |
| | |

Assessment - Dow Jones Transportation Average in Pound sterling - 1/07/24 - RS = 22
⇐
| |
|
⇓instrument |
freshest |
⇓ Δday |
1/07/24 |
Δwk |
29/01/24 |
prc diff |
⇓ Δ22 |
|
⇓∅-RS |
| |  |
 |
 |
|
S |
 |
DJTA |
12,062.113 |
12/08/24 |
-0.56 |
12,101.269 |
-0.32 |
12,558.459 |
-457.190 |
-3.64 |
|
-1.30 |
| | |
|
|
|
L |
|
C.H. Robinson |
78.074 |
12/08/24 |
0.20 |
68.669 |
13.70 |
67.651 |
1.018 |
1.50 |
|
3.89 |
| | |
|
|
|
|
|
Norfolk Southern |
187.615 |
12/08/24 |
-1.02 |
169.327 |
10.80 |
187.892 |
-18.565 |
-9.88 |
|
-5.23 |
| | |
|
|
|
|
|
Ryder System |
104.289 |
12/08/24 |
-1.29 |
97.051 |
7.46 |
90.916 |
6.135 |
6.75 |
|
13.95 |
| | |
|
|
|
S |
|
Old Dominion FL |
150.785 |
12/08/24 |
-1.35 |
141.356 |
6.67 |
156.530 |
-15.173 |
-9.69 |
|
-10.29 |
| | |
|
|
|
S |
|
Union Pacific |
187.275 |
12/08/24 |
-0.32 |
177.870 |
5.29 |
193.220 |
-15.350 |
-7.94 |
|
-1.66 |
| | |
|
|
|
S |
|
J.B. Hunt |
128.755 |
12/08/24 |
-0.20 |
125.520 |
2.58 |
162.255 |
-36.735 |
-22.64 |
|
-15.06 |
| | |
|
|
|
|
|
Landstar System |
146.427 |
12/08/24 |
-1.04 |
145.074 |
0.93 |
155.209 |
-10.135 |
-6.53 |
|
-1.29 |
| | |
|
|
|
|
|
Matson |
102.936 |
12/08/24 |
0.73 |
102.106 |
0.81 |
89.781 |
12.325 |
13.73 |
|
28.80 |
| | |
|
|
|
S |
|
CSX |
26.499 |
12/08/24 |
-1.47 |
26.571 |
-0.27 |
28.049 |
-1.478 |
-5.27 |
|
0.26 |
| | |
|
|
|
|
|
Expeditors Wash |
94.219 |
12/08/24 |
0.03 |
95.611 |
-1.46 |
101.027 |
-5.416 |
-5.36 |
|
0.67 |
| | |
|
|
|
|
|
Uber Technologies |
54.786 |
12/08/24 |
1.05 |
56.242 |
-2.59 |
52.787 |
3.455 |
6.54 |
|
25.53 |
| | |
|
|
|
L |
|
Kirby |
92.162 |
12/08/24 |
-0.14 |
95.754 |
-3.75 |
63.135 |
32.619 |
51.66 |
|
40.62 |
| | |
|
|
|
S |
|
FedEx |
220.815 |
12/08/24 |
0.63 |
236.264 |
-6.54 |
195.474 |
40.790 |
20.87 |
|
16.74 |
| | |
|
|
|
S |
|
UPS |
98.767 |
12/08/24 |
-0.76 |
107.540 |
-8.16 |
124.536 |
-16.996 |
-13.65 |
|
-12.57 |
| | |
|
|
|
|
|
Southwest Airlines |
20.076 |
12/08/24 |
0.20 |
22.236 |
-9.71 |
23.809 |
-1.573 |
-6.61 |
|
-4.29 |
| | |
|
|
|
S |
|
American Airlines |
7.602 |
12/08/24 |
-2.54 |
8.733 |
-12.95 |
11.774 |
-3.041 |
-25.83 |
|
-21.05 |
| | |
|
|
|
|
|
Alaska Air Group |
27.362 |
12/08/24 |
-0.26 |
31.712 |
-13.72 |
29.333 |
2.379 |
8.11 |
|
0.29 |
| | |
|
|
|
|
|
United Airlines |
31.973 |
12/08/24 |
-2.51 |
38.230 |
-16.37 |
33.171 |
5.059 |
15.25 |
|
6.73 |
| | |
|
|
|
|
|
Delta Air Lines |
30.897 |
12/08/24 |
-0.61 |
37.115 |
-16.75 |
31.595 |
5.520 |
17.47 |
|
11.49 |
| | |
|
|
|
|
|
Avis Budget |
65.742 |
12/08/24 |
-4.43 |
80.115 |
-17.94 |
138.281 |
-58.166 |
-42.06 |
|
-34.63 |
| DJTA - 20 out of 20 instruments rated - 1/07/24 / 29/01/24 - 9 did rise, Market-Ratio(22) in GBP = 45.00 % |
| Stock Exchange Currency: USD $ Dollar |
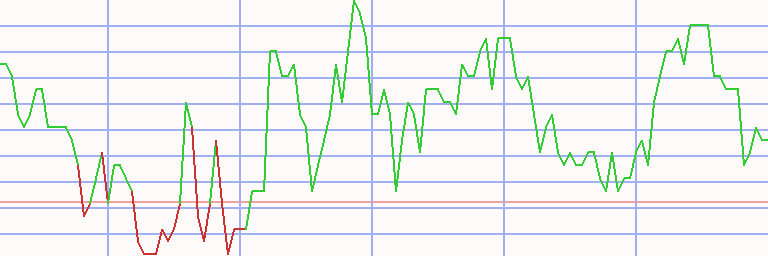
Technical Chart
Transactions Dow Jones Transportation Average in Pound sterling * L22 - 21 ex 14 (1)
|
⇐ |
| |
| L/S | date buy | date sell | days | | instrument | spl | pieces | | prc buy | prc sell | | prc diff | d % | asset | yield | | | long |
2/01/06 |
9/10/06 |
280 |
|
|
|
C.H. Robinson |
100 |
461 |
|
21.652 |
23.430 |
|
1.778 |
8 |
10,820 |
11 |
|
| 9/10/06 |
16/10/06 |
7 |
|
- cash - |
| |
16/10/06 |
3/12/07 |
413 |
|
|
|
CSX |
100 |
5,033 |
|
2.150 |
2.233 |
|
0.083 |
4 |
11,239 |
3 |
|
| 3/12/07 |
10/12/07 |
7 |
|
- cash - |
| |
10/12/07 |
17/12/07 |
7 |
|
|
|
Kirby |
100 |
459 |
|
24.474 |
23.680 |
|
-0.794 |
-3 |
10,874 |
-82 |
|
| 17/12/07 |
31/12/07 |
14 |
|
- cash - |
| |
31/12/07 |
14/01/08 |
14 |
|
|
|
Kirby |
100 |
467 |
|
23.278 |
21.107 |
|
-2.171 |
-9 |
9,861 |
-92 |
|
| 14/01/08 |
28/01/08 |
14 |
|
- cash - |
| |
28/01/08 |
29/09/08 |
245 |
|
|
|
CSX |
100 |
3,727 |
|
2.646 |
3.268 |
|
0.622 |
24 |
12,179 |
37 |
|
| 29/09/08 |
20/10/08 |
21 |
|
- cash - |
| |
20/10/08 |
12/01/09 |
84 |
|
|
|
Alaska Air Group |
100 |
3,632 |
|
3.352 |
4.874 |
|
1.522 |
45 |
17,707 |
409 |
|
| 12/01/09 |
20/04/09 |
98 |
|
- cash - |
| |
20/04/09 |
5/07/10 |
441 |
|
|
|
Avis Budget |
100 |
13,575 |
|
1.304 |
5.725 |
|
4.421 |
339 |
77,719 |
240 |
|
| |
5/07/10 |
28/03/11 |
266 |
|
|
|
United Airlines |
100 |
6,343 |
|
12.252 |
14.622 |
|
2.370 |
19 |
92,751 |
27 |
|
| |
28/03/11 |
8/08/11 |
133 |
|
|
|
Avis Budget |
100 |
8,146 |
|
11.386 |
7.261 |
|
-4.125 |
-36 |
59,150 |
-71 |
|
| 8/08/11 |
7/11/11 |
91 |
|
- cash - |
| |
7/11/11 |
21/11/11 |
14 |
|
|
|
Kirby |
100 |
1,504 |
|
39.320 |
39.075 |
|
-0.245 |
-1 |
58,782 |
-15 |
|
| 21/11/11 |
19/12/11 |
28 |
|
- cash - |
| |
19/12/11 |
22/09/14 |
1008 |
|
|
|
Alaska Air Group |
100 |
4,919 |
|
11.949 |
27.636 |
|
15.686 |
131 |
135,943 |
35 |
|
| |
22/09/14 |
1/06/15 |
252 |
|
|
|
Southwest Airlines |
100 |
6,512 |
|
20.875 |
24.907 |
|
4.032 |
19 |
162,197 |
29 |
|
| 1/06/15 |
8/06/15 |
7 |
|
- cash - |
| |
8/06/15 |
20/07/15 |
42 |
|
|
|
Matson |
100 |
5,942 |
|
27.295 |
26.905 |
|
-0.390 |
-1 |
159,882 |
-12 |
|
| 20/07/15 |
3/08/15 |
14 |
|
- cash - |
| |
3/08/15 |
24/08/15 |
21 |
|
|
|
Alaska Air Group |
100 |
3,194 |
|
50.054 |
46.334 |
|
-3.720 |
-7 |
148,001 |
-74 |
|
| 24/08/15 |
31/08/15 |
7 |
|
- cash - |
| |
31/08/15 |
28/09/15 |
28 |
|
|
|
Alaska Air Group |
100 |
3,033 |
|
48.783 |
51.480 |
|
2.698 |
6 |
156,182 |
102 |
|
| 28/09/15 |
5/10/15 |
7 |
|
- cash - |
| |
5/10/15 |
11/01/16 |
98 |
|
|
|
Alaska Air Group |
100 |
2,923 |
|
53.429 |
48.595 |
|
-4.834 |
-9 |
142,053 |
-30 |
|
| 11/01/16 |
25/01/16 |
14 |
|
- cash - |
| |
25/01/16 |
15/02/16 |
21 |
|
|
|
Delta Air Lines |
100 |
4,404 |
|
32.250 |
29.784 |
|
-2.466 |
-8 |
131,193 |
-75 |
|
| 15/02/16 |
22/02/16 |
7 |
|
- cash - |
| |
22/02/16 |
2/05/16 |
70 |
|
|
|
Delta Air Lines |
100 |
3,792 |
|
34.593 |
28.740 |
|
-5.853 |
-17 |
108,999 |
-62 |
|
| |
2/05/16 |
25/07/16 |
84 |
|
|
|
Southwest Airlines |
100 |
3,634 |
|
29.987 |
28.439 |
|
-1.548 |
-5 |
103,372 |
-21 |
|
| |
25/07/16 |
20/02/17 |
210 |
|
|
|
Avis Budget |
100 |
3,602 |
|
28.698 |
27.095 |
|
-1.602 |
-6 |
97,601 |
-10 |
|
| |
20/02/17 |
22/01/18 |
336 |
|
|
|
CSX |
100 |
7,515 |
|
12.986 |
13.778 |
|
0.792 |
6 |
103,554 |
7 |
|
| |
22/01/18 |
22/10/18 |
273 |
|
|
|
Old Dominion FL |
100 |
2,910 |
|
35.585 |
33.682 |
|
-1.903 |
-5 |
98,016 |
-7 |
|
| |
22/10/18 |
29/10/18 |
7 |
|
|
|
United Airlines |
100 |
1,435 |
|
68.276 |
66.370 |
|
-1.906 |
-3 |
95,281 |
-77 |
|
| 29/10/18 |
5/11/18 |
7 |
|
- cash - |
| |
5/11/18 |
24/12/18 |
49 |
|
|
|
United Airlines |
100 |
1,386 |
|
68.704 |
62.183 |
|
-6.521 |
-9 |
86,244 |
-52 |
|
| 24/12/18 |
11/02/19 |
49 |
|
- cash - |
| |
11/02/19 |
18/02/19 |
7 |
|
|
|
Union Pacific |
100 |
654 |
|
131.799 |
131.620 |
|
-0.179 |
0 |
86,127 |
-7 |
|
| L/S | date buy | date sell | days | | instrument | spl | pieces | | prc buy | prc sell | | prc diff | d % | asset | yield | |
| 18/02/19 |
25/02/19 |
7 |
|
- cash - |
| |
25/02/19 |
4/03/19 |
7 |
|
|
|
Union Pacific |
100 |
665 |
|
129.508 |
126.920 |
|
-2.587 |
-2 |
84,406 |
-65 |
|
| 4/03/19 |
11/03/19 |
7 |
|
- cash - |
| |
11/03/19 |
9/03/20 |
364 |
|
|
|
Union Pacific |
100 |
665 |
|
126.920 |
103.501 |
|
-23.419 |
-18 |
68,832 |
-18 |
|
| 9/03/20 |
8/06/20 |
91 |
|
- cash - |
| |
8/06/20 |
15/06/20 |
7 |
|
|
|
Old Dominion FL |
100 |
1,048 |
|
65.673 |
64.515 |
|
-1.158 |
-2 |
67,619 |
-60 |
|
| 15/06/20 |
6/07/20 |
21 |
|
- cash - |
| |
6/07/20 |
15/02/21 |
224 |
|
|
|
Old Dominion FL |
100 |
960 |
|
70.369 |
75.500 |
|
5.131 |
7 |
72,545 |
12 |
|
| |
15/02/21 |
11/10/21 |
238 |
|
|
|
Matson |
100 |
1,406 |
|
51.581 |
60.719 |
|
9.138 |
18 |
85,392 |
28 |
|
| 11/10/21 |
18/10/21 |
7 |
|
- cash - |
| |
18/10/21 |
11/04/22 |
175 |
|
|
|
Avis Budget |
100 |
740 |
|
115.253 |
196.829 |
|
81.576 |
71 |
145,759 |
205 |
|
| 11/04/22 |
25/04/22 |
14 |
|
- cash - |
| |
25/04/22 |
9/05/22 |
14 |
|
|
|
Avis Budget |
100 |
619 |
|
235.286 |
183.954 |
|
-51.332 |
-22 |
113,984 |
-100 |
|
| 9/05/22 |
16/05/22 |
7 |
|
- cash - |
| |
16/05/22 |
13/06/22 |
28 |
|
|
|
Avis Budget |
100 |
674 |
|
168.907 |
130.575 |
|
-38.332 |
-23 |
88,148 |
-97 |
|
| 13/06/22 |
8/08/22 |
56 |
|
- cash - |
| |
8/08/22 |
22/08/22 |
14 |
|
|
|
C.H. Robinson |
100 |
958 |
|
92.010 |
98.511 |
|
6.501 |
7 |
94,376 |
493 |
|
| 22/08/22 |
12/09/22 |
21 |
|
- cash - |
| |
12/09/22 |
19/09/22 |
7 |
|
|
|
Kirby |
100 |
1,587 |
|
59.468 |
58.865 |
|
-0.603 |
-1 |
93,420 |
-41 |
|
| 19/09/22 |
24/10/22 |
35 |
|
- cash - |
| |
24/10/22 |
19/12/22 |
56 |
|
|
|
Avis Budget |
100 |
477 |
|
195.798 |
141.241 |
|
-54.557 |
-28 |
67,396 |
-88 |
|
| |
19/12/22 |
4/03/24 |
441 |
|
|
|
Landstar System |
100 |
491 |
|
137.252 |
145.996 |
|
8.744 |
6 |
71,690 |
5 |
|
| |
4/03/24 |
12/08/24 |
161 |
|
|
|
Uber Technologies |
100 |
1,119 |
|
64.018 |
54.786 |
|
-9.231 |
-14 |
61,360 |
-30 |
|
| accum | 2/01/06 |
12/08/24 | 6825 |
days out of 7483 invested (91%) |
514 |
61,360 |
10 |
|
Instrument Related Contribution
| instrument | L/S | date buy | date sell | days | prc buy | prc sell | | prc diff | d % | | | total |
| Alaska Air Group | long | 20/10/08 | 12/01/09 | 84 | 3.35 | 4.87 | | 1.52 | 45.40 | | | |
| | | 19/12/11 | 22/09/14 | 1008 | 11.95 | 27.64 | | 15.69 | 131.27 | | | |
| | | 3/08/15 | 24/08/15 | 21 | 50.05 | 46.33 | | -3.72 | -7.43 | | | |
| | | 31/08/15 | 28/09/15 | 28 | 48.78 | 51.48 | | 2.70 | 5.53 | | | |
| | | 5/10/15 | 11/01/16 | 98 | 53.43 | 48.59 | | -4.83 | -9.05 | | | 198.76 |
| Avis Budget | | 20/04/09 | 5/07/10 | 441 | 1.30 | 5.73 | | 4.42 | 338.93 | | | |
| | | 28/03/11 | 8/08/11 | 133 | 11.39 | 7.26 | | -4.12 | -36.23 | | | |
| | | 25/07/16 | 20/02/17 | 210 | 28.70 | 27.10 | | -1.60 | -5.58 | | | |
| | | 18/10/21 | 11/04/22 | 175 | 115.25 | 196.83 | | 81.58 | 70.78 | | | |
| | | 25/04/22 | 9/05/22 | 14 | 235.29 | 183.95 | | -51.33 | -21.82 | | | |
| | | 16/05/22 | 13/06/22 | 28 | 168.91 | 130.58 | | -38.33 | -22.69 | | | |
| | | 24/10/22 | 19/12/22 | 56 | 195.80 | 141.24 | | -54.56 | -27.86 | | | 96.79 |
| CSX | | 16/10/06 | 3/12/07 | 413 | 2.15 | 2.23 | | 0.08 | 3.88 | | | |
| | | 28/01/08 | 29/09/08 | 245 | 2.65 | 3.27 | | 0.62 | 23.52 | | | |
| | | 20/02/17 | 22/01/18 | 336 | 12.99 | 13.78 | | 0.79 | 6.10 | | | 36.13 |
| Matson | | 8/06/15 | 20/07/15 | 42 | 27.29 | 26.91 | | -0.39 | -1.43 | | | |
| | | 15/02/21 | 11/10/21 | 238 | 51.58 | 60.72 | | 9.14 | 17.72 | | | 16.04 |
| C.H. Robinson | | 2/01/06 | 9/10/06 | 280 | 21.65 | 23.43 | | 1.78 | 8.21 | | | |
| | | 8/08/22 | 22/08/22 | 14 | 92.01 | 98.51 | | 6.50 | 7.07 | | | 15.86 |
| Southwest Airlines | | 22/09/14 | 1/06/15 | 252 | 20.87 | 24.91 | | 4.03 | 19.31 | | | |
| | | 2/05/16 | 25/07/16 | 84 | 29.99 | 28.44 | | -1.55 | -5.16 | | | 13.15 |
| Landstar System | | 19/12/22 | 4/03/24 | 441 | 137.25 | 146.00 | | 8.74 | 6.37 | | | 6.37 |
| United Airlines | | 5/07/10 | 28/03/11 | 266 | 12.25 | 14.62 | | 2.37 | 19.34 | | | |
| | | 22/10/18 | 29/10/18 | 7 | 68.28 | 66.37 | | -1.91 | -2.79 | | | |
| | | 5/11/18 | 24/12/18 | 49 | 68.70 | 62.18 | | -6.52 | -9.49 | | | 5.00 |
| instrument | L/S | date buy | date sell | days | prc buy | prc sell | | prc diff | d % | | | total |
| Old Dominion FL | | 22/01/18 | 22/10/18 | 273 | 35.58 | 33.68 | | -1.90 | -5.35 | | | |
| | | 8/06/20 | 15/06/20 | 7 | 65.67 | 64.52 | | -1.16 | -1.76 | | | |
| | | 6/07/20 | 15/02/21 | 224 | 70.37 | 75.50 | | 5.13 | 7.29 | | | -0.24 |
| Kirby | | 10/12/07 | 17/12/07 | 7 | 24.47 | 23.68 | | -0.79 | -3.24 | | | |
| | | 31/12/07 | 14/01/08 | 14 | 23.28 | 21.11 | | -2.17 | -9.33 | | | |
| | | 7/11/11 | 21/11/11 | 14 | 39.32 | 39.08 | | -0.24 | -0.62 | | | |
| | | 12/09/22 | 19/09/22 | 7 | 59.47 | 58.86 | | -0.60 | -1.01 | | | -13.70 |
| Uber Technologies | | 4/03/24 | 12/08/24 | 161 | 64.02 | 54.79 | | -9.23 | -14.42 | | | -14.42 |
| Union Pacific | | 11/02/19 | 18/02/19 | 7 | 131.80 | 131.62 | | -0.18 | -0.14 | | | |
| | | 25/02/19 | 4/03/19 | 7 | 129.51 | 126.92 | | -2.59 | -2.00 | | | |
| | | 11/03/19 | 9/03/20 | 364 | 126.92 | 103.50 | | -23.42 | -18.45 | | | -20.19 |
| Delta Air Lines | | 25/01/16 | 15/02/16 | 21 | 32.25 | 29.78 | | -2.47 | -7.65 | | | |
| | | 22/02/16 | 2/05/16 | 70 | 34.59 | 28.74 | | -5.85 | -16.92 | | | -23.27 |
Annotations
| 14/03/24 | DJTA | | | Component update: Uber Technologies replaces JetBlue Airways |
| 2/01/22 | DJTA | | | Old Dominion Freight Line replaces Kansas City Southern (acquired by CP) |
| 29/06/21 | CSX | | | stock split 1:3 (three for one) |
| 15/10/15 | DJTA | | | American Airlines replaces Con-Way |
|
|