| | |
| | |

Assessment - Insurances in Euro - 1/07/24 - RS = 13
⇐
| |
|
instrument |
freshest |
⇓ Δday |
1/07/24 |
⇓ Δwk |
1/04/24 |
prc diff |
⇓ Δ13 |
|
⇓∅-RS |
| |  |
 |
 |
|
|
 |
SOM Insurances |
318.147 |
12/08/24 |
0.30 |
325.136 |
-2.15 |
320.984 |
4.151 |
1.29 |
|
11.10 |
| | |
|
|
|
|
|
Admiral Group |
3,179.841 |
12/08/24 |
0.86 |
3,033.696 |
4.82 |
3,313.943 |
-280.247 |
-8.46 |
|
3.91 |
| | |
|
|
|
|
|
Aegon |
5.562 |
12/08/24 |
0.22 |
5.856 |
-5.02 |
5.650 |
0.206 |
3.65 |
|
11.53 |
| | |
|
|
|
|
|
Ageas |
42.380 |
12/08/24 |
0.33 |
43.100 |
-1.67 |
42.920 |
0.180 |
0.42 |
|
6.75 |
| | |
|
|
|
L |
|
AIA |
6.196 |
12/08/24 |
-1.33 |
6.327 |
-2.08 |
6.252 |
0.075 |
1.20 |
|
-16.94 |
| | |
|
|
|
|
|
Allianz |
255.900 |
12/08/24 |
|
262.500 |
-2.51 |
277.800 |
-15.300 |
-5.51 |
|
7.44 |
| | |
|
|
|
|
|
AIG |
66.762 |
12/08/24 |
-0.62 |
69.447 |
-3.87 |
72.260 |
-2.813 |
-3.89 |
|
12.82 |
| | |
|
|
|
|
|
ASR |
43.850 |
12/08/24 |
0.46 |
44.820 |
-2.16 |
45.390 |
-0.570 |
-1.26 |
|
5.38 |
| | |
|
|
|
|
|
Aviva |
570.674 |
12/08/24 |
0.35 |
561.010 |
1.72 |
580.086 |
-19.076 |
-3.29 |
|
13.17 |
| | |
|
|
|
|
|
Axa |
32.350 |
12/08/24 |
-0.77 |
31.260 |
3.49 |
34.815 |
-3.555 |
-10.21 |
|
0.60 |
| | |
|
|
|
|
|
Beazley |
862.729 |
12/08/24 |
1.24 |
809.103 |
6.63 |
777.381 |
31.723 |
4.08 |
|
20.09 |
| | |
|
|
|
|
|
Berkshire Hathaway |
401.251 |
12/08/24 |
-0.30 |
377.757 |
6.22 |
391.080 |
-13.323 |
-3.41 |
|
9.61 |
| | |
|
|
|
L |
|
China Life |
3.775 |
12/08/24 |
0.44 |
4.013 |
-5.93 |
3.790 |
0.223 |
5.89 |
|
-0.48 |
| | |
|
|
|
L |
|
China Life Ins HK |
1.239 |
12/08/24 |
0.58 |
1.318 |
-5.98 |
1.117 |
0.201 |
17.97 |
|
4.34 |
| | |
|
|
|
L |
|
China Pacific Ins |
3.506 |
12/08/24 |
0.22 |
3.654 |
-4.03 |
3.055 |
0.599 |
19.60 |
|
9.44 |
| | |
|
|
|
|
|
Dai-ichi Life |
21.944 |
9/08/24 |
3.15 |
25.729 |
-14.71 |
23.188 |
2.541 |
10.96 |
|
29.20 |
| | |
|
|
|
|
|
FBD |
12.900 |
12/08/24 |
0.39 |
13.100 |
-1.53 |
13.200 |
-0.100 |
-0.76 |
|
2.21 |
| | |
|
|
|
|
|
Generali |
22.450 |
12/08/24 |
1.35 |
23.930 |
-6.18 |
23.460 |
0.470 |
2.00 |
|
12.54 |
| | |
|
|
|
L |
|
Glanbia |
18.110 |
12/08/24 |
0.50 |
18.230 |
-0.66 |
18.280 |
-0.050 |
-0.27 |
|
19.83 |
| | |
|
|
|
|
|
Hannover Rück |
227.400 |
12/08/24 |
5.23 |
240.900 |
-5.60 |
253.700 |
-12.800 |
-5.05 |
|
6.49 |
| | |
|
|
|
|
|
HDFC Life |
7.851 |
12/08/24 |
0.01 |
6.714 |
16.93 |
7.087 |
-0.372 |
-5.26 |
|
-2.63 |
| | |
|
|
|
|
|
Hiscox |
1,401.346 |
12/08/24 |
1.89 |
1,336.523 |
4.85 |
1,448.463 |
-111.939 |
-7.73 |
|
7.18 |
| | |
|
|
|
|
|
Insurance Australia |
4.439 |
12/08/24 |
0.56 |
4.408 |
0.70 |
3.865 |
0.543 |
14.06 |
|
21.65 |
| | |
|
|
|
S |
|
Legal & General |
265.890 |
12/08/24 |
0.53 |
269.780 |
-1.44 |
297.168 |
-27.389 |
-9.22 |
|
-1.25 |
| | |
|
|
|
|
|
Lowe´s |
215.426 |
12/08/24 |
-2.02 |
199.101 |
8.20 |
232.005 |
-32.904 |
-14.18 |
|
-2.14 |
| |
|
instrument |
freshest |
⇓ Δday |
1/07/24 |
⇓ Δwk |
1/04/24 |
prc diff |
⇓ Δ13 |
|
⇓∅-RS |
| | |
|
|
|
|
|
Mandatum |
4.220 |
12/08/24 |
|
4.227 |
-0.17 |
4.145 |
0.083 |
1.99 |
|
-na- |
| | |
|
|
|
|
|
Manulife Financial |
23.284 |
12/08/24 |
-0.35 |
24.716 |
-5.79 |
22.880 |
1.835 |
8.02 |
|
27.13 |
| | |
|
|
|
|
|
Mapfre |
2.134 |
12/08/24 |
|
2.172 |
-1.75 |
2.342 |
-0.170 |
-7.26 |
|
6.36 |
| | |
|
|
|
|
|
Medibank Private |
2.406 |
12/08/24 |
0.52 |
2.288 |
5.15 |
2.271 |
0.017 |
0.76 |
|
4.99 |
| | |
|
|
|
|
|
MetLife |
65.121 |
12/08/24 |
-0.40 |
65.149 |
-0.04 |
68.583 |
-3.434 |
-5.01 |
|
7.22 |
| | |
|
|
|
S |
|
Molina Healthcare |
314.809 |
12/08/24 |
-0.15 |
272.380 |
15.58 |
376.189 |
-103.809 |
-27.59 |
|
-14.67 |
| | |
|
|
|
|
|
MS&AD Insurance |
17.385 |
9/08/24 |
-0.50 |
21.424 |
-18.85 |
16.048 |
5.376 |
33.50 |
|
65.79 |
| | |
|
|
|
L |
|
Münchener Rück |
439.200 |
12/08/24 |
1.01 |
466.900 |
-5.93 |
452.300 |
14.600 |
3.23 |
|
18.31 |
| | |
|
|
|
|
|
NN |
44.660 |
12/08/24 |
0.74 |
43.940 |
1.64 |
42.820 |
1.120 |
2.62 |
|
14.52 |
| | |
|
|
|
|
|
Phoenix |
634.083 |
12/08/24 |
0.47 |
627.600 |
1.03 |
645.500 |
-17.900 |
-2.77 |
|
6.75 |
| | |
|
|
|
L |
|
Ping An |
4.017 |
12/08/24 |
0.45 |
4.226 |
-4.94 |
3.932 |
0.294 |
7.48 |
|
-8.05 |
| | |
|
|
|
L |
|
Ping An Ins |
5.200 |
12/08/24 |
0.02 |
5.328 |
-2.40 |
5.312 |
0.016 |
0.30 |
|
-4.73 |
| | |
|
|
|
|
|
Prudential |
748.877 |
12/08/24 |
0.41 |
841.750 |
-11.03 |
867.910 |
-26.159 |
-3.01 |
|
-15.23 |
| | |
|
|
|
L |
|
QBE Insurance |
10.038 |
12/08/24 |
0.87 |
10.577 |
-5.10 |
10.948 |
-0.371 |
-3.39 |
|
8.96 |
| | |
|
|
|
|
|
Quálitas |
8.349 |
12/08/24 |
-2.49 |
9.581 |
-12.86 |
10.937 |
-1.356 |
-12.40 |
|
11.45 |
| | |
|
|
|
|
|
Sampo |
40.490 |
12/08/24 |
0.40 |
40.180 |
0.77 |
39.515 |
0.665 |
1.68 |
|
-2.21 |
| | |
|
|
|
|
|
Samsung F&M Ins |
238.994 |
12/08/24 |
1.00 |
250.792 |
-4.70 |
209.723 |
41.069 |
19.58 |
|
31.80 |
| | |
|
|
|
|
|
Samsung Life |
60.473 |
12/08/24 |
-0.33 |
58.990 |
2.51 |
62.917 |
-3.927 |
-6.24 |
|
12.57 |
| | |
|
|
|
|
|
SBI Life |
19.056 |
12/08/24 |
-1.17 |
16.786 |
13.53 |
16.635 |
0.151 |
0.91 |
|
8.45 |
| | |
|
|
|
S |
|
Scor |
17.130 |
12/08/24 |
1.06 |
24.160 |
-29.10 |
32.070 |
-7.910 |
-24.66 |
|
-11.76 |
| | |
|
|
|
|
|
Sompo |
17.071 |
9/08/24 |
0.02 |
20.109 |
-15.11 |
18.522 |
1.587 |
8.57 |
|
30.58 |
| | |
|
|
|
L |
|
Storebrand |
9.258 |
12/08/24 |
0.38 |
9.538 |
-2.93 |
8.495 |
1.043 |
12.28 |
|
17.91 |
| | |
|
|
|
S |
|
Sun Life Financial |
44.736 |
12/08/24 |
-0.11 |
45.510 |
-1.70 |
50.209 |
-4.699 |
-9.36 |
|
-3.15 |
| | |
|
|
|
|
|
Swiss Life |
672.891 |
12/08/24 |
0.62 |
690.431 |
-2.54 |
650.525 |
39.905 |
6.13 |
|
12.83 |
| | |
|
|
|
|
|
Swiss Re |
107.299 |
12/08/24 |
0.10 |
115.966 |
-7.47 |
119.311 |
-3.345 |
-2.80 |
|
12.97 |
| |
|
instrument |
freshest |
⇓ Δday |
1/07/24 |
⇓ Δwk |
1/04/24 |
prc diff |
⇓ Δ13 |
|
⇓∅-RS |
| | |
|
|
|
|
|
Talanx |
66.500 |
12/08/24 |
1.92 |
75.050 |
-11.39 |
73.400 |
1.650 |
2.25 |
|
14.33 |
| | |
|
|
|
|
|
Travelers Companies |
195.531 |
12/08/24 |
-1.29 |
189.228 |
3.33 |
212.349 |
-23.120 |
-10.89 |
|
8.72 |
| | |
|
|
|
|
|
Tryg |
19.926 |
12/08/24 |
0.61 |
20.530 |
-2.94 |
19.066 |
1.464 |
7.68 |
|
8.80 |
| | |
|
|
|
|
|
Uniqa |
7.680 |
12/08/24 |
0.26 |
8.000 |
-4.00 |
8.010 |
-0.010 |
-0.12 |
|
-0.68 |
| | |
|
|
|
S |
|
UnitedHealth |
527.018 |
12/08/24 |
1.17 |
461.161 |
14.28 |
455.764 |
5.397 |
1.18 |
|
-1.17 |
| | |
|
|
|
|
|
Vienna Insurance |
29.800 |
12/08/24 |
1.36 |
30.600 |
-2.61 |
28.900 |
1.700 |
5.88 |
|
7.92 |
| | |
|
|
|
L |
|
Zurich Insurance |
479.443 |
12/08/24 |
0.85 |
498.117 |
-3.75 |
500.396 |
-2.279 |
-0.46 |
|
8.61 |
| | |
|
|
|
L |
|
DFV |
6.200 |
12/08/24 |
-0.80 |
7.250 |
-14.48 |
5.680 |
1.570 |
27.64 |
|
17.67 |
| Insurances - 57 out of 57 instruments rated - 1/07/24 / 1/04/24 - 29 did rise, Market-Ratio(13) in EUR = 50.88 % |
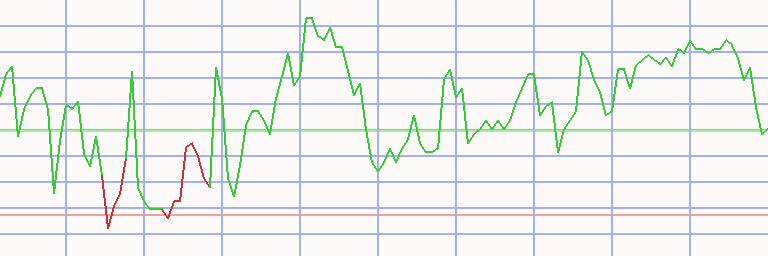
Technical Chart
Transactions Insurances in Euro * A13 - 49/16 (1)
|
⇐ |
| |
| L/S | date buy | date sell | days | | instrument | spl | pieces | | prc buy | prc sell | ps short | prc diff | d % | asset | yield | |
| 2/01/06 |
7/08/06 |
217 |
|
- cash - |
| short |
7/08/06 |
21/08/06 |
14 |
|
|
|
Glanbia |
100 |
4,694 |
|
2.130 |
2.267 |
1.993 |
-0.137 |
-6 |
9,357 |
-82 |
|
| long |
21/08/06 |
7/01/08 |
504 |
|
|
|
China Life Ins HK |
100 |
6,996 |
|
1.337 |
3.267 |
|
1.930 |
144 |
22,859 |
91 |
|
| short |
7/01/08 |
21/04/08 |
105 |
|
|
|
Storebrand |
100 |
3,800 |
|
6.015 |
5.397 |
6.703 |
0.688 |
11 |
25,475 |
46 |
|
| long |
21/04/08 |
30/06/08 |
70 |
|
|
|
Glanbia |
100 |
5,125 |
|
4.970 |
4.820 |
|
-0.150 |
-3 |
24,706 |
-15 |
|
| short |
30/06/08 |
26/01/09 |
210 |
|
|
|
AIG |
100 |
73 |
|
335.064 |
19.403 |
5,786.250 |
5,451.186 |
1,627 |
422,643 |
14,041 |
|
| long |
26/01/09 |
14/06/10 |
504 |
|
|
|
Admiral Group |
100 |
43,456 |
|
9.726 |
16.519 |
|
6.793 |
70 |
717,828 |
47 |
|
| short |
14/06/10 |
23/08/10 |
70 |
|
|
|
UnipolSai |
100 |
60,652 |
|
11.835 |
10.585 |
13.233 |
1.398 |
12 |
802,595 |
79 |
|
| long |
23/08/10 |
20/06/11 |
301 |
|
|
|
Admiral Group |
100 |
44,466 |
|
18.050 |
18.954 |
|
0.905 |
5 |
842,827 |
6 |
|
| short |
20/06/11 |
7/11/11 |
140 |
|
|
|
UnipolSai |
100 |
130,367 |
|
6.465 |
3.629 |
11.517 |
5.052 |
78 |
1,501,480 |
351 |
|
| long |
7/11/11 |
24/08/15 |
1386 |
|
|
|
Glanbia |
100 |
328,192 |
|
4.575 |
17.150 |
|
12.575 |
275 |
5,628,495 |
42 |
|
| short |
24/08/15 |
23/11/15 |
91 |
|
|
|
FBD |
100 |
1,041,927 |
|
5.402 |
6.706 |
4.098 |
-1.304 |
-24 |
4,269,822 |
-67 |
|
| long |
23/11/15 |
25/01/16 |
63 |
|
|
|
NN |
100 |
131,177 |
|
32.550 |
31.080 |
|
-1.470 |
-5 |
4,076,992 |
-23 |
|
| short |
25/01/16 |
18/04/16 |
84 |
|
|
|
Delta Lloyd |
100 |
813,608 |
|
5.011 |
4.530 |
5.543 |
0.532 |
11 |
4,509,913 |
55 |
|
| long |
18/04/16 |
27/06/16 |
70 |
|
|
|
Medibank Private |
100 |
2,151,641 |
|
2.096 |
1.965 |
|
-0.131 |
-6 |
4,227,645 |
-29 |
|
| short |
27/06/16 |
8/08/16 |
42 |
|
|
|
Delta Lloyd |
100 |
1,338,285 |
|
3.159 |
3.293 |
3.025 |
-0.134 |
-4 |
4,048,314 |
-31 |
|
| long |
8/08/16 |
17/12/18 |
861 |
|
|
|
Admiral Group |
100 |
155,021 |
|
26.115 |
21.776 |
|
-4.339 |
-17 |
3,375,684 |
-7 |
|
| short |
17/12/18 |
28/01/19 |
42 |
|
|
|
AMP |
100 |
2,261,393 |
|
1.493 |
1.466 |
1.520 |
0.027 |
2 |
3,436,413 |
17 |
|
| long |
28/01/19 |
2/03/20 |
399 |
|
|
|
Molina Healthcare |
100 |
28,872 |
|
119.019 |
114.028 |
|
-4.991 |
-4 |
3,292,316 |
-4 |
|
| short |
2/03/20 |
8/06/20 |
98 |
|
|
|
Hanwha Life |
100 |
2713,399,922 |
|
0.001 |
0.001 |
0.001 |
-0.000 |
-1 |
3,256,080 |
-4 |
|
| long |
8/06/20 |
9/05/22 |
700 |
|
|
|
DFV |
100 |
184,941 |
|
17.606 |
11.640 |
|
-5.966 |
-34 |
2,152,722 |
-19 |
|
| short |
9/05/22 |
6/06/22 |
28 |
|
|
|
Prudential |
100 |
209,209 |
|
10.290 |
12.468 |
8.111 |
-2.179 |
-21 |
1,696,945 |
-96 |
|
| long |
6/06/22 |
18/07/22 |
42 |
|
|
|
Sompo |
100 |
11,921,990 |
|
0.142 |
0.140 |
|
-0.003 |
-2 |
1,666,528 |
-15 |
|
| short |
18/07/22 |
12/09/22 |
56 |
|
|
|
Admiral Group |
100 |
81,379 |
|
20.478 |
26.217 |
14.740 |
-5.738 |
-28 |
1,199,544 |
-88 |
|
| long |
12/09/22 |
12/08/24 |
700 |
|
|
|
Molina Healthcare |
100 |
3,484 |
|
344.295 |
314.809 |
|
-29.487 |
-9 |
1,096,812 |
-5 |
|
| accum | 7/08/06 |
12/08/24 | 7281 |
days out of 7498 invested (97%) |
10,868 |
1,096,812 |
27 |
|
Instrument Related Contribution
| instrument | L/S | date buy | date sell | days | prc buy | prc sell | ps short | prc diff | d % | | | total |
| AIG | short | 30/06/08 | 26/01/09 | 210 | 335.06 | 19.40 | 5,786.25 | 5,451.19 | 1,626.91 | | | 1,626.91 |
| Glanbia | short | 7/08/06 | 21/08/06 | 14 | 2.13 | 2.27 | 1.99 | -0.14 | -6.43 | | | |
| | long | 21/04/08 | 30/06/08 | 70 | 4.97 | 4.82 | | -0.15 | -3.02 | | | |
| | long | 7/11/11 | 24/08/15 | 1386 | 4.58 | 17.15 | | 12.58 | 274.86 | | | 240.17 |
| China Life Ins HK | long | 21/08/06 | 7/01/08 | 504 | 1.34 | 3.27 | | 1.93 | 144.31 | | | 144.31 |
| UnipolSai | short | 14/06/10 | 23/08/10 | 70 | 11.84 | 10.59 | 13.23 | 1.40 | 11.81 | | | |
| | short | 20/06/11 | 7/11/11 | 140 | 6.47 | 3.63 | 11.52 | 5.05 | 78.15 | | | 99.19 |
| Storebrand | short | 7/01/08 | 21/04/08 | 105 | 6.01 | 5.40 | 6.70 | 0.69 | 11.44 | | | 11.44 |
| Admiral Group | long | 26/01/09 | 14/06/10 | 504 | 9.73 | 16.52 | | 6.79 | 69.84 | | | |
| | long | 23/08/10 | 20/06/11 | 301 | 18.05 | 18.95 | | 0.90 | 5.01 | | | |
| | long | 8/08/16 | 17/12/18 | 861 | 26.11 | 21.78 | | -4.34 | -16.62 | | | |
| | short | 18/07/22 | 12/09/22 | 56 | 20.48 | 26.22 | 14.74 | -5.74 | -28.02 | | | 7.05 |
| Delta Lloyd | short | 25/01/16 | 18/04/16 | 84 | 5.01 | 4.53 | 5.54 | 0.53 | 10.62 | | | |
| | short | 27/06/16 | 8/08/16 | 42 | 3.16 | 3.29 | 3.03 | -0.13 | -4.24 | | | 5.93 |
| AMP | short | 17/12/18 | 28/01/19 | 42 | 1.49 | 1.47 | 1.52 | 0.03 | 1.80 | | | 1.80 |
| Hanwha Life | short | 2/03/20 | 8/06/20 | 98 | 0.00 | 0.00 | 0.00 | -0.00 | -1.10 | | | -1.10 |
| Sompo | long | 6/06/22 | 18/07/22 | 42 | 0.14 | 0.14 | | -0.00 | -1.79 | | | -1.79 |
| NN | long | 23/11/15 | 25/01/16 | 63 | 32.55 | 31.08 | | -1.47 | -4.52 | | | -4.52 |
| Medibank Private | long | 18/04/16 | 27/06/16 | 70 | 2.10 | 1.96 | | -0.13 | -6.26 | | | -6.26 |
| Molina Healthcare | long | 28/01/19 | 2/03/20 | 399 | 119.02 | 114.03 | | -4.99 | -4.19 | | | |
| | long | 12/09/22 | 12/08/24 | 700 | 344.30 | 314.81 | | -29.49 | -8.56 | | | -12.40 |
| Prudential | short | 9/05/22 | 6/06/22 | 28 | 10.29 | 12.47 | 8.11 | -2.18 | -21.17 | | | -21.17 |
| FBD | short | 24/08/15 | 23/11/15 | 91 | 5.40 | 6.71 | 4.10 | -1.30 | -24.14 | | | -24.14 |
| DFV | long | 8/06/20 | 9/05/22 | 700 | 17.61 | 11.64 | | -5.97 | -33.89 | | | -33.89 |
Annotations
| 28/03/24 | MS&AD Insurance | | | stock split 1:3 (three for one) |
| | Sompo | | | stock split 1:3 (three for one) |
| 25/08/15 | NN | | | recording started |
| 27/07/15 | Ping An HK | | | forward stock split 10:20 (twenty for ten) |
| | Ping An Ins | | | forward stock split 10:20 (twenty for ten) |
| 18/05/15 | Tryg | | | forward stock split 1:5 (five for one) |
| 12/03/15 | Insurances | | | first full analysis,
the techniques are strongly influenced by the shorts of AIG and UnipolSai. |
|
|