| | Fri, Jul 31st, 2026, 18:05UTC |
| | |

Assessment - CAC Next 20 in Dollar - 10/15/18 - RS = 31
⇐
| |
|
instrument |
freshest |
⇓ Δday |
10/15/18 |
⇓ Δwk |
3/12/18 |
prc diff |
⇓ Δ31 |
|
⇓∅-RS |
| |  |
 |
 |
|
|
 |
CAC Next 20 |
19,757.302 |
8/12/24 |
-0.27 |
19,452.965 |
|
20,397.961 |
-944.996 |
-4.63 |
|
-2.84 |
| | |
|
|
|
|
|
Accor |
38.935 |
8/12/24 |
-0.74 |
47.901 |
|
56.911 |
-9.010 |
-15.83 |
|
-8.55 |
| | |
|
|
|
|
|
Air France-KLM |
8.880 |
8/12/24 |
-0.44 |
92.275 |
|
117.002 |
-24.727 |
-21.13 |
|
-16.22 |
| | |
|
|
|
S |
|
Arkema |
90.408 |
8/12/24 |
-1.39 |
111.876 |
|
134.386 |
-22.510 |
-16.75 |
|
-10.51 |
| | |
|
|
|
S |
|
bioMérieux |
112.097 |
8/12/24 |
-0.67 |
73.301 |
|
82.728 |
-9.427 |
-11.40 |
|
-13.70 |
| | |
|
|
|
|
|
Bureau Veritas |
32.429 |
8/12/24 |
-0.50 |
22.100 |
|
27.506 |
-5.406 |
-19.65 |
|
-16.41 |
| | |
|
|
|
S |
|
Eiffage |
104.430 |
8/12/24 |
-0.60 |
103.433 |
|
113.230 |
-9.797 |
-8.65 |
|
-7.57 |
| | |
|
|
|
|
|
Euronext |
107.341 |
8/12/24 |
1.26 |
62.688 |
|
75.577 |
-12.888 |
-17.05 |
|
-3.59 |
| | |
|
|
|
|
|
Forvia |
10.631 |
8/12/24 |
0.17 |
51.670 |
|
82.950 |
-31.280 |
-37.71 |
|
-30.86 |
| | |
|
|
|
|
|
Gecina |
107.979 |
8/12/24 |
-0.64 |
150.777 |
|
172.113 |
-21.336 |
-12.40 |
|
-12.34 |
| | |
|
|
|
|
|
Getlink |
18.447 |
8/12/24 |
-0.03 |
12.364 |
|
14.832 |
-2.468 |
-16.64 |
|
-7.58 |
| | |
|
|
|
L |
|
Klépierre |
30.526 |
8/12/24 |
-0.45 |
32.916 |
|
43.472 |
-10.556 |
-24.28 |
|
-16.90 |
| | |
|
|
|
|
|
Pluxee |
23.765 |
8/12/24 |
2.35 |
|
|
|
|
|
|
-na- |
| | |
|
|
|
|
|
Rémy Cointreau |
80.665 |
8/12/24 |
-2.25 |
116.214 |
|
141.537 |
-25.323 |
-17.89 |
|
-14.76 |
| | |
|
|
|
|
|
Rexel |
25.330 |
8/12/24 |
-1.22 |
13.396 |
|
17.828 |
-4.432 |
-24.86 |
|
-17.98 |
| | |
|
|
|
S |
|
Sartorius Stedim |
199.837 |
8/12/24 |
-1.54 |
117.490 |
|
90.988 |
26.502 |
29.13 |
|
29.54 |
| | |
|
|
|
L |
|
Sodexo |
100.092 |
8/12/24 |
0.52 |
73.440 |
|
91.087 |
-17.647 |
-19.37 |
|
-10.16 |
| | |
|
|
|
|
|
Soitec |
123.057 |
8/12/24 |
0.66 |
67.096 |
|
81.371 |
-14.276 |
-17.54 |
|
-14.67 |
| | |
|
|
|
L |
|
Solvay |
35.479 |
8/12/24 |
-1.83 |
121.549 |
|
143.756 |
-22.207 |
-15.45 |
|
-11.39 |
| | |
|
|
|
L |
|
Ubisoft |
19.868 |
8/12/24 |
1.36 |
100.185 |
|
88.350 |
11.836 |
13.40 |
|
8.82 |
| | |
|
|
|
|
|
Valeo |
10.902 |
8/12/24 |
-0.95 |
37.195 |
|
67.760 |
-30.565 |
-45.11 |
|
-39.16 |
| | |
|
|
|
L |
|
Worldline |
9.056 |
8/12/24 |
-0.79 |
50.499 |
|
53.434 |
-2.935 |
-5.49 |
|
-6.37 |
| CAC Next 20 - 20 out of 21 instruments rated - 10/15/18 / 3/12/18 - 2 did rise, Market-Ratio(31) in USD = 10.00 % |
| Stock Exchange Currency: EUR € Euro |
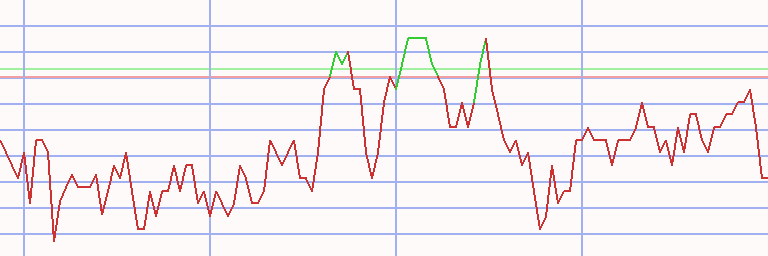
Technical Chart
Transactions CAC Next 20 in Dollar * A31 - 73/70 (1)
|
⇐ |
| |
| L/S | date buy | date sell | days | | instrument | spl | pieces | | prc buy | prc sell | ps short | prc diff | d % | asset | yield | |
| 1/02/06 |
5/08/06 |
126 |
|
- cash - |
| short |
5/08/06 |
12/18/06 |
224 |
|
|
|
Thales |
100 |
229 |
|
43.663 |
48.422 |
38.904 |
-4.759 |
-11 |
8,910 |
-17 |
|
| long |
12/18/06 |
7/23/07 |
217 |
|
|
|
Hermes International |
100 |
74 |
|
119.355 |
106.661 |
|
-12.694 |
-11 |
7,971 |
-17 |
|
| short |
7/23/07 |
6/01/09 |
679 |
|
|
|
Natixis |
100 |
498 |
|
15.991 |
2.094 |
122.112 |
106.121 |
664 |
60,819 |
198 |
|
| long |
6/01/09 |
6/08/09 |
7 |
|
|
|
Iliad |
100 |
543 |
|
111.954 |
102.225 |
|
-9.729 |
-9 |
55,536 |
-99 |
|
| short |
6/08/09 |
7/27/09 |
49 |
|
|
|
Getlink |
100 |
9,511 |
|
5.839 |
6.089 |
5.588 |
-0.251 |
-4 |
53,153 |
-28 |
|
| long |
7/27/09 |
8/10/09 |
14 |
|
|
|
Atos |
100 |
1,338 |
|
39.707 |
46.573 |
|
6.866 |
17 |
62,339 |
6,295 |
|
| short |
8/10/09 |
8/24/09 |
14 |
|
|
|
EDF |
100 |
1,297 |
|
48.055 |
52.938 |
43.173 |
-4.883 |
-10 |
56,006 |
-94 |
|
| long |
8/24/09 |
5/10/10 |
259 |
|
|
|
Arkema |
100 |
1,655 |
|
33.832 |
37.125 |
|
3.293 |
10 |
61,456 |
14 |
|
| short |
5/10/10 |
12/06/10 |
210 |
|
|
|
Thales |
100 |
1,732 |
|
35.466 |
37.876 |
33.056 |
-2.410 |
-7 |
57,282 |
-12 |
|
| long |
12/06/10 |
6/20/11 |
196 |
|
|
|
Arkema |
100 |
827 |
|
69.260 |
93.865 |
|
24.605 |
36 |
77,630 |
76 |
|
| short |
6/20/11 |
6/27/11 |
7 |
|
|
|
EDF |
100 |
2,090 |
|
37.143 |
36.615 |
37.679 |
0.536 |
1 |
78,750 |
111 |
|
| long |
6/27/11 |
7/11/11 |
14 |
|
|
|
Arkema |
100 |
852 |
|
92.377 |
94.953 |
|
2.576 |
3 |
80,944 |
105 |
|
| short |
7/11/11 |
3/12/12 |
245 |
|
|
|
Natixis |
100 |
17,437 |
|
4.642 |
3.570 |
6.035 |
1.393 |
30 |
105,238 |
48 |
|
| long |
3/12/12 |
5/28/12 |
77 |
|
|
|
Gemalto |
100 |
1,708 |
|
61.608 |
62.571 |
|
0.963 |
2 |
106,883 |
8 |
|
| short |
5/28/12 |
6/18/12 |
21 |
|
|
|
Natixis |
100 |
44,486 |
|
2.403 |
2.508 |
2.297 |
-0.106 |
-4 |
102,178 |
-54 |
|
| long |
6/18/12 |
10/01/12 |
105 |
|
|
|
Gemalto |
100 |
1,519 |
|
67.223 |
89.330 |
|
22.108 |
33 |
135,759 |
169 |
|
| short |
10/01/12 |
12/10/12 |
70 |
|
|
|
Hermes International |
100 |
499 |
|
271.861 |
304.431 |
239.292 |
-32.570 |
-12 |
119,507 |
-49 |
|
| long |
12/10/12 |
9/30/13 |
294 |
|
|
|
Gemalto |
100 |
1,247 |
|
95.815 |
107.610 |
|
11.795 |
12 |
134,215 |
16 |
|
| short |
9/30/13 |
10/07/13 |
7 |
|
|
|
SES |
100 |
4,680 |
|
28.675 |
28.541 |
28.810 |
0.135 |
0 |
134,846 |
28 |
|
| long |
10/07/13 |
10/28/13 |
21 |
|
|
|
EDF |
100 |
4,179 |
|
32.261 |
35.256 |
|
2.995 |
9 |
147,360 |
368 |
|
| short |
10/28/13 |
11/11/13 |
14 |
|
|
|
STMicroelectronics |
100 |
19,108 |
|
7.712 |
7.580 |
7.846 |
0.134 |
2 |
149,928 |
57 |
|
| long |
11/11/13 |
12/09/13 |
28 |
|
|
|
EDF |
100 |
4,320 |
|
34.700 |
36.601 |
|
1.901 |
5 |
158,139 |
100 |
|
| short |
12/09/13 |
1/13/14 |
35 |
|
|
|
STMicroelectronics |
100 |
21,119 |
|
7.488 |
7.880 |
7.096 |
-0.392 |
-5 |
149,862 |
-43 |
|
| long |
1/13/14 |
6/23/14 |
161 |
|
|
|
Natixis |
100 |
23,152 |
|
6.473 |
6.621 |
|
0.148 |
2 |
153,294 |
5 |
|
| short |
6/23/14 |
1/26/15 |
217 |
|
|
|
Arkema |
100 |
1,594 |
|
96.119 |
70.497 |
131.053 |
34.934 |
36 |
208,979 |
68 |
|
| L/S | date buy | date sell | days | | instrument | spl | pieces | | prc buy | prc sell | ps short | prc diff | d % | asset | yield | | | long |
1/26/15 |
8/24/15 |
210 |
|
|
|
Ingenico |
100 |
2,002 |
|
104.375 |
129.277 |
|
24.903 |
24 |
258,834 |
45 |
|
| short |
8/24/15 |
1/30/17 |
525 |
|
|
|
Casino Guichard |
100 |
39 |
|
6,534.108 |
5,322.975 |
8,020.809 |
1,486.701 |
23 |
316,816 |
15 |
|
| long |
1/30/17 |
2/06/17 |
7 |
|
|
|
STMicroelectronics |
100 |
23,712 |
|
13.361 |
14.178 |
|
0.817 |
6 |
336,189 |
2,108 |
|
| short |
2/06/17 |
2/13/17 |
7 |
|
|
|
SES |
100 |
17,458 |
|
19.257 |
20.473 |
18.041 |
-1.216 |
-6 |
314,959 |
-97 |
|
| long |
2/13/17 |
2/20/17 |
7 |
|
|
|
STMicroelectronics |
100 |
23,019 |
|
13.682 |
14.382 |
|
0.700 |
5 |
331,079 |
1,250 |
|
| short |
2/20/17 |
4/03/17 |
42 |
|
|
|
EDF |
100 |
34,478 |
|
9.602 |
8.397 |
10.981 |
1.378 |
14 |
378,593 |
221 |
|
| long |
4/03/17 |
11/13/17 |
224 |
|
|
|
STMicroelectronics |
100 |
24,829 |
|
15.247 |
23.772 |
|
8.524 |
56 |
590,238 |
106 |
|
| short |
11/13/17 |
3/12/18 |
119 |
|
|
|
SES |
100 |
40,119 |
|
14.712 |
15.658 |
13.766 |
-0.946 |
-6 |
552,294 |
-18 |
|
| long |
3/12/18 |
5/28/18 |
77 |
|
|
|
Dassault Systèmes |
100 |
20,178 |
|
27.370 |
26.983 |
|
-0.387 |
-1 |
544,477 |
-7 |
|
| short |
5/28/18 |
7/15/19 |
413 |
|
|
|
Air France-KLM |
100 |
6,407 |
|
84.973 |
98.682 |
71.264 |
-13.709 |
-16 |
456,644 |
-14 |
|
| long |
7/15/19 |
7/22/19 |
7 |
|
|
|
Ingenico |
100 |
5,119 |
|
89.199 |
89.023 |
|
-0.176 |
0 |
455,745 |
-10 |
|
| short |
7/22/19 |
7/29/19 |
7 |
|
|
|
Natixis |
100 |
109,651 |
|
4.156 |
4.171 |
4.142 |
-0.014 |
0 |
454,178 |
-16 |
|
| long |
7/29/19 |
8/12/19 |
14 |
|
|
|
Ingenico |
100 |
4,776 |
|
95.095 |
92.764 |
|
-2.331 |
-2 |
443,046 |
-48 |
|
| short |
8/12/19 |
10/28/19 |
77 |
|
|
|
Natixis |
100 |
108,548 |
|
4.082 |
4.612 |
3.551 |
-0.531 |
-13 |
385,436 |
-48 |
|
| long |
10/28/19 |
11/04/19 |
7 |
|
|
|
Ingenico |
100 |
3,646 |
|
105.714 |
106.586 |
|
0.872 |
1 |
388,615 |
53 |
|
| short |
11/04/19 |
12/16/19 |
42 |
|
|
|
Ubisoft |
100 |
6,693 |
|
58.063 |
68.473 |
47.653 |
-10.410 |
-18 |
318,940 |
-82 |
|
| long |
12/16/19 |
1/13/20 |
28 |
|
|
|
Ingenico |
100 |
3,026 |
|
105.374 |
109.494 |
|
4.120 |
4 |
331,408 |
65 |
|
| short |
1/13/20 |
1/20/20 |
7 |
|
|
|
SES |
100 |
23,308 |
|
14.219 |
14.219 |
14.219 |
-0.000 |
0 |
331,407 |
0 |
|
| long |
1/20/20 |
3/02/20 |
42 |
|
|
|
Ingenico |
100 |
3,026 |
|
109.494 |
146.326 |
|
36.833 |
34 |
442,862 |
1,143 |
|
| short |
3/02/20 |
10/19/20 |
231 |
|
|
|
SES |
100 |
54,646 |
|
8.104 |
7.837 |
8.380 |
0.276 |
3 |
457,930 |
5 |
|
| long |
10/19/20 |
11/02/20 |
14 |
|
|
|
Sartorius Stedim |
100 |
1,273 |
|
359.458 |
380.553 |
|
21.095 |
6 |
484,785 |
342 |
|
| short |
11/02/20 |
11/09/20 |
7 |
|
|
|
Klépierre |
100 |
37,704 |
|
12.858 |
17.735 |
7.981 |
-4.877 |
-38 |
300,901 |
-100 |
|
| long |
11/09/20 |
6/28/21 |
231 |
|
|
|
Sartorius Stedim |
100 |
794 |
|
378.576 |
480.082 |
|
101.506 |
27 |
381,497 |
46 |
|
| short |
6/28/21 |
7/05/21 |
7 |
|
|
|
Ubisoft |
100 |
5,461 |
|
69.847 |
71.821 |
67.874 |
-1.973 |
-3 |
370,722 |
-78 |
|
| long |
7/05/21 |
7/12/21 |
7 |
|
|
|
Klépierre |
100 |
13,656 |
|
27.146 |
26.403 |
|
-0.744 |
-3 |
360,563 |
-77 |
|
| L/S | date buy | date sell | days | | instrument | spl | pieces | | prc buy | prc sell | ps short | prc diff | d % | asset | yield | | | short |
7/12/21 |
7/26/21 |
14 |
|
|
|
Ubisoft |
100 |
5,074 |
|
71.047 |
65.012 |
77.643 |
6.596 |
9 |
394,029 |
912 |
|
| long |
7/26/21 |
8/02/21 |
7 |
|
|
|
Sartorius Stedim |
100 |
729 |
|
539.878 |
575.281 |
|
35.403 |
7 |
419,838 |
2,644 |
|
| short |
8/02/21 |
2/06/23 |
553 |
|
|
|
Ubisoft |
100 |
6,606 |
|
63.548 |
22.214 |
181.794 |
118.246 |
186 |
1,200,973 |
100 |
|
| long |
2/06/23 |
2/27/23 |
21 |
|
|
|
Rexel |
100 |
51,838 |
|
23.168 |
25.114 |
|
1.947 |
8 |
1,301,876 |
306 |
|
| short |
2/27/23 |
4/24/23 |
56 |
|
|
|
Ubisoft |
100 |
59,186 |
|
21.996 |
28.212 |
15.780 |
-6.216 |
-28 |
933,993 |
-89 |
|
| long |
4/24/23 |
6/12/23 |
49 |
|
|
|
Sodexo |
100 |
11,883 |
|
78.593 |
79.744 |
|
1.151 |
1 |
947,669 |
11 |
|
| short |
6/12/23 |
7/24/23 |
42 |
|
|
|
Rémy Cointreau |
100 |
6,097 |
|
155.413 |
161.328 |
149.498 |
-5.915 |
-4 |
911,606 |
-29 |
|
| long |
7/24/23 |
8/07/23 |
14 |
|
|
|
Forvia |
100 |
33,070 |
|
27.566 |
23.812 |
|
-3.754 |
-14 |
787,451 |
-98 |
|
| short |
8/07/23 |
8/12/24 |
371 |
|
|
|
Sartorius Stedim |
100 |
2,693 |
|
292.363 |
184.812 |
462.502 |
170.139 |
58 |
1,245,635 |
57 |
|
| accum | 5/08/06 |
8/12/24 | 7389 |
days out of 7515 invested (98%) |
12,356 |
1,245,635 |
27 |
|
Instrument Related Contribution
| instrument | L/S | date buy | date sell | days | prc buy | prc sell | ps short | prc diff | d % | | | total |
| Natixis | short | 7/23/07 | 6/01/09 | 679 | 15.99 | 2.09 | 122.11 | 106.12 | 663.64 | | | |
| | short | 7/11/11 | 3/12/12 | 245 | 4.64 | 3.57 | 6.04 | 1.39 | 30.01 | | | |
| | short | 5/28/12 | 6/18/12 | 21 | 2.40 | 2.51 | 2.30 | -0.11 | -4.40 | | | |
| | long | 1/13/14 | 6/23/14 | 161 | 6.47 | 6.62 | | 0.15 | 2.29 | | | |
| | short | 7/22/19 | 7/29/19 | 7 | 4.16 | 4.17 | 4.14 | -0.01 | -0.34 | | | |
| | short | 8/12/19 | 10/28/19 | 77 | 4.08 | 4.61 | 3.55 | -0.53 | -13.00 | | | 741.71 |
| Sartorius Stedim | long | 10/19/20 | 11/02/20 | 14 | 359.46 | 380.55 | | 21.10 | 5.87 | | | |
| | long | 11/09/20 | 6/28/21 | 231 | 378.58 | 480.08 | | 101.51 | 26.81 | | | |
| | long | 7/26/21 | 8/02/21 | 7 | 539.88 | 575.28 | | 35.40 | 6.56 | | | |
| | short | 8/07/23 | 8/12/24 | 371 | 292.36 | 184.81 | 462.50 | 170.14 | 58.19 | | | 126.31 |
| Arkema | long | 8/24/09 | 5/10/10 | 259 | 33.83 | 37.12 | | 3.29 | 9.73 | | | |
| | long | 12/06/10 | 6/20/11 | 196 | 69.26 | 93.87 | | 24.61 | 35.53 | | | |
| | long | 6/27/11 | 7/11/11 | 14 | 92.38 | 94.95 | | 2.58 | 2.79 | | | |
| | short | 6/23/14 | 1/26/15 | 217 | 96.12 | 70.50 | 131.05 | 34.93 | 36.34 | | | 108.42 |
| Ubisoft | short | 11/04/19 | 12/16/19 | 42 | 58.06 | 68.47 | 47.65 | -10.41 | -17.93 | | | |
| | short | 6/28/21 | 7/05/21 | 7 | 69.85 | 71.82 | 67.87 | -1.97 | -2.82 | | | |
| | short | 7/12/21 | 7/26/21 | 14 | 71.05 | 65.01 | 77.64 | 6.60 | 9.28 | | | |
| | short | 8/02/21 | 2/06/23 | 553 | 63.55 | 22.21 | 181.79 | 118.25 | 186.07 | | | |
| | short | 2/27/23 | 4/24/23 | 56 | 22.00 | 28.21 | 15.78 | -6.22 | -28.26 | | | 78.87 |
| Ingenico | long | 1/26/15 | 8/24/15 | 210 | 104.37 | 129.28 | | 24.90 | 23.86 | | | |
| | long | 7/15/19 | 7/22/19 | 7 | 89.20 | 89.02 | | -0.18 | -0.20 | | | |
| | long | 7/29/19 | 8/12/19 | 14 | 95.09 | 92.76 | | -2.33 | -2.45 | | | |
| | long | 10/28/19 | 11/04/19 | 7 | 105.71 | 106.59 | | 0.87 | 0.82 | | | |
| | long | 12/16/19 | 1/13/20 | 28 | 105.37 | 109.49 | | 4.12 | 3.91 | | | |
| | long | 1/20/20 | 3/02/20 | 42 | 109.49 | 146.33 | | 36.83 | 33.64 | | | 68.83 |
| instrument | L/S | date buy | date sell | days | prc buy | prc sell | ps short | prc diff | d % | | | total |
| STMicroelectronics | short | 10/28/13 | 11/11/13 | 14 | 7.71 | 7.58 | 7.85 | 0.13 | 1.74 | | | |
| | short | 12/09/13 | 1/13/14 | 35 | 7.49 | 7.88 | 7.10 | -0.39 | -5.23 | | | |
| | long | 1/30/17 | 2/06/17 | 7 | 13.36 | 14.18 | | 0.82 | 6.12 | | | |
| | long | 2/13/17 | 2/20/17 | 7 | 13.68 | 14.38 | | 0.70 | 5.12 | | | |
| | long | 4/03/17 | 11/13/17 | 224 | 15.25 | 23.77 | | 8.52 | 55.91 | | | 67.67 |
| Gemalto | long | 3/12/12 | 5/28/12 | 77 | 61.61 | 62.57 | | 0.96 | 1.56 | | | |
| | long | 6/18/12 | 10/01/12 | 105 | 67.22 | 89.33 | | 22.11 | 32.89 | | | |
| | long | 12/10/12 | 9/30/13 | 294 | 95.81 | 107.61 | | 11.79 | 12.31 | | | 51.58 |
| Casino Guichard | short | 8/24/15 | 1/30/17 | 525 | 6,534.11 | 5,322.98 | 8,020.81 | 1,486.70 | 22.75 | | | 22.75 |
| EDF | short | 8/10/09 | 8/24/09 | 14 | 48.06 | 52.94 | 43.17 | -4.88 | -10.16 | | | |
| | short | 6/20/11 | 6/27/11 | 7 | 37.14 | 36.61 | 37.68 | 0.54 | 1.44 | | | |
| | long | 10/07/13 | 10/28/13 | 21 | 32.26 | 35.26 | | 2.99 | 9.28 | | | |
| | long | 11/11/13 | 12/09/13 | 28 | 34.70 | 36.60 | | 1.90 | 5.48 | | | |
| | short | 2/20/17 | 4/03/17 | 42 | 9.60 | 8.40 | 10.98 | 1.38 | 14.35 | | | 20.13 |
| Atos | long | 7/27/09 | 8/10/09 | 14 | 39.71 | 46.57 | | 6.87 | 17.29 | | | 17.29 |
| Rexel | long | 2/06/23 | 2/27/23 | 21 | 23.17 | 25.11 | | 1.95 | 8.40 | | | 8.40 |
| Sodexo | long | 4/24/23 | 6/12/23 | 49 | 78.59 | 79.74 | | 1.15 | 1.46 | | | 1.46 |
| Dassault Systèmes | long | 3/12/18 | 5/28/18 | 77 | 27.37 | 26.98 | | -0.39 | -1.42 | | | -1.42 |
| Rémy Cointreau | short | 6/12/23 | 7/24/23 | 42 | 155.41 | 161.33 | 149.50 | -5.91 | -3.81 | | | -3.81 |
| Getlink | short | 6/08/09 | 7/27/09 | 49 | 5.84 | 6.09 | 5.59 | -0.25 | -4.29 | | | -4.29 |
| Iliad | long | 6/01/09 | 6/08/09 | 7 | 111.95 | 102.22 | | -9.73 | -8.69 | | | -8.69 |
| SES | short | 9/30/13 | 10/07/13 | 7 | 28.68 | 28.54 | 28.81 | 0.13 | 0.47 | | | |
| | short | 2/06/17 | 2/13/17 | 7 | 19.26 | 20.47 | 18.04 | -1.22 | -6.31 | | | |
| | short | 11/13/17 | 3/12/18 | 119 | 14.71 | 15.66 | 13.77 | -0.95 | -6.43 | | | |
| | short | 1/13/20 | 1/20/20 | 7 | 14.22 | 14.22 | 14.22 | -0.00 | 0.00 | | | |
| | short | 3/02/20 | 10/19/20 | 231 | 8.10 | 7.84 | 8.38 | 0.28 | 3.40 | | | -8.93 |
| instrument | L/S | date buy | date sell | days | prc buy | prc sell | ps short | prc diff | d % | | | total |
| Forvia | long | 7/24/23 | 8/07/23 | 14 | 27.57 | 23.81 | | -3.75 | -13.62 | | | -13.62 |
| Air France-KLM | short | 5/28/18 | 7/15/19 | 413 | 84.97 | 98.68 | 71.26 | -13.71 | -16.13 | | | -16.13 |
| Thales | short | 5/08/06 | 12/18/06 | 224 | 43.66 | 48.42 | 38.90 | -4.76 | -10.90 | | | |
| | short | 5/10/10 | 12/06/10 | 210 | 35.47 | 37.88 | 33.06 | -2.41 | -6.80 | | | -16.95 |
| Hermes International | long | 12/18/06 | 7/23/07 | 217 | 119.36 | 106.66 | | -12.69 | -10.64 | | | |
| | short | 10/01/12 | 12/10/12 | 70 | 271.86 | 304.43 | 239.29 | -32.57 | -11.98 | | | -21.34 |
| Klépierre | short | 11/02/20 | 11/09/20 | 7 | 12.86 | 17.73 | 7.98 | -4.88 | -37.93 | | | |
| | long | 7/05/21 | 7/12/21 | 7 | 27.15 | 26.40 | | -0.74 | -2.74 | | | -39.63 |
Annotations
| 2/20/24 | CAC Next 20 | | | Component update: Soitec and Worldline replace ADP and Edenred |
| 2/01/24 | CAC Next 20 | | | Sodexo spins Pluxee off |
| 8/31/23 | Air France-KLM | | | reverse split 10:1 (one for ten) |
| 9/20/17 | bioMérieux | | | stock split 1:3 (three for one) |
| 3/20/17 | CAC Next 20 | | | Klépierre replaces Atos |
| 7/15/16 | CAC Next 20 | | | Eiffage replaces Eutelsat |
| 6/06/16 | Valeo | | | stock split 1:3 (three for one) |
| 5/06/16 | Sartorius Stedim | | | stock split 1 : 6 (six for one) |
| 3/21/16 | CAC Next 20 | | | Alstom replaces Sodexo |
| 1/05/16 | CAC Next 20 | | | complete analysis |
| 12/21/15 | Sartorius Stedim | | | recording started |
| | CAC Next 20 | | | EDF and Groupe Eurotunnel replace Klépierre and Vallourec |
| 8/23/15 | CAC Next 20 | | | complete analysis |
| 7/08/15 | CAC Next 20 | | | market adjustment to index: Hermes, Ingenico and Klépierre replace CGG, Eutelsat and Lagardere |
|
|