| | Mon, 29th Jun 2026, 14:50UTC |
| | |

Assessment - DJ Global Titans 50 in Euro - 1/07/24 - RS = 30
⇐
| |
|
instrument |
freshest |
⇓ Δday |
1/07/24 |
⇓ Δwk |
4/12/23 |
prc diff |
⇓ Δ30 |
|
⇓∅-RS |
| |  |
 |
 |
|
|
 |
DJ Global Titans |
601.928 |
12/08/24 |
|
631.845 |
-4.73 |
485.452 |
146.394 |
30.16 |
|
23.19 |
| | |
|
|
|
L |
|
3M |
115.008 |
12/08/24 |
-0.65 |
93.798 |
22.61 |
95.517 |
-1.719 |
-1.80 |
|
3.12 |
| | |
|
|
|
|
|
AbbVie |
177.304 |
12/08/24 |
0.13 |
158.835 |
11.63 |
133.109 |
25.727 |
19.33 |
|
10.67 |
| | |
|
|
|
|
|
Allianz |
255.900 |
12/08/24 |
|
262.500 |
-2.51 |
235.100 |
27.400 |
11.65 |
|
7.44 |
| | |
|
|
|
L |
|
Alphabet A |
151.302 |
12/08/24 |
-0.84 |
170.601 |
-11.31 |
119.368 |
51.233 |
42.92 |
|
31.23 |
| | |
|
|
|
|
|
Amazon.com |
155.507 |
12/08/24 |
-0.08 |
183.849 |
-15.42 |
133.746 |
50.103 |
37.46 |
|
30.74 |
| | |
|
|
|
L |
|
Amgen |
298.335 |
12/08/24 |
-0.77 |
289.954 |
2.89 |
251.664 |
38.289 |
15.21 |
|
14.97 |
| | |
|
|
|
|
|
Anheuser-Busch InBev |
55.200 |
12/08/24 |
-0.47 |
54.440 |
1.40 |
58.360 |
-3.920 |
-6.72 |
|
1.03 |
| | |
|
|
|
L |
|
Apple |
202.802 |
12/08/24 |
0.71 |
202.075 |
0.36 |
174.920 |
27.155 |
15.52 |
|
19.24 |
| | |
|
|
|
|
|
BHP |
25.197 |
12/08/24 |
-0.54 |
26.847 |
-6.14 |
28.821 |
-1.975 |
-6.85 |
|
-1.81 |
| | |
|
|
|
|
|
Boeing |
153.018 |
12/08/24 |
-2.25 |
174.060 |
-12.09 |
216.880 |
-42.820 |
-19.74 |
|
-7.20 |
| | |
|
|
|
|
|
BP |
518.109 |
12/08/24 |
1.35 |
563.956 |
-8.13 |
550.257 |
13.699 |
2.49 |
|
-0.29 |
| | |
|
|
|
L |
|
BAT |
3,301.236 |
12/08/24 |
|
2,888.729 |
14.28 |
2,942.205 |
-53.476 |
-1.82 |
|
1.32 |
| | |
|
|
|
|
|
Chevron |
135.202 |
12/08/24 |
0.02 |
145.923 |
-7.35 |
133.773 |
12.150 |
9.08 |
|
1.55 |
| | |
|
|
|
S |
|
Cisco Systems |
41.823 |
12/08/24 |
-1.34 |
44.303 |
-5.60 |
44.370 |
-0.067 |
-0.15 |
|
-5.13 |
| | |
|
|
|
|
|
Citigroup |
53.924 |
12/08/24 |
|
59.136 |
-8.81 |
43.742 |
15.394 |
35.19 |
|
28.74 |
| | |
|
|
|
L |
|
Coca-Cola |
63.555 |
12/08/24 |
-0.74 |
58.996 |
7.73 |
54.084 |
4.912 |
9.08 |
|
7.28 |
| | |
|
|
|
L |
|
DuPont |
73.027 |
12/08/24 |
-0.25 |
73.903 |
-1.19 |
66.263 |
7.640 |
11.53 |
|
8.59 |
| | |
|
|
|
|
|
Exxon Mobil |
110.943 |
12/08/24 |
0.13 |
107.177 |
3.51 |
94.584 |
12.593 |
13.31 |
|
7.02 |
| | |
|
|
|
|
|
General Electric |
155.572 |
12/08/24 |
-0.16 |
148.207 |
4.97 |
112.221 |
35.986 |
32.07 |
|
24.00 |
| | |
|
|
|
|
|
GSK |
1,852.747 |
12/08/24 |
0.42 |
1,798.532 |
3.01 |
1,696.884 |
101.648 |
5.99 |
|
1.72 |
| | |
|
|
|
L |
|
HSBC |
758.895 |
12/08/24 |
0.22 |
814.289 |
-6.80 |
704.334 |
109.956 |
15.61 |
|
11.44 |
| | |
|
|
|
|
|
IBM |
176.652 |
12/08/24 |
-1.03 |
163.245 |
8.21 |
148.760 |
14.485 |
9.74 |
|
11.03 |
| | |
|
|
|
S |
|
Intel |
18.049 |
12/08/24 |
-1.78 |
28.752 |
-37.22 |
39.106 |
-10.354 |
-26.48 |
|
-17.28 |
| | |
|
|
|
S |
|
Johnson & Johnson |
149.056 |
12/08/24 |
-0.46 |
136.526 |
9.18 |
146.710 |
-10.185 |
-6.94 |
|
-5.70 |
| |
|
instrument |
freshest |
⇓ Δday |
1/07/24 |
⇓ Δwk |
4/12/23 |
prc diff |
⇓ Δ30 |
|
⇓∅-RS |
| | |
|
|
|
|
|
JP Morgan Chase |
192.230 |
12/08/24 |
0.19 |
191.540 |
0.36 |
145.889 |
45.652 |
31.29 |
|
25.36 |
| | |
|
|
|
|
|
Mastercard |
424.838 |
12/08/24 |
-0.24 |
407.982 |
4.13 |
376.961 |
31.021 |
8.23 |
|
3.90 |
| | |
|
|
|
S |
|
McDonald´s |
251.217 |
12/08/24 |
0.58 |
233.065 |
7.79 |
264.213 |
-31.149 |
-11.79 |
|
-9.46 |
| | |
|
|
|
|
|
Merck (MSD) |
105.797 |
12/08/24 |
-0.93 |
119.241 |
-11.27 |
97.013 |
22.228 |
22.91 |
|
12.61 |
| | |
|
|
|
|
|
Meta Platforms |
481.018 |
12/08/24 |
-0.35 |
470.511 |
2.23 |
295.508 |
175.004 |
59.22 |
|
39.06 |
| | |
|
|
|
|
|
Microsoft |
379.268 |
12/08/24 |
0.19 |
425.808 |
-10.93 |
340.865 |
84.943 |
24.92 |
|
24.01 |
| | |
|
|
|
L |
|
Nestlé |
91.452 |
12/08/24 |
-0.40 |
94.795 |
-3.53 |
105.823 |
-11.028 |
-10.42 |
|
-8.29 |
| | |
|
|
|
L |
|
Novartis |
99.809 |
12/08/24 |
0.16 |
99.788 |
0.02 |
91.183 |
8.605 |
9.44 |
|
7.93 |
| | |
|
|
|
L |
|
NVidia |
101.639 |
12/08/24 |
4.08 |
115.884 |
-12.29 |
42.024 |
73.860 |
175.76 |
|
119.73 |
| | |
|
|
|
L |
|
Oracle |
123.604 |
12/08/24 |
0.39 |
133.402 |
-7.35 |
106.912 |
26.491 |
24.78 |
|
25.14 |
| | |
|
|
|
|
|
PepsiCo |
159.814 |
12/08/24 |
-0.56 |
151.862 |
5.24 |
156.184 |
-4.323 |
-2.77 |
|
-4.67 |
| | |
|
|
|
L |
|
Pfizer |
26.524 |
12/08/24 |
-0.35 |
26.309 |
0.82 |
27.037 |
-0.728 |
-2.69 |
|
-5.60 |
| | |
|
|
|
L |
|
Philip Morris |
108.230 |
12/08/24 |
0.07 |
94.395 |
14.66 |
85.812 |
8.583 |
10.00 |
|
8.17 |
| | |
|
|
|
L |
|
Procter & Gamble |
155.516 |
12/08/24 |
-2.19 |
151.703 |
2.51 |
140.413 |
11.291 |
8.04 |
|
6.26 |
| | |
|
|
|
L |
|
Roche |
286.613 |
12/08/24 |
0.25 |
258.035 |
11.08 |
260.720 |
-2.686 |
-1.03 |
|
1.75 |
| | |
|
|
|
L |
|
Royal Bank CA |
100.925 |
12/08/24 |
-0.72 |
98.815 |
2.14 |
84.134 |
14.681 |
17.45 |
|
12.44 |
| | |
|
|
|
|
|
Samsung Electronics |
50.900 |
12/08/24 |
1.07 |
55.147 |
-7.70 |
51.239 |
3.909 |
7.63 |
|
8.57 |
| | |
|
|
|
|
|
Sanofi |
95.670 |
12/08/24 |
-0.60 |
91.850 |
4.16 |
86.590 |
5.260 |
6.07 |
|
-4.86 |
| | |
|
|
|
|
|
Shell |
33.025 |
12/08/24 |
0.93 |
33.880 |
-2.52 |
30.020 |
3.860 |
12.86 |
|
7.36 |
| | |
|
|
|
|
|
Siemens |
157.200 |
12/08/24 |
0.01 |
177.120 |
-11.25 |
156.980 |
20.140 |
12.83 |
|
7.94 |
| | |
|
|
|
L |
|
Taiwan Semiconductor |
156.281 |
12/08/24 |
0.31 |
160.663 |
-2.73 |
89.579 |
71.083 |
79.35 |
|
57.91 |
| | |
|
|
|
|
|
TotalEnergies |
61.720 |
12/08/24 |
0.60 |
63.610 |
-2.97 |
61.390 |
2.220 |
3.62 |
|
2.12 |
| | |
|
|
|
|
|
Toyota |
14.122 |
9/08/24 |
-0.14 |
18.949 |
-25.47 |
17.361 |
1.588 |
9.15 |
|
6.12 |
| | |
|
|
|
|
|
Visa |
242.295 |
12/08/24 |
0.05 |
245.418 |
-1.27 |
234.951 |
10.467 |
4.45 |
|
3.39 |
| | |
|
|
|
L |
|
Walmart |
64.049 |
12/08/24 |
1.10 |
62.911 |
1.81 |
47.494 |
15.418 |
32.46 |
|
22.03 |
| |
|
instrument |
freshest |
⇓ Δday |
1/07/24 |
⇓ Δwk |
4/12/23 |
prc diff |
⇓ Δ30 |
|
⇓∅-RS |
| | |
|
|
|
|
|
Walt Disney |
80.131 |
12/08/24 |
-0.30 |
91.402 |
-12.33 |
84.962 |
6.440 |
7.58 |
|
4.16 |
| DJ Global Titans - 50 out of 50 instruments rated - 1/07/24 / 4/12/23 - 37 did rise, Market-Ratio(30) in EUR = 74.00 % |
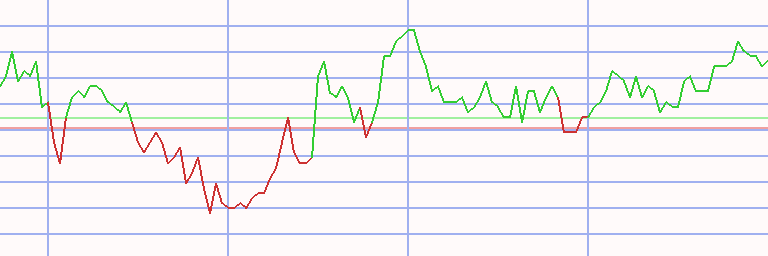
Technical Chart
Transactions DJ Global Titans 50 in Euro * S30 - 50/54 (1)
|
⇐ |
| |
| L/S | date buy | date sell | days | | instrument | spl | pieces | | prc buy | prc sell | ps short | prc diff | d % | asset | yield | |
| 2/01/06 |
14/01/08 |
742 |
|
- cash - |
| short |
14/01/08 |
4/05/09 |
476 |
|
|
|
Citigroup |
100 |
50 |
|
196.657 |
24.115 |
1,603.761 |
1,407.104 |
716 |
80,355 |
400 |
|
| 4/05/09 |
25/05/09 |
21 |
|
- cash - |
| |
25/05/09 |
1/06/09 |
7 |
|
|
|
Citigroup |
100 |
2,983 |
|
26.930 |
26.080 |
27.809 |
0.879 |
3 |
82,976 |
433 |
|
| 1/06/09 |
17/05/10 |
350 |
|
- cash - |
| |
17/05/10 |
31/05/10 |
14 |
|
|
|
Qualcomm |
100 |
2,743 |
|
30.243 |
28.580 |
32.003 |
1.760 |
6 |
87,804 |
337 |
|
| 31/05/10 |
7/06/10 |
7 |
|
- cash - |
| |
7/06/10 |
6/09/10 |
91 |
|
|
|
Qualcomm |
100 |
3,000 |
|
29.260 |
31.462 |
27.059 |
-2.201 |
-8 |
81,200 |
-27 |
|
| 6/09/10 |
4/10/10 |
28 |
|
- cash - |
| |
4/10/10 |
22/11/10 |
49 |
|
|
|
Bank of America |
100 |
8,516 |
|
9.535 |
8.261 |
11.004 |
1.469 |
15 |
93,712 |
191 |
|
| 22/11/10 |
25/07/11 |
245 |
|
- cash - |
| |
25/07/11 |
26/12/11 |
154 |
|
|
|
Bank of America |
100 |
13,445 |
|
6.970 |
4.201 |
11.562 |
4.592 |
66 |
155,456 |
232 |
|
| 26/12/11 |
22/10/12 |
301 |
|
- cash - |
| |
22/10/12 |
29/10/12 |
7 |
|
|
|
Telefónica |
100 |
14,805 |
|
10.500 |
10.070 |
10.948 |
0.448 |
4 |
162,095 |
785 |
|
| 29/10/12 |
27/10/14 |
728 |
|
- cash - |
| |
27/10/14 |
10/11/14 |
14 |
|
|
|
Samsung Electronics |
100 |
9,891,920 |
|
0.016 |
0.019 |
0.014 |
-0.002 |
-15 |
138,487 |
-98 |
|
| 10/11/14 |
15/12/14 |
35 |
|
- cash - |
| |
15/12/14 |
27/04/15 |
133 |
|
|
|
Gazprom |
100 |
41,500 |
|
3.337 |
5.420 |
1.254 |
-2.083 |
-62 |
52,042 |
-93 |
|
| 27/04/15 |
8/06/15 |
42 |
|
- cash - |
| |
8/06/15 |
13/07/15 |
35 |
|
|
|
BHP |
100 |
2,736 |
|
19.020 |
17.787 |
20.338 |
1.318 |
7 |
55,649 |
101 |
|
| 13/07/15 |
27/07/15 |
14 |
|
- cash - |
| |
27/07/15 |
3/08/15 |
7 |
|
|
|
ConocoPhilips |
100 |
1,218 |
|
45.655 |
45.385 |
45.927 |
0.272 |
1 |
55,980 |
36 |
|
| 3/08/15 |
24/08/15 |
21 |
|
- cash - |
| |
24/08/15 |
21/03/16 |
210 |
|
|
|
ConocoPhilips |
100 |
1,513 |
|
36.977 |
37.886 |
36.068 |
-0.909 |
-2 |
54,605 |
-4 |
|
| 21/03/16 |
28/03/16 |
7 |
|
- cash - |
| |
28/03/16 |
11/04/16 |
14 |
|
|
|
Mitsubishi UFJ |
100 |
1,313,308 |
|
0.042 |
0.038 |
0.045 |
0.003 |
8 |
59,099 |
686 |
|
| 11/04/16 |
9/05/16 |
28 |
|
- cash - |
| |
9/05/16 |
4/07/16 |
56 |
|
|
|
Mitsubishi UFJ |
100 |
1,469,640 |
|
0.040 |
0.040 |
0.041 |
0.000 |
1 |
59,667 |
6 |
|
| 4/07/16 |
5/03/18 |
609 |
|
- cash - |
| |
5/03/18 |
12/03/18 |
7 |
|
|
|
General Electric |
100 |
638 |
|
93.522 |
97.980 |
89.065 |
-4.458 |
-5 |
56,823 |
-92 |
|
| 12/03/18 |
23/04/18 |
42 |
|
- cash - |
| |
23/04/18 |
3/09/18 |
133 |
|
|
|
General Electric |
100 |
597 |
|
95.174 |
89.079 |
101.687 |
6.513 |
7 |
60,711 |
20 |
|
| 3/09/18 |
10/12/18 |
98 |
|
- cash - |
| |
10/12/18 |
1/04/19 |
112 |
|
|
|
General Electric |
100 |
1,244 |
|
48.793 |
72.073 |
25.513 |
-23.280 |
-48 |
31,750 |
-88 |
|
| 1/04/19 |
22/04/19 |
21 |
|
- cash - |
| |
22/04/19 |
29/04/19 |
7 |
|
|
|
Schlumberger |
100 |
779 |
|
40.710 |
38.835 |
42.676 |
1.966 |
5 |
33,282 |
1,069 |
|
| 29/04/19 |
3/06/19 |
35 |
|
- cash - |
| |
3/06/19 |
10/06/19 |
7 |
|
|
|
Schlumberger |
100 |
1,054 |
|
31.558 |
31.341 |
31.775 |
0.218 |
1 |
33,511 |
43 |
|
| 10/06/19 |
24/02/20 |
259 |
|
- cash - |
| |
24/02/20 |
5/10/20 |
224 |
|
|
|
Exxon Mobil |
100 |
645 |
|
51.928 |
28.615 |
94.235 |
42.307 |
81 |
60,799 |
164 |
|
| 5/10/20 |
7/03/22 |
518 |
|
- cash - |
| |
7/03/22 |
28/03/22 |
21 |
|
|
|
Gazprom |
100 |
22,518 |
|
2.700 |
2.700 |
2.700 |
0.000 |
0 |
60,799 |
0 |
|
| 28/03/22 |
13/06/22 |
77 |
|
- cash - |
| |
13/06/22 |
9/01/23 |
210 |
|
|
|
General Electric |
100 |
937 |
|
64.862 |
67.576 |
62.148 |
-2.714 |
-4 |
58,256 |
-7 |
|
| 9/01/23 |
13/03/23 |
63 |
|
- cash - |
| |
13/03/23 |
27/03/23 |
14 |
|
|
|
3M |
100 |
604 |
|
96.348 |
94.020 |
98.734 |
2.386 |
2 |
59,697 |
89 |
|
| 27/03/23 |
30/10/23 |
217 |
|
- cash - |
| |
30/10/23 |
4/12/23 |
35 |
|
|
|
Pfizer |
100 |
2,073 |
|
28.784 |
27.037 |
30.644 |
1.860 |
6 |
63,553 |
92 |
|
| 4/12/23 |
29/06/26 |
938 |
|
- cash - |
| accum | 14/01/08 |
4/12/23 | 2037 |
days out of 7483 invested (27%) |
536 |
63,553 |
39 |
|
Instrument Related Contribution
| instrument | L/S | date buy | date sell | days | prc buy | prc sell | ps short | prc diff | d % | | | total |
| Citigroup | short | 14/01/08 | 4/05/09 | 476 | 196.66 | 24.11 | 1,603.76 | 1,407.10 | 715.51 | | | |
| | | 25/05/09 | 1/06/09 | 7 | 26.93 | 26.08 | 27.81 | 0.88 | 3.26 | | | 742.12 |
| Bank of America | | 4/10/10 | 22/11/10 | 49 | 9.53 | 8.26 | 11.00 | 1.47 | 15.41 | | | |
| | | 25/07/11 | 26/12/11 | 154 | 6.97 | 4.20 | 11.56 | 4.59 | 65.89 | | | 91.45 |
| Exxon Mobil | | 24/02/20 | 5/10/20 | 224 | 51.93 | 28.61 | 94.24 | 42.31 | 81.47 | | | 81.47 |
| Mitsubishi UFJ | | 28/03/16 | 11/04/16 | 14 | 0.04 | 0.04 | 0.05 | 0.00 | 8.23 | | | |
| | | 9/05/16 | 4/07/16 | 56 | 0.04 | 0.04 | 0.04 | 0.00 | 0.96 | | | 9.27 |
| BHP | | 8/06/15 | 13/07/15 | 35 | 19.02 | 17.79 | 20.34 | 1.32 | 6.93 | | | 6.93 |
| Pfizer | | 30/10/23 | 4/12/23 | 35 | 28.78 | 27.04 | 30.64 | 1.86 | 6.46 | | | 6.46 |
| Schlumberger | | 22/04/19 | 29/04/19 | 7 | 40.71 | 38.84 | 42.68 | 1.97 | 4.83 | | | |
| | | 3/06/19 | 10/06/19 | 7 | 31.56 | 31.34 | 31.78 | 0.22 | 0.69 | | | 5.55 |
| Telefónica | | 22/10/12 | 29/10/12 | 7 | 10.50 | 10.07 | 10.95 | 0.45 | 4.27 | | | 4.27 |
| 3M | | 13/03/23 | 27/03/23 | 14 | 96.35 | 94.02 | 98.73 | 2.39 | 2.48 | | | 2.48 |
| ConocoPhilips | | 27/07/15 | 3/08/15 | 7 | 45.66 | 45.38 | 45.93 | 0.27 | 0.60 | | | |
| | | 24/08/15 | 21/03/16 | 210 | 36.98 | 37.89 | 36.07 | -0.91 | -2.46 | | | -1.88 |
| Qualcomm | | 17/05/10 | 31/05/10 | 14 | 30.24 | 28.58 | 32.00 | 1.76 | 5.82 | | | |
| | | 7/06/10 | 6/09/10 | 91 | 29.26 | 31.46 | 27.06 | -2.20 | -7.52 | | | -2.14 |
| Samsung Electronics | | 27/10/14 | 10/11/14 | 14 | 0.02 | 0.02 | 0.01 | -0.00 | -14.56 | | | -14.56 |
| General Electric | | 5/03/18 | 12/03/18 | 7 | 93.52 | 97.98 | 89.06 | -4.46 | -4.77 | | | |
| | | 23/04/18 | 3/09/18 | 133 | 95.17 | 89.08 | 101.69 | 6.51 | 6.84 | | | |
| | | 10/12/18 | 1/04/19 | 112 | 48.79 | 72.07 | 25.51 | -23.28 | -47.71 | | | |
| | | 13/06/22 | 9/01/23 | 210 | 64.86 | 67.58 | 62.15 | -2.71 | -4.18 | | | -49.02 |
| Gazprom | | 15/12/14 | 27/04/15 | 133 | 3.34 | 5.42 | 1.25 | -2.08 | -62.42 | | | |
| | | 7/03/22 | 28/03/22 | 21 | 2.70 | 2.70 | 2.70 | 0.00 | 0.00 | | | -62.42 |
Annotations
| 10/06/24 | NVidia | | | stock split 1:10 (ten for one) |
| 26/02/24 | Walmart | | | stock split 1:3 (three for one) |
| 18/07/22 | Alphabet A | | | stock split 1:20 (twenty for one) |
| | GlaxoSmithKline | | | demergers OTC business -> Haleon |
| 6/06/22 | Amazon.com | | | stock split 1:20 (twenty for one) |
| 29/09/21 | Toyota | | | stock split 1:5 (five for one) |
| 2/08/21 | General Electric | | | reverse stock split 8:1 (eight become one) |
| 20/07/21 | NVidia | | | stock split 1:4 (four for one) |
| 4/05/18 | Samsung Electronics | | | stock split 1:50 (fifty for one) |
| 4/10/16 | AB InBev | | | acquisition of SAB Miller completed |
| 2/10/15 | Google A | | | changes name to Alphabet |
| 19/03/15 | Visa | | | forward stock split 1:4 (four for one) |
|
|