| | |
| | |

Assessment - DJ Global Titans 50 in Japanese yen - 1/07/24 - RS = 30
⇐
| |
|
⇓instrument |
freshest |
⇓ Δday |
1/07/24 |
Δwk |
4/12/23 |
prc diff |
⇓ Δ30 |
|
⇓∅-RS |
| |  |
 |
 |
|
|
 |
DJ Global Titans |
104,318.932 |
12/08/24 |
|
109,503.856 |
-4.73 |
77,385.381 |
32,118.475 |
41.50 |
|
33.00 |
| | |
|
|
|
L |
|
3M |
19,931.825 |
12/08/24 |
-0.65 |
16,256.006 |
22.61 |
15,226.249 |
1,029.757 |
6.76 |
|
11.10 |
| | |
|
|
|
L |
|
Philip Morris |
18,757.179 |
12/08/24 |
0.07 |
16,359.414 |
14.66 |
13,679.189 |
2,680.224 |
19.59 |
|
16.59 |
| | |
|
|
|
L |
|
BAT |
572,130.682 |
12/08/24 |
|
500,639.879 |
14.28 |
469,013.996 |
31,625.884 |
6.74 |
|
9.14 |
| | |
|
|
|
|
|
AbbVie |
30,728.230 |
12/08/24 |
0.13 |
27,527.440 |
11.63 |
21,218.715 |
6,308.726 |
29.73 |
|
19.40 |
| | |
|
|
|
L |
|
Roche |
49,672.387 |
12/08/24 |
0.25 |
44,719.453 |
11.08 |
41,561.185 |
3,158.267 |
7.60 |
|
9.51 |
| | |
|
|
|
S |
|
Johnson & Johnson |
25,832.524 |
12/08/24 |
-0.46 |
23,660.963 |
9.18 |
23,386.954 |
274.010 |
1.17 |
|
1.55 |
| | |
|
|
|
|
|
IBM |
30,615.128 |
12/08/24 |
-1.03 |
28,291.687 |
8.21 |
23,713.735 |
4,577.952 |
19.31 |
|
19.86 |
| | |
|
|
|
S |
|
McDonald´s |
43,537.853 |
12/08/24 |
0.58 |
40,391.998 |
7.79 |
42,118.008 |
-1,726.009 |
-4.10 |
|
-2.49 |
| | |
|
|
|
L |
|
Coca-Cola |
11,014.531 |
12/08/24 |
-0.74 |
10,224.432 |
7.73 |
8,621.437 |
1,602.995 |
18.59 |
|
15.66 |
| | |
|
|
|
|
|
PepsiCo |
27,697.093 |
12/08/24 |
-0.56 |
26,318.863 |
5.24 |
24,897.214 |
1,421.649 |
5.71 |
|
2.71 |
| | |
|
|
|
|
|
General Electric |
26,961.929 |
12/08/24 |
-0.16 |
25,685.491 |
4.97 |
17,889.077 |
7,796.415 |
43.58 |
|
34.07 |
| | |
|
|
|
|
|
Sanofi |
16,580.376 |
12/08/24 |
-0.60 |
15,918.340 |
4.16 |
13,803.225 |
2,115.114 |
15.32 |
|
7.50 |
| | |
|
|
|
|
|
Mastercard |
73,627.864 |
12/08/24 |
-0.24 |
70,706.598 |
4.13 |
60,090.988 |
10,615.610 |
17.67 |
|
12.10 |
| | |
|
|
|
|
|
Exxon Mobil |
19,227.360 |
12/08/24 |
0.13 |
18,574.599 |
3.51 |
15,077.578 |
3,497.021 |
23.19 |
|
15.42 |
| | |
|
|
|
|
|
GSK |
321,095.834 |
12/08/24 |
0.42 |
311,699.900 |
3.01 |
270,498.502 |
41,201.399 |
15.23 |
|
9.79 |
| | |
|
|
|
L |
|
Amgen |
51,703.826 |
12/08/24 |
-0.77 |
50,251.272 |
2.89 |
40,117.575 |
10,133.696 |
25.26 |
|
24.07 |
| | |
|
|
|
L |
|
Procter & Gamble |
26,952.235 |
12/08/24 |
-2.19 |
26,291.396 |
2.51 |
22,383.057 |
3,908.338 |
17.46 |
|
14.61 |
| | |
|
|
|
|
|
Meta Platforms |
83,364.341 |
12/08/24 |
-0.35 |
81,543.397 |
2.23 |
47,106.577 |
34,436.820 |
73.10 |
|
50.47 |
| | |
|
|
|
L |
|
Royal Bank CA |
17,491.059 |
12/08/24 |
-0.72 |
17,125.389 |
2.14 |
13,411.670 |
3,713.718 |
27.69 |
|
21.29 |
| | |
|
|
|
L |
|
Walmart |
11,100.165 |
12/08/24 |
1.10 |
10,903.044 |
1.81 |
7,570.923 |
3,332.122 |
44.01 |
|
31.73 |
| | |
|
|
|
|
|
Anheuser-Busch InBev |
9,566.602 |
12/08/24 |
-0.47 |
9,434.888 |
1.40 |
9,303.109 |
131.778 |
1.42 |
|
6.52 |
| | |
|
|
|
L |
|
Pfizer |
4,596.793 |
12/08/24 |
-0.35 |
4,559.631 |
0.82 |
4,309.982 |
249.649 |
5.79 |
|
1.54 |
| | |
|
|
|
L |
|
Apple |
35,147.291 |
12/08/24 |
0.71 |
35,021.263 |
0.36 |
27,883.879 |
7,137.385 |
25.60 |
|
28.50 |
| | |
|
|
|
|
|
JP Morgan Chase |
33,315.037 |
12/08/24 |
0.19 |
33,195.472 |
0.36 |
23,255.947 |
9,939.525 |
42.74 |
|
35.41 |
| |
|
⇓instrument |
freshest |
⇓ Δday |
1/07/24 |
Δwk |
4/12/23 |
prc diff |
⇓ Δ30 |
|
⇓∅-RS |
| | |
|
|
|
L |
|
Novartis |
17,297.720 |
12/08/24 |
0.16 |
17,294.144 |
0.02 |
14,535.447 |
2,758.697 |
18.98 |
|
16.32 |
| | |
|
|
|
L |
|
DuPont |
12,656.127 |
12/08/24 |
-0.25 |
12,808.007 |
-1.19 |
10,562.990 |
2,245.017 |
21.25 |
|
17.08 |
| | |
|
|
|
|
|
Visa |
41,991.585 |
12/08/24 |
0.05 |
42,532.860 |
-1.27 |
37,453.276 |
5,079.584 |
13.56 |
|
11.55 |
| | |
|
|
|
|
|
Allianz |
44,349.517 |
12/08/24 |
|
45,493.350 |
-2.51 |
37,477.056 |
8,016.294 |
21.39 |
|
18.63 |
| | |
|
|
|
|
|
Shell |
5,723.497 |
12/08/24 |
0.93 |
5,871.675 |
-2.52 |
4,785.458 |
1,086.217 |
22.70 |
|
20.90 |
| | |
|
|
|
L |
|
Taiwan Semiconductor |
27,084.726 |
12/08/24 |
0.31 |
27,844.126 |
-2.73 |
14,279.761 |
13,564.365 |
94.99 |
|
70.86 |
| | |
|
|
|
|
|
TotalEnergies |
10,696.570 |
12/08/24 |
0.60 |
11,024.122 |
-2.97 |
9,786.119 |
1,238.003 |
12.65 |
|
12.72 |
| | |
|
|
|
L |
|
Nestlé |
15,849.389 |
12/08/24 |
-0.40 |
16,428.722 |
-3.53 |
16,869.150 |
-440.429 |
-2.61 |
|
-1.28 |
| | |
|
|
|
S |
|
Cisco Systems |
7,248.230 |
12/08/24 |
-1.34 |
7,678.018 |
-5.60 |
7,072.905 |
605.113 |
8.56 |
|
2.13 |
| | |
|
|
|
|
|
BHP |
4,366.924 |
12/08/24 |
-0.54 |
4,652.751 |
-6.14 |
4,594.391 |
58.360 |
1.27 |
|
5.79 |
| | |
|
|
|
L |
|
HSBC |
131,522.651 |
12/08/24 |
0.22 |
141,122.845 |
-6.80 |
112,277.137 |
28,845.708 |
25.69 |
|
20.19 |
| | |
|
|
|
|
|
Chevron |
23,431.528 |
12/08/24 |
0.02 |
25,289.634 |
-7.35 |
21,324.698 |
3,964.936 |
18.59 |
|
9.44 |
| | |
|
|
|
L |
|
Oracle |
21,421.541 |
12/08/24 |
0.39 |
23,119.689 |
-7.35 |
17,042.683 |
6,077.006 |
35.66 |
|
34.96 |
| | |
|
|
|
|
|
Samsung Electronics |
8,821.380 |
12/08/24 |
1.07 |
9,557.469 |
-7.70 |
8,167.897 |
1,389.572 |
17.01 |
|
17.06 |
| | |
|
|
|
|
|
BP |
89,792.448 |
12/08/24 |
1.35 |
97,738.140 |
-8.13 |
87,715.932 |
10,022.208 |
11.43 |
|
7.47 |
| | |
|
|
|
|
|
Citigroup |
9,345.467 |
12/08/24 |
|
10,248.668 |
-8.81 |
6,972.810 |
3,275.858 |
46.98 |
|
39.14 |
| | |
|
|
|
|
|
Microsoft |
65,730.104 |
12/08/24 |
0.19 |
73,795.901 |
-10.93 |
54,336.984 |
19,458.917 |
35.81 |
|
33.91 |
| | |
|
|
|
|
|
Siemens |
27,244.018 |
12/08/24 |
0.01 |
30,696.313 |
-11.25 |
25,024.025 |
5,672.288 |
22.67 |
|
22.71 |
| | |
|
|
|
|
|
Merck (MSD) |
18,335.469 |
12/08/24 |
-0.93 |
20,665.373 |
-11.27 |
15,464.711 |
5,200.662 |
33.63 |
|
21.56 |
| | |
|
|
|
L |
|
Alphabet A |
26,221.918 |
12/08/24 |
-0.84 |
29,566.510 |
-11.31 |
19,028.396 |
10,538.114 |
55.38 |
|
41.74 |
| | |
|
|
|
|
|
Boeing |
26,519.215 |
12/08/24 |
-2.25 |
30,165.951 |
-12.09 |
34,572.594 |
-4,406.643 |
-12.75 |
|
-0.18 |
| | |
|
|
|
L |
|
NVidia |
17,614.847 |
12/08/24 |
4.08 |
20,083.705 |
-12.29 |
6,699.020 |
13,384.685 |
199.80 |
|
138.37 |
| | |
|
|
|
|
|
Walt Disney |
13,887.325 |
12/08/24 |
-0.30 |
15,840.760 |
-12.33 |
13,543.766 |
2,296.993 |
16.96 |
|
12.48 |
| | |
|
|
|
|
|
Amazon.com |
26,950.619 |
12/08/24 |
-0.08 |
31,862.483 |
-15.42 |
21,320.282 |
10,542.201 |
49.45 |
|
41.28 |
| | |
|
|
|
|
|
Toyota |
2,447.500 |
9/08/24 |
-0.14 |
3,284.000 |
-25.47 |
2,767.500 |
516.500 |
18.66 |
|
6.66 |
| |
|
⇓instrument |
freshest |
⇓ Δday |
1/07/24 |
Δwk |
4/12/23 |
prc diff |
⇓ Δ30 |
|
⇓∅-RS |
| | |
|
|
|
S |
|
Intel |
3,128.081 |
12/08/24 |
-1.78 |
4,982.956 |
-37.22 |
6,233.871 |
-1,250.915 |
-20.07 |
|
-10.97 |
| DJ Global Titans - 50 out of 50 instruments rated - 1/07/24 / 4/12/23 - 46 did rise, Market-Ratio(30) in JPY = 92.00 % |
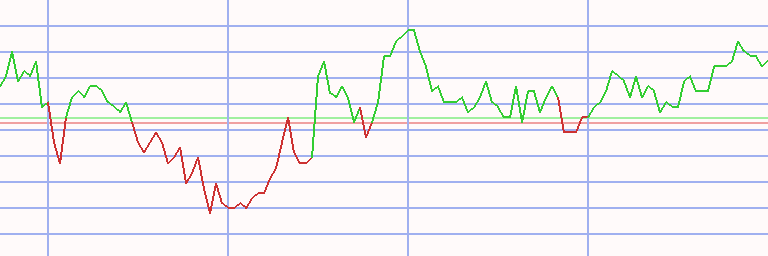
Technical Chart
Transactions DJ Global Titans 50 in Japanese yen * A30 - 54/52 (1)
|
⇐ |
| |
| L/S | date buy | date sell | days | | instrument | spl | pieces | | prc buy | prc sell | ps short | prc diff | d % | asset | yield | |
| 2/01/06 |
19/06/06 |
168 |
|
- cash - |
| short |
19/06/06 |
26/06/06 |
7 |
|
|
|
Intel |
100 |
4 |
|
2,100.665 |
2,130.255 |
2,071.076 |
-29.590 |
-1 |
9,882 |
-52 |
|
| long |
26/06/06 |
14/01/08 |
567 |
|
|
|
Gazprom |
100 |
5 |
|
1,947.220 |
2,328.963 |
|
381.743 |
20 |
11,790 |
12 |
|
| short |
14/01/08 |
4/05/09 |
476 |
|
|
|
Citigroup |
100 |
0 |
|
31,630.306 |
3,173.233 |
315,286.127 |
283,655.821 |
897 |
11,790 |
0 |
|
| long |
4/05/09 |
25/05/09 |
21 |
|
|
|
Qualcomm |
100 |
2 |
|
4,298.739 |
4,102.948 |
|
-195.791 |
-5 |
11,399 |
-56 |
|
| short |
25/05/09 |
1/06/09 |
7 |
|
|
|
Citigroup |
100 |
3 |
|
3,573.138 |
3,517.614 |
3,629.538 |
56.400 |
2 |
11,568 |
126 |
|
| long |
1/06/09 |
22/06/09 |
21 |
|
|
|
Qualcomm |
100 |
2 |
|
4,232.576 |
4,274.671 |
|
42.094 |
1 |
11,652 |
19 |
|
| short |
22/06/09 |
29/06/09 |
7 |
|
|
|
Citigroup |
100 |
4 |
|
2,888.291 |
2,874.779 |
2,901.867 |
13.576 |
0 |
11,706 |
28 |
|
| long |
29/06/09 |
6/07/09 |
7 |
|
|
|
Apple |
100 |
24 |
|
482.644 |
475.442 |
|
-7.202 |
-1 |
11,534 |
-54 |
|
| short |
6/07/09 |
13/07/09 |
7 |
|
|
|
Citigroup |
100 |
4 |
|
2,679.629 |
2,573.350 |
2,790.298 |
110.669 |
4 |
11,976 |
725 |
|
| long |
13/07/09 |
17/05/10 |
308 |
|
|
|
Apple |
100 |
25 |
|
470.562 |
839.509 |
|
368.947 |
78 |
21,200 |
99 |
|
| short |
17/05/10 |
31/05/10 |
14 |
|
|
|
Qualcomm |
100 |
6 |
|
3,454.939 |
3,193.482 |
3,737.803 |
282.864 |
8 |
22,897 |
678 |
|
| long |
31/05/10 |
7/06/10 |
7 |
|
|
|
Apple |
100 |
26 |
|
848.249 |
824.219 |
|
-24.029 |
-3 |
22,272 |
-78 |
|
| short |
7/06/10 |
6/09/10 |
91 |
|
|
|
Qualcomm |
100 |
6 |
|
3,219.808 |
3,419.898 |
3,019.718 |
-200.090 |
-6 |
21,072 |
-23 |
|
| long |
6/09/10 |
27/09/10 |
21 |
|
|
|
Apple |
100 |
27 |
|
776.137 |
875.752 |
|
99.616 |
13 |
23,761 |
716 |
|
| short |
27/09/10 |
22/11/10 |
56 |
|
|
|
BP |
100 |
44 |
|
538.312 |
575.422 |
501.203 |
-37.110 |
-7 |
22,129 |
-37 |
|
| long |
22/11/10 |
25/07/11 |
245 |
|
|
|
Apple |
100 |
23 |
|
934.945 |
1,117.393 |
|
182.448 |
20 |
26,325 |
30 |
|
| short |
25/07/11 |
26/12/11 |
154 |
|
|
|
Bank of America |
100 |
33 |
|
785.913 |
428.048 |
1,442.967 |
657.055 |
84 |
48,008 |
322 |
|
| long |
26/12/11 |
23/01/12 |
28 |
|
|
|
Philip Morris |
100 |
7 |
|
6,157.479 |
5,765.946 |
|
-391.534 |
-6 |
45,267 |
-58 |
|
| short |
23/01/12 |
6/02/12 |
14 |
|
|
|
Bank of America |
100 |
81 |
|
558.417 |
610.462 |
506.373 |
-52.045 |
-9 |
41,051 |
-92 |
|
| long |
6/02/12 |
21/05/12 |
105 |
|
|
|
Apple |
100 |
32 |
|
1,269.193 |
1,584.398 |
|
315.205 |
25 |
51,138 |
116 |
|
| short |
21/05/12 |
28/05/12 |
7 |
|
|
|
Telefónica |
100 |
51 |
|
990.925 |
942.206 |
1,042.163 |
51.238 |
5 |
53,751 |
1,286 |
|
| long |
28/05/12 |
22/10/12 |
147 |
|
|
|
Apple |
100 |
33 |
|
1,627.636 |
1,795.814 |
|
168.177 |
10 |
59,301 |
28 |
|
| short |
22/10/12 |
29/10/12 |
7 |
|
|
|
Telefónica |
100 |
54 |
|
1,084.545 |
1,037.613 |
1,133.600 |
49.055 |
5 |
61,950 |
904 |
|
| long |
29/10/12 |
16/12/13 |
413 |
|
|
|
Bank of America |
100 |
83 |
|
742.258 |
1,570.182 |
|
827.924 |
112 |
130,668 |
94 |
|
| short |
16/12/13 |
23/12/13 |
7 |
|
|
|
IBM |
100 |
7 |
|
18,323.940 |
18,965.119 |
17,682.761 |
-641.179 |
-3 |
126,179 |
-84 |
|
| L/S | date buy | date sell | days | | instrument | spl | pieces | | prc buy | prc sell | ps short | prc diff | d % | asset | yield | | | long |
23/12/13 |
27/10/14 |
308 |
|
|
|
Alphabet A |
100 |
43 |
|
2,910.261 |
2,965.511 |
|
55.250 |
2 |
128,555 |
2 |
|
| short |
27/10/14 |
10/11/14 |
14 |
|
|
|
Samsung Electronics |
100 |
57,280 |
|
2.244 |
2.674 |
1.815 |
-0.430 |
-19 |
103,952 |
-100 |
|
| long |
10/11/14 |
15/12/14 |
35 |
|
|
|
Apple |
100 |
33 |
|
3,123.804 |
3,188.052 |
|
64.248 |
2 |
106,072 |
24 |
|
| short |
15/12/14 |
2/03/15 |
77 |
|
|
|
Gazprom |
100 |
216 |
|
489.221 |
603.836 |
374.606 |
-114.615 |
-23 |
81,315 |
-72 |
|
| long |
2/03/15 |
30/03/15 |
28 |
|
|
|
Apple |
100 |
20 |
|
3,877.231 |
3,793.988 |
|
-83.243 |
-2 |
79,651 |
-25 |
|
| short |
30/03/15 |
27/04/15 |
28 |
|
|
|
ConocoPhilips |
100 |
10 |
|
7,685.850 |
7,983.023 |
7,388.678 |
-297.173 |
-4 |
76,679 |
-40 |
|
| long |
27/04/15 |
8/06/15 |
42 |
|
|
|
Mitsubishi UFJ |
100 |
9,117 |
|
8.410 |
8.960 |
|
0.550 |
7 |
81,693 |
73 |
|
| short |
8/06/15 |
13/07/15 |
35 |
|
|
|
BHP |
100 |
30 |
|
2,674.094 |
2,415.427 |
2,960.462 |
286.368 |
11 |
90,284 |
189 |
|
| long |
13/07/15 |
27/07/15 |
14 |
|
|
|
Mitsubishi UFJ |
100 |
10,584 |
|
8.530 |
8.800 |
|
0.270 |
3 |
93,142 |
125 |
|
| short |
27/07/15 |
3/08/15 |
7 |
|
|
|
ConocoPhilips |
100 |
14 |
|
6,243.409 |
6,164.848 |
6,322.971 |
79.562 |
1 |
94,256 |
94 |
|
| long |
3/08/15 |
24/08/15 |
21 |
|
|
|
Mitsubishi UFJ |
100 |
10,698 |
|
8.810 |
7.410 |
|
-1.400 |
-16 |
79,279 |
-95 |
|
| short |
24/08/15 |
21/03/16 |
210 |
|
|
|
ConocoPhilips |
100 |
15 |
|
5,084.191 |
4,766.240 |
5,423.353 |
339.162 |
7 |
84,366 |
12 |
|
| long |
21/03/16 |
28/03/16 |
7 |
|
|
|
McDonald´s |
100 |
6 |
|
13,858.810 |
13,971.735 |
|
112.925 |
1 |
85,044 |
53 |
|
| short |
28/03/16 |
11/04/16 |
14 |
|
|
|
Mitsubishi UFJ |
100 |
16,106 |
|
5.280 |
4.730 |
5.894 |
0.614 |
12 |
94,933 |
1,660 |
|
| long |
11/04/16 |
9/05/16 |
28 |
|
|
|
McDonald´s |
100 |
6 |
|
13,773.058 |
14,173.115 |
|
400.057 |
3 |
97,333 |
45 |
|
| short |
9/05/16 |
4/07/16 |
56 |
|
|
|
Mitsubishi UFJ |
100 |
19,631 |
|
4.958 |
4.553 |
5.399 |
0.441 |
9 |
105,990 |
74 |
|
| long |
4/07/16 |
5/03/18 |
609 |
|
|
|
BP |
100 |
174 |
|
607.840 |
691.401 |
|
83.561 |
14 |
120,530 |
8 |
|
| short |
5/03/18 |
12/03/18 |
7 |
|
|
|
General Electric |
100 |
9 |
|
12,254.160 |
12,873.053 |
11,635.267 |
-618.893 |
-5 |
114,960 |
-93 |
|
| long |
12/03/18 |
9/04/18 |
28 |
|
|
|
Intel |
100 |
20 |
|
5,490.229 |
5,289.730 |
|
-200.499 |
-4 |
110,950 |
-38 |
|
| short |
9/04/18 |
3/09/18 |
147 |
|
|
|
General Electric |
100 |
10 |
|
10,957.374 |
11,496.303 |
10,418.445 |
-538.929 |
-5 |
105,561 |
-12 |
|
| long |
3/09/18 |
26/11/18 |
84 |
|
|
|
Apple |
100 |
16 |
|
6,319.802 |
4,954.061 |
|
-1,365.741 |
-22 |
83,709 |
-65 |
|
| short |
26/11/18 |
1/04/19 |
126 |
|
|
|
General Electric |
100 |
12 |
|
6,881.554 |
8,999.079 |
4,764.029 |
-2,117.525 |
-31 |
58,298 |
-66 |
|
| long |
1/04/19 |
22/04/19 |
21 |
|
|
|
Procter & Gamble |
100 |
5 |
|
11,542.878 |
11,863.048 |
|
320.170 |
3 |
59,899 |
61 |
|
| short |
22/04/19 |
29/04/19 |
7 |
|
|
|
Schlumberger |
100 |
11 |
|
5,130.844 |
4,857.059 |
5,420.061 |
289.217 |
6 |
63,081 |
1,645 |
|
| long |
29/04/19 |
3/06/19 |
35 |
|
|
|
Qualcomm |
100 |
6 |
|
9,757.735 |
7,204.503 |
|
-2,553.232 |
-26 |
47,761 |
-96 |
|
| L/S | date buy | date sell | days | | instrument | spl | pieces | | prc buy | prc sell | ps short | prc diff | d % | asset | yield | | | short |
3/06/19 |
10/06/19 |
7 |
|
|
|
Schlumberger |
100 |
12 |
|
3,835.701 |
3,846.718 |
3,824.684 |
-11.017 |
0 |
47,629 |
-14 |
|
| long |
10/06/19 |
24/02/20 |
259 |
|
|
|
Gazprom |
100 |
61 |
|
768.327 |
759.727 |
|
-8.600 |
-1 |
47,104 |
-2 |
|
| short |
24/02/20 |
5/10/20 |
224 |
|
|
|
Exxon Mobil |
100 |
7 |
|
6,236.354 |
3,566.434 |
10,905.039 |
4,668.685 |
75 |
79,785 |
149 |
|
| long |
5/10/20 |
7/03/22 |
518 |
|
|
|
Apple |
100 |
6 |
|
12,314.452 |
18,375.926 |
|
6,061.474 |
49 |
116,154 |
33 |
|
| short |
7/03/22 |
28/03/22 |
21 |
|
|
|
Gazprom |
100 |
342 |
|
338.796 |
366.152 |
311.440 |
-27.356 |
-8 |
106,798 |
-77 |
|
| long |
28/03/22 |
13/06/22 |
77 |
|
|
|
ConocoPhilips |
100 |
8 |
|
12,774.023 |
14,992.320 |
|
2,218.297 |
17 |
124,545 |
114 |
|
| short |
13/06/22 |
9/01/23 |
210 |
|
|
|
General Electric |
100 |
13 |
|
9,084.466 |
9,571.954 |
8,596.978 |
-487.488 |
-5 |
118,207 |
-9 |
|
| long |
9/01/23 |
13/03/23 |
63 |
|
|
|
Schlumberger |
100 |
16 |
|
7,328.795 |
6,500.876 |
|
-827.919 |
-11 |
104,961 |
-50 |
|
| short |
13/03/23 |
27/03/23 |
14 |
|
|
|
3M |
100 |
7 |
|
13,776.427 |
13,345.965 |
14,220.772 |
444.346 |
3 |
108,071 |
129 |
|
| long |
27/03/23 |
30/10/23 |
217 |
|
|
|
NVidia |
100 |
30 |
|
3,488.834 |
6,133.216 |
|
2,644.382 |
76 |
187,402 |
158 |
|
| short |
30/10/23 |
4/12/23 |
35 |
|
|
|
Pfizer |
100 |
41 |
|
4,552.119 |
4,309.982 |
4,807.858 |
255.739 |
6 |
197,888 |
77 |
|
| long |
4/12/23 |
12/08/24 |
252 |
|
|
|
NVidia |
100 |
29 |
|
6,699.020 |
17,614.847 |
|
10,915.827 |
163 |
514,447 |
306 |
|
| accum | 19/06/06 |
12/08/24 | 7331 |
days out of 7499 invested (98%) |
5,044 |
514,447 |
22 |
|
Instrument Related Contribution
| instrument | L/S | date buy | date sell | days | prc buy | prc sell | ps short | prc diff | d % | | | total |
| Citigroup | short | 14/01/08 | 4/05/09 | 476 | 31,630.31 | 3,173.23 | 315,286.13 | 283,655.82 | 896.78 | | | |
| | short | 25/05/09 | 1/06/09 | 7 | 3,573.14 | 3,517.61 | 3,629.54 | 56.40 | 1.58 | | | |
| | short | 22/06/09 | 29/06/09 | 7 | 2,888.29 | 2,874.78 | 2,901.87 | 13.58 | 0.47 | | | |
| | short | 6/07/09 | 13/07/09 | 7 | 2,679.63 | 2,573.35 | 2,790.30 | 110.67 | 4.13 | | | 959.29 |
| NVidia | long | 27/03/23 | 30/10/23 | 217 | 3,488.83 | 6,133.22 | | 2,644.38 | 75.80 | | | |
| | long | 4/12/23 | 12/08/24 | 252 | 6,699.02 | 17,614.85 | | 10,915.83 | 162.95 | | | 362.25 |
| Apple | long | 29/06/09 | 6/07/09 | 7 | 482.64 | 475.44 | | -7.20 | -1.49 | | | |
| | long | 13/07/09 | 17/05/10 | 308 | 470.56 | 839.51 | | 368.95 | 78.41 | | | |
| | long | 31/05/10 | 7/06/10 | 7 | 848.25 | 824.22 | | -24.03 | -2.83 | | | |
| | long | 6/09/10 | 27/09/10 | 21 | 776.14 | 875.75 | | 99.62 | 12.83 | | | |
| | long | 22/11/10 | 25/07/11 | 245 | 934.95 | 1,117.39 | | 182.45 | 19.51 | | | |
| | long | 6/02/12 | 21/05/12 | 105 | 1,269.19 | 1,584.40 | | 315.20 | 24.84 | | | |
| | long | 28/05/12 | 22/10/12 | 147 | 1,627.64 | 1,795.81 | | 168.18 | 10.33 | | | |
| | long | 10/11/14 | 15/12/14 | 35 | 3,123.80 | 3,188.05 | | 64.25 | 2.06 | | | |
| | long | 2/03/15 | 30/03/15 | 28 | 3,877.23 | 3,793.99 | | -83.24 | -2.15 | | | |
| | long | 3/09/18 | 26/11/18 | 84 | 6,319.80 | 4,954.06 | | -1,365.74 | -21.61 | | | |
| | long | 5/10/20 | 7/03/22 | 518 | 12,314.45 | 18,375.93 | | 6,061.47 | 49.22 | | | 270.52 |
| Bank of America | short | 25/07/11 | 26/12/11 | 154 | 785.91 | 428.05 | 1,442.97 | 657.05 | 83.60 | | | |
| | short | 23/01/12 | 6/02/12 | 14 | 558.42 | 610.46 | 506.37 | -52.04 | -9.32 | | | |
| | long | 29/10/12 | 16/12/13 | 413 | 742.26 | 1,570.18 | | 827.92 | 111.54 | | | 252.20 |
| Exxon Mobil | short | 24/02/20 | 5/10/20 | 224 | 6,236.35 | 3,566.43 | 10,905.04 | 4,668.69 | 74.86 | | | 74.86 |
| ConocoPhilips | short | 30/03/15 | 27/04/15 | 28 | 7,685.85 | 7,983.02 | 7,388.68 | -297.17 | -3.87 | | | |
| | short | 27/07/15 | 3/08/15 | 7 | 6,243.41 | 6,164.85 | 6,322.97 | 79.56 | 1.27 | | | |
| | short | 24/08/15 | 21/03/16 | 210 | 5,084.19 | 4,766.24 | 5,423.35 | 339.16 | 6.67 | | | |
| | long | 28/03/22 | 13/06/22 | 77 | 12,774.02 | 14,992.32 | | 2,218.30 | 17.37 | | | 21.89 |
| instrument | L/S | date buy | date sell | days | prc buy | prc sell | ps short | prc diff | d % | | | total |
| Mitsubishi UFJ | long | 27/04/15 | 8/06/15 | 42 | 8.41 | 8.96 | | 0.55 | 6.54 | | | |
| | long | 13/07/15 | 27/07/15 | 14 | 8.53 | 8.80 | | 0.27 | 3.17 | | | |
| | long | 3/08/15 | 24/08/15 | 21 | 8.81 | 7.41 | | -1.40 | -15.89 | | | |
| | short | 28/03/16 | 11/04/16 | 14 | 5.28 | 4.73 | 5.89 | 0.61 | 11.63 | | | |
| | short | 9/05/16 | 4/07/16 | 56 | 4.96 | 4.55 | 5.40 | 0.44 | 8.89 | | | 12.38 |
| BHP | short | 8/06/15 | 13/07/15 | 35 | 2,674.09 | 2,415.43 | 2,960.46 | 286.37 | 10.71 | | | 10.71 |
| Telefónica | short | 21/05/12 | 28/05/12 | 7 | 990.93 | 942.21 | 1,042.16 | 51.24 | 5.17 | | | |
| | short | 22/10/12 | 29/10/12 | 7 | 1,084.55 | 1,037.61 | 1,133.60 | 49.05 | 4.52 | | | 9.93 |
| BP | short | 27/09/10 | 22/11/10 | 56 | 538.31 | 575.42 | 501.20 | -37.11 | -6.89 | | | |
| | long | 4/07/16 | 5/03/18 | 609 | 607.84 | 691.40 | | 83.56 | 13.75 | | | 5.91 |
| Pfizer | short | 30/10/23 | 4/12/23 | 35 | 4,552.12 | 4,309.98 | 4,807.86 | 255.74 | 5.62 | | | 5.62 |
| McDonald´s | long | 21/03/16 | 28/03/16 | 7 | 13,858.81 | 13,971.74 | | 112.93 | 0.81 | | | |
| | long | 11/04/16 | 9/05/16 | 28 | 13,773.06 | 14,173.12 | | 400.06 | 2.90 | | | 3.74 |
| 3M | short | 13/03/23 | 27/03/23 | 14 | 13,776.43 | 13,345.97 | 14,220.77 | 444.35 | 3.23 | | | 3.23 |
| Procter & Gamble | long | 1/04/19 | 22/04/19 | 21 | 11,542.88 | 11,863.05 | | 320.17 | 2.77 | | | 2.77 |
| Alphabet A | long | 23/12/13 | 27/10/14 | 308 | 2,910.26 | 2,965.51 | | 55.25 | 1.90 | | | 1.90 |
| IBM | short | 16/12/13 | 23/12/13 | 7 | 18,323.94 | 18,965.12 | 17,682.76 | -641.18 | -3.50 | | | -3.50 |
| Intel | short | 19/06/06 | 26/06/06 | 7 | 2,100.67 | 2,130.26 | 2,071.08 | -29.59 | -1.41 | | | |
| | long | 12/03/18 | 9/04/18 | 28 | 5,490.23 | 5,289.73 | | -200.50 | -3.65 | | | -5.01 |
| Philip Morris | long | 26/12/11 | 23/01/12 | 28 | 6,157.48 | 5,765.95 | | -391.53 | -6.36 | | | -6.36 |
| Schlumberger | short | 22/04/19 | 29/04/19 | 7 | 5,130.84 | 4,857.06 | 5,420.06 | 289.22 | 5.64 | | | |
| | short | 3/06/19 | 10/06/19 | 7 | 3,835.70 | 3,846.72 | 3,824.68 | -11.02 | -0.29 | | | |
| | long | 9/01/23 | 13/03/23 | 63 | 7,328.79 | 6,500.88 | | -827.92 | -11.30 | | | -6.57 |
| Gazprom | long | 26/06/06 | 14/01/08 | 567 | 1,947.22 | 2,328.96 | | 381.74 | 19.60 | | | |
| | short | 15/12/14 | 2/03/15 | 77 | 489.22 | 603.84 | 374.61 | -114.62 | -23.43 | | | |
| | long | 10/06/19 | 24/02/20 | 259 | 768.33 | 759.73 | | -8.60 | -1.12 | | | |
| | short | 7/03/22 | 28/03/22 | 21 | 338.80 | 366.15 | 311.44 | -27.36 | -8.07 | | | -16.75 |
| instrument | L/S | date buy | date sell | days | prc buy | prc sell | ps short | prc diff | d % | | | total |
| Samsung Electronics | short | 27/10/14 | 10/11/14 | 14 | 2.24 | 2.67 | 1.81 | -0.43 | -19.14 | | | -19.14 |
| Qualcomm | long | 4/05/09 | 25/05/09 | 21 | 4,298.74 | 4,102.95 | | -195.79 | -4.55 | | | |
| | long | 1/06/09 | 22/06/09 | 21 | 4,232.58 | 4,274.67 | | 42.09 | 0.99 | | | |
| | short | 17/05/10 | 31/05/10 | 14 | 3,454.94 | 3,193.48 | 3,737.80 | 282.86 | 8.19 | | | |
| | short | 7/06/10 | 6/09/10 | 91 | 3,219.81 | 3,419.90 | 3,019.72 | -200.09 | -6.21 | | | |
| | long | 29/04/19 | 3/06/19 | 35 | 9,757.74 | 7,204.50 | | -2,553.23 | -26.17 | | | -27.79 |
| General Electric | short | 5/03/18 | 12/03/18 | 7 | 12,254.16 | 12,873.05 | 11,635.27 | -618.89 | -5.05 | | | |
| | short | 9/04/18 | 3/09/18 | 147 | 10,957.37 | 11,496.30 | 10,418.45 | -538.93 | -4.92 | | | |
| | short | 26/11/18 | 1/04/19 | 126 | 6,881.55 | 8,999.08 | 4,764.03 | -2,117.52 | -30.77 | | | |
| | short | 13/06/22 | 9/01/23 | 210 | 9,084.47 | 9,571.95 | 8,596.98 | -487.49 | -5.37 | | | -40.85 |
Annotations
| 10/06/24 | NVidia | | | stock split 1:10 (ten for one) |
| 26/02/24 | Walmart | | | stock split 1:3 (three for one) |
| 18/07/22 | Alphabet A | | | stock split 1:20 (twenty for one) |
| | GlaxoSmithKline | | | demergers OTC business -> Haleon |
| 6/06/22 | Amazon.com | | | stock split 1:20 (twenty for one) |
| 29/09/21 | Toyota | | | stock split 1:5 (five for one) |
| 2/08/21 | General Electric | | | reverse stock split 8:1 (eight become one) |
| 20/07/21 | NVidia | | | stock split 1:4 (four for one) |
| 4/05/18 | Samsung Electronics | | | stock split 1:50 (fifty for one) |
| 4/10/16 | AB InBev | | | acquisition of SAB Miller completed |
| 2/10/15 | Google A | | | changes name to Alphabet |
| 19/03/15 | Visa | | | forward stock split 1:4 (four for one) |
|
|