| | |
| | |

Assessment - Pharmaceuticals - 7/01/24 - RS = 26
⇐
| |
|
⇓instrument |
freshest |
⇓ Δday |
7/01/24 |
⇓ Δwk |
1/01/24 |
prc diff |
⇓ Δ26 |
Curr |
∅-RS |
| |  |
 |
 |
|
L |
 |
SOM Pharmaceuticals |
860.322 |
7/16 |
-0.02 |
838.652 |
2.58 |
824.522 |
14.130 |
1.71 |
USD |
1.86 |
| | |
|
|
|
L |
|
UCB |
143.850 |
7/15 |
|
140.250 |
2.57 |
78.900 |
61.350 |
77.76 |
EUR |
56.25 |
| | |
|
|
|
|
|
Rovi |
86.000 |
7/15 |
-0.35 |
86.800 |
-0.92 |
60.200 |
26.600 |
44.19 |
EUR |
50.14 |
| | |
|
|
|
|
|
Eli Lilly |
950.460 |
7/15 |
0.22 |
914.370 |
3.95 |
582.920 |
331.450 |
56.86 |
USD |
44.96 |
| | |
|
|
|
L |
|
Moderna |
121.480 |
7/15 |
0.02 |
115.950 |
4.77 |
99.450 |
16.500 |
16.59 |
USD |
35.23 |
| | |
|
|
|
L |
|
Hansoh Pharma |
16.460 |
7/15 |
-2.02 |
16.320 |
0.86 |
15.760 |
0.560 |
3.55 |
HKD |
32.80 |
| | |
|
|
|
|
|
Cipla |
1,517.200 |
7/15 |
0.34 |
1,479.100 |
2.58 |
1,246.300 |
232.800 |
18.68 |
INR |
23.43 |
| | |
|
|
|
L |
|
Divi's Laboratories |
4,575.400 |
7/15 |
0.80 |
4,602.100 |
-0.58 |
3,903.900 |
698.200 |
17.88 |
INR |
23.37 |
| | |
|
|
|
L |
|
Vertex |
490.850 |
7/15 |
0.43 |
471.250 |
4.16 |
406.890 |
64.360 |
15.82 |
USD |
23.06 |
| | |
|
|
|
L |
|
Daiichi Sankyo |
5,987.000 |
7/12 |
-0.66 |
5,427.000 |
10.32 |
3,872.000 |
1,555.000 |
40.16 |
JPY |
21.80 |
| | |
|
|
|
|
|
Regeneron |
1,082.110 |
7/15 |
-1.63 |
1,057.020 |
2.37 |
878.290 |
178.730 |
20.35 |
USD |
21.37 |
| | |
|
|
|
|
|
Sun Pharma |
1,586.200 |
7/15 |
0.56 |
1,520.100 |
4.35 |
1,259.450 |
260.650 |
20.70 |
INR |
19.15 |
| | |
|
|
|
|
|
Aspen Pharmacare |
11.700 |
7/16 |
-0.85 |
11.800 |
-0.85 |
9.600 |
2.200 |
22.92 |
EUR |
17.85 |
| | |
|
|
|
L |
|
AstraZeneca |
12,104.000 |
7/15 |
-1.27 |
12,304.000 |
-1.63 |
10,600.000 |
1,704.000 |
16.08 |
GBP |
15.63 |
| | |
|
|
|
L |
|
Genomma Lab |
17.980 |
7/15 |
-2.65 |
17.030 |
5.58 |
14.160 |
2.870 |
20.27 |
MXN |
13.94 |
| | |
|
|
|
|
|
Merck (MSD) |
128.120 |
7/15 |
0.28 |
127.900 |
0.17 |
109.020 |
18.880 |
17.32 |
USD |
11.58 |
| | |
|
|
|
L |
|
Alcon |
80.700 |
7/15 |
-1.25 |
80.180 |
0.65 |
65.640 |
14.540 |
22.15 |
CHF |
11.19 |
| | |
|
|
|
L |
|
Merck (EMD) |
151.750 |
7/15 |
-1.62 |
152.050 |
-0.20 |
144.100 |
7.950 |
5.52 |
EUR |
11.19 |
| | |
|
|
|
|
|
Otsuka |
7,132.000 |
7/12 |
-0.93 |
6,884.000 |
3.60 |
5,289.000 |
1,595.000 |
30.16 |
JPY |
10.47 |
| | |
|
|
|
|
|
AbbVie |
168.030 |
7/15 |
-0.41 |
170.370 |
-1.37 |
154.970 |
15.400 |
9.94 |
USD |
9.65 |
| | |
|
|
|
L |
|
Lundbeck B |
39.540 |
7/15 |
-1.30 |
38.600 |
2.44 |
32.760 |
5.840 |
17.83 |
DKK |
8.91 |
| | |
|
|
|
L |
|
Ipsen |
111.100 |
7/15 |
-0.45 |
113.500 |
-2.11 |
107.900 |
5.600 |
5.19 |
EUR |
8.20 |
| | |
|
|
|
L |
|
CSL |
308.560 |
7/15 |
0.64 |
292.600 |
5.45 |
286.650 |
5.950 |
2.08 |
AUD |
6.64 |
| | |
|
|
|
|
|
Dr. Reddy's Labs |
6,794.750 |
7/15 |
1.12 |
6,353.700 |
6.94 |
5,797.900 |
555.800 |
9.59 |
INR |
6.04 |
| | |
|
|
|
L |
|
CSPC Pharmaceutical |
6.060 |
7/15 |
-1.94 |
6.220 |
-2.57 |
7.260 |
-1.040 |
-14.33 |
HKD |
5.80 |
| |
|
⇓instrument |
freshest |
⇓ Δday |
7/01/24 |
⇓ Δwk |
1/01/24 |
prc diff |
⇓ Δ26 |
Curr |
∅-RS |
| | |
|
|
|
|
|
GSK |
1,498.000 |
7/15 |
-1.25 |
1,526.000 |
-1.83 |
1,450.200 |
75.800 |
5.23 |
GBP |
5.65 |
| | |
|
|
|
L |
|
Novartis |
99.100 |
7/15 |
-0.96 |
96.720 |
2.46 |
84.870 |
11.850 |
13.96 |
CHF |
5.45 |
| | |
|
|
|
|
|
Kyowa Kirin |
3,107.000 |
7/12 |
0.19 |
2,772.000 |
12.09 |
2,370.000 |
402.000 |
16.96 |
JPY |
4.91 |
| | |
|
|
|
L |
|
Orion |
40.880 |
7/15 |
-0.58 |
41.440 |
-1.35 |
39.270 |
2.170 |
5.53 |
EUR |
2.00 |
| | |
|
|
|
|
|
Chugai |
6,284.000 |
7/12 |
-1.10 |
5,648.000 |
11.26 |
5,342.000 |
306.000 |
5.73 |
JPY |
1.64 |
| | |
|
|
|
|
|
IDEXX Labs |
482.700 |
7/15 |
-2.04 |
476.400 |
1.32 |
555.050 |
-78.650 |
-14.17 |
USD |
0.66 |
| | |
|
|
|
L |
|
Roche |
258.700 |
7/15 |
1.53 |
250.100 |
3.44 |
244.500 |
5.600 |
2.29 |
CHF |
0.61 |
| | |
|
|
|
|
|
Recordati |
51.050 |
7/15 |
0.20 |
48.800 |
4.61 |
48.830 |
-0.030 |
-0.06 |
EUR |
0.41 |
| | |
|
|
|
|
|
Bavarian Nordic |
176.300 |
7/15 |
-0.87 |
171.650 |
2.71 |
177.450 |
-5.800 |
-3.27 |
DKK |
0.03 |
| | |
|
|
|
|
|
Haleon |
332.500 |
7/15 |
-1.34 |
324.700 |
2.40 |
321.650 |
3.050 |
0.95 |
GBP |
-1.14 |
| | |
|
|
|
L |
|
Sinopharm |
19.600 |
7/15 |
-1.31 |
20.750 |
-5.54 |
20.200 |
0.550 |
2.72 |
HKD |
-2.10 |
| | |
|
|
|
|
|
Abbott Labs |
102.960 |
7/15 |
-0.68 |
103.200 |
-0.23 |
110.070 |
-6.870 |
-6.24 |
USD |
-2.50 |
| | |
|
|
|
|
|
Takeda |
4,298.000 |
7/12 |
-0.32 |
4,192.000 |
2.53 |
4,054.000 |
138.000 |
3.40 |
JPY |
-3.24 |
| | |
|
|
|
S |
|
Jiangsu Hengrui Med |
40.780 |
7/15 |
-1.19 |
38.270 |
6.56 |
45.230 |
-6.960 |
-15.39 |
CNY |
-3.34 |
| | |
|
|
|
|
|
Sanofi |
92.430 |
7/15 |
-2.09 |
91.850 |
0.63 |
89.760 |
2.090 |
2.33 |
EUR |
-4.86 |
| | |
|
|
|
L |
|
Dermapharm |
35.800 |
7/15 |
-0.56 |
35.800 |
|
42.340 |
-6.540 |
-15.45 |
EUR |
-7.56 |
| | |
|
|
|
S |
|
Shionogi |
6,643.000 |
7/12 |
-0.70 |
6,232.000 |
6.59 |
6,798.000 |
-566.000 |
-8.33 |
JPY |
-10.21 |
| | |
|
|
|
S |
|
SK Biopharmaceutical |
81,800.000 |
7/15 |
-1.45 |
78,900.000 |
3.68 |
103,100.000 |
-24,200.000 |
-23.47 |
KRW |
-10.35 |
| | |
|
|
|
|
|
Zhangzhou Pientze |
210.510 |
7/15 |
0.92 |
206.230 |
2.08 |
241.990 |
-35.760 |
-14.78 |
CNY |
-10.83 |
| | |
|
|
|
L |
|
Pfizer |
29.100 |
7/15 |
0.62 |
28.220 |
3.12 |
28.790 |
-0.570 |
-1.98 |
USD |
-11.15 |
| | |
|
|
|
|
|
BioNTech |
84.250 |
7/15 |
-0.82 |
78.830 |
6.88 |
105.540 |
-26.710 |
-25.31 |
USD |
-11.62 |
| | |
|
|
|
S |
|
Gilead Sciences |
70.810 |
7/15 |
1.21 |
68.640 |
3.16 |
81.010 |
-12.370 |
-15.27 |
USD |
-13.94 |
| | |
|
|
|
L |
|
Eisai |
6,958.000 |
7/12 |
0.46 |
6,680.000 |
4.16 |
7,052.000 |
-372.000 |
-5.28 |
JPY |
-14.78 |
| | |
|
|
|
L |
|
Astellas Pharma |
1,657.000 |
7/12 |
-0.30 |
1,588.500 |
4.31 |
1,686.000 |
-97.500 |
-5.78 |
JPY |
-16.10 |
| | |
|
|
|
L |
|
Boiron |
31.550 |
7/15 |
-3.81 |
30.000 |
5.17 |
40.220 |
-10.220 |
-25.41 |
EUR |
-16.23 |
| |
|
⇓instrument |
freshest |
⇓ Δday |
7/01/24 |
⇓ Δwk |
1/01/24 |
prc diff |
⇓ Δ26 |
Curr |
∅-RS |
| | |
|
|
|
S |
|
Ono Pharmaceutical |
2,263.000 |
7/12 |
1.41 |
2,221.000 |
1.89 |
2,516.000 |
-295.000 |
-11.72 |
JPY |
-16.46 |
| | |
|
|
|
S |
|
Bristol-Myers |
40.150 |
7/15 |
-0.77 |
41.300 |
-2.78 |
51.310 |
-10.010 |
-19.51 |
USD |
-22.23 |
| | |
|
|
|
L |
|
Sumitomo Pharma |
412.000 |
7/12 |
0.98 |
390.000 |
5.64 |
466.000 |
-76.000 |
-16.31 |
JPY |
-22.23 |
| | |
|
|
|
|
|
WuXi AppTec |
38.050 |
7/15 |
-1.93 |
38.660 |
-1.58 |
72.760 |
-34.100 |
-46.87 |
CNY |
-29.23 |
| | |
|
|
|
|
|
Valneva |
3.358 |
7/15 |
-2.27 |
3.254 |
3.20 |
4.720 |
-1.466 |
-31.06 |
EUR |
-30.18 |
| | |
|
|
|
|
|
Euroapi |
2.840 |
7/15 |
0.07 |
2.544 |
11.64 |
5.730 |
-3.186 |
-55.60 |
EUR |
-42.19 |
| | |
|
|
|
|
|
WuXi Biologics |
11.080 |
7/15 |
-3.32 |
11.540 |
-3.99 |
29.600 |
-18.060 |
-61.01 |
HKD |
-50.24 |
| Pharmaceuticals - 56 out of 56 instruments rated - 7/01/24 / 1/01/24 - 33 did rise, Market-Ratio(26) = 58.93 % |
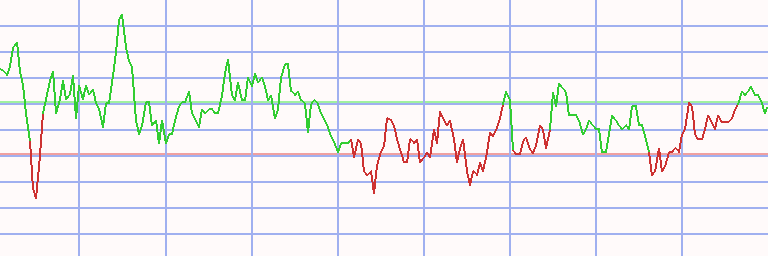
Technical Chart
Transactions Pharmaceuticals * 26 - 60/40 (2)
|
⇐ |
| |
| L/S | date buy | date sell | days | | instrument | spl | pieces | Curr | prc buy | prc sell | ps short | prc diff | d % | asset | yield | |
| 1/02/06 |
7/30/07 |
574 |
|
- cash - |
| short |
7/30/07 |
8/11/08 |
378 |
|
|
|
Chugai |
50 |
736 |
JPY |
6.787 |
5.667 |
8.128 |
1.341 |
20 |
10,987 |
19 |
|
| |
|
|
|
|
|
|
Cipla |
50 |
267 |
INR |
18.715 |
23.235 |
14.195 |
-4.520 |
-24 |
9,780 |
-23 |
|
| 100 |
-2 |
-2 | |
| long |
8/11/08 |
10/13/08 |
63 |
|
|
|
Biotest |
50 |
246 |
EUR |
19.800 |
13.763 |
|
-6.037 |
-30 |
8,295 |
-88 |
|
| |
|
|
|
|
|
|
Alexion |
50 |
206 |
USD |
23.752 |
19.445 |
|
-4.307 |
-18 |
7,408 |
-69 |
|
| 100 |
-24 |
-80 | |
| short |
10/13/08 |
8/24/09 |
315 |
|
|
|
Genfit |
50 |
764 |
EUR |
4.844 |
5.954 |
3.734 |
-1.110 |
-23 |
6,560 |
-26 |
|
| |
|
|
|
|
|
|
Innate Pharma |
50 |
2,808 |
EUR |
1.320 |
2.190 |
0.450 |
-0.870 |
-66 |
4,117 |
-71 |
|
| 100 |
-44 |
-49 | |
| long |
8/24/09 |
7/19/10 |
329 |
|
|
|
Aspen Pharmacare |
50 |
377 |
EUR |
5.450 |
8.380 |
|
2.930 |
54 |
5,222 |
61 |
|
| |
|
|
|
|
|
|
Kangmei Pharma |
50 |
515 |
CNY |
3.998 |
5.277 |
|
1.279 |
32 |
5,880 |
36 |
|
| 100 |
43 |
49 | |
| short |
7/19/10 |
11/08/10 |
112 |
|
|
|
Biotest |
50 |
315 |
EUR |
9.333 |
13.333 |
5.333 |
-4.000 |
-43 |
4,620 |
-84 |
|
| |
|
|
|
|
|
|
Ipsen |
50 |
111 |
EUR |
26.435 |
24.330 |
28.722 |
2.287 |
9 |
4,874 |
31 |
|
| 100 |
-17 |
-46 | |
| long |
11/08/10 |
8/08/11 |
273 |
|
|
|
Virbac |
50 |
20 |
EUR |
119.940 |
106.450 |
|
-13.490 |
-11 |
4,605 |
-15 |
|
| |
|
|
|
|
|
|
Kangmei Pharma |
50 |
272 |
CNY |
9.088 |
7.500 |
|
-1.588 |
-17 |
4,172 |
-23 |
|
| 100 |
-14 |
-19 | |
| short |
8/08/11 |
12/26/11 |
140 |
|
|
|
Genfit |
50 |
825 |
EUR |
2.526 |
1.585 |
4.026 |
1.500 |
59 |
5,410 |
237 |
|
| |
|
|
|
|
|
|
Ipsen |
50 |
108 |
EUR |
19.230 |
23.845 |
14.615 |
-4.615 |
-24 |
4,911 |
-51 |
|
| 100 |
18 |
53 | |
| long |
12/26/11 |
9/21/15 |
1365 |
|
|
|
Alexion |
50 |
34 |
USD |
71.550 |
160.510 |
|
88.960 |
124 |
7,936 |
24 |
|
| |
|
|
|
|
|
|
Kyowa Kirin |
50 |
267 |
JPY |
9.250 |
17.780 |
|
8.530 |
92 |
10,213 |
19 |
|
| 100 |
108 |
22 | |
| L/S | date buy | date sell | days | | instrument | spl | pieces | Curr | prc buy | prc sell | ps short | prc diff | d % | asset | yield | | | short |
9/21/15 |
7/18/16 |
301 |
|
|
|
Biotest |
50 |
260 |
EUR |
19.575 |
13.700 |
27.969 |
8.394 |
43 |
12,396 |
54 |
|
| |
|
|
|
|
|
|
Aspen Pharmacare |
50 |
253 |
EUR |
20.200 |
23.349 |
17.051 |
-3.149 |
-16 |
11,599 |
-19 |
|
| 100 |
14 |
17 | |
| long |
7/18/16 |
10/24/16 |
98 |
|
|
|
Genomma Lab |
50 |
291 |
MXN |
19.890 |
20.350 |
|
0.460 |
2 |
11,733 |
9 |
|
| |
|
|
|
|
|
|
Sumitomo Pharma |
50 |
301 |
JPY |
19.250 |
19.000 |
|
-0.250 |
-1 |
11,658 |
-5 |
|
| 100 |
1 |
2 | |
| short |
10/24/16 |
3/06/17 |
133 |
|
|
|
Bausch Health |
50 |
207 |
CAD |
28.080 |
21.940 |
35.938 |
7.858 |
28 |
13,285 |
97 |
|
| |
|
|
|
|
|
|
Genfit |
50 |
308 |
EUR |
18.930 |
21.520 |
16.340 |
-2.590 |
-14 |
12,487 |
-33 |
|
| 100 |
7 |
21 | |
| long |
3/06/17 |
12/24/18 |
658 |
|
|
|
Incyte |
50 |
46 |
USD |
134.020 |
58.500 |
|
-75.520 |
-56 |
9,013 |
-37 |
|
| |
|
|
|
|
|
|
Ipsen |
50 |
76 |
EUR |
82.790 |
110.150 |
|
27.360 |
33 |
11,092 |
17 |
|
| 100 |
-11 |
-6 | |
| short |
12/24/18 |
6/24/19 |
182 |
|
|
|
DBV Technologies |
50 |
630 |
EUR |
8.800 |
14.820 |
2.780 |
-6.020 |
-68 |
7,300 |
-90 |
|
| |
|
|
|
|
|
|
Aspen Pharmacare |
50 |
723 |
EUR |
7.670 |
6.318 |
9.311 |
1.641 |
21 |
8,486 |
48 |
|
| 100 |
-23 |
-42 | |
| long |
6/24/19 |
8/05/19 |
42 |
|
|
|
IDEXX Labs |
50 |
15 |
USD |
275.010 |
260.070 |
|
-14.940 |
-5 |
8,262 |
-38 |
|
| |
|
|
|
|
|
|
Daiichi Sankyo |
50 |
218 |
JPY |
19.923 |
22.540 |
|
2.617 |
13 |
8,833 |
192 |
|
| 100 |
4 |
42 | |
| short |
8/05/19 |
11/11/19 |
98 |
|
|
|
Eisai |
50 |
80 |
JPY |
54.750 |
74.710 |
34.790 |
-19.960 |
-36 |
7,236 |
-82 |
|
| |
|
|
|
|
|
|
Hanmi Science |
50 |
107 |
KRW |
41.600 |
41.200 |
42.004 |
0.404 |
1 |
7,279 |
4 |
|
| 100 |
-18 |
-51 | |
| long |
11/11/19 |
3/16/20 |
126 |
|
|
|
Genomma Lab |
50 |
173 |
MXN |
20.940 |
17.030 |
|
-3.910 |
-19 |
6,603 |
-45 |
|
| |
|
|
|
|
|
|
Jiangsu Hengrui Med |
50 |
41 |
CNY |
88.880 |
82.050 |
|
-6.830 |
-8 |
6,323 |
-21 |
|
| 100 |
-13 |
-34 | |
| L/S | date buy | date sell | days | | instrument | spl | pieces | Curr | prc buy | prc sell | ps short | prc diff | d % | asset | yield | | | short |
3/16/20 |
4/13/20 |
28 |
|
|
|
Canopy Growth |
50 |
21 |
CAD |
144.200 |
200.600 |
87.800 |
-56.400 |
-39 |
5,138 |
-100 |
|
| |
|
|
|
|
|
|
Ipsen |
50 |
80 |
EUR |
40.780 |
54.600 |
26.960 |
-13.820 |
-34 |
4,033 |
-100 |
|
| 100 |
-36 |
-100 | |
| long |
4/13/20 |
1/24/22 |
651 |
|
|
|
Regeneron |
50 |
3 |
USD |
517.020 |
621.480 |
|
104.460 |
20 |
4,346 |
11 |
|
| |
|
|
|
|
|
|
Chugai |
50 |
54 |
JPY |
45.217 |
36.920 |
|
-8.297 |
-18 |
3,898 |
-11 |
|
| 100 |
-3 |
-2 | |
| short |
1/24/22 |
12/12/22 |
322 |
|
|
|
Canopy Growth |
50 |
20 |
CAD |
93.500 |
40.200 |
217.469 |
123.969 |
133 |
6,377 |
160 |
|
| |
|
|
|
|
|
|
DBV Technologies |
50 |
777 |
EUR |
2.610 |
2.620 |
2.600 |
-0.010 |
0 |
6,370 |
0 |
|
| 100 |
63 |
74 | |
| long |
12/12/22 |
1/02/23 |
21 |
|
|
|
Gilead Sciences |
50 |
35 |
USD |
88.540 |
85.850 |
|
-2.690 |
-3 |
6,275 |
-42 |
|
| |
|
|
|
|
|
|
Eisai |
50 |
34 |
JPY |
95.800 |
87.040 |
|
-8.760 |
-9 |
5,978 |
-81 |
|
| 100 |
-6 |
-67 | |
| short |
1/02/23 |
3/27/23 |
84 |
|
|
|
Bausch Health |
50 |
351 |
CAD |
8.500 |
10.170 |
6.830 |
-1.670 |
-20 |
5,391 |
-61 |
|
| |
|
|
|
|
|
|
Canopy Growth |
50 |
95 |
CAD |
31.400 |
25.700 |
38.364 |
6.964 |
22 |
6,053 |
139 |
|
| 100 |
1 |
6 | |
| long |
3/27/23 |
10/23/23 |
210 |
|
|
|
IDEXX Labs |
50 |
6 |
USD |
489.050 |
427.720 |
|
-61.330 |
-13 |
5,685 |
-21 |
|
| |
|
|
|
|
|
|
Daiichi Sankyo |
50 |
66 |
JPY |
46.940 |
42.150 |
|
-4.790 |
-10 |
5,369 |
-17 |
|
| 100 |
-11 |
-19 | |
| short |
10/23/23 |
4/29/24 |
189 |
|
|
|
Moderna |
50 |
34 |
USD |
78.640 |
111.620 |
45.660 |
-32.980 |
-42 |
4,248 |
-65 |
|
| |
|
|
|
|
|
|
Euroapi |
50 |
561 |
EUR |
4.804 |
2.918 |
7.909 |
3.105 |
65 |
5,990 |
162 |
|
| 100 |
12 |
24 | |
| long |
4/29/24 |
7/15/24 |
77 |
|
|
|
UCB |
50 |
24 |
EUR |
123.550 |
143.850 |
|
20.300 |
16 |
6,477 |
106 |
|
| |
|
|
|
|
|
|
Rovi |
50 |
36 |
EUR |
82.700 |
86.000 |
|
3.300 |
4 |
6,596 |
20 |
|
| 100 |
10 |
58 | |
| accum | 7/30/07 |
7/15/24 | 6207 |
days out of 6781 invested (92%) |
-34 |
6,596 |
-2 |
|
Instrument Related Contribution
| instrument | L/S | date buy | date sell | days | prc buy | prc sell | ps short | prc diff | d % | spl | di % | total |
| Canopy Growth | short | 3/16/20 | 4/13/20 | 28 | 144.20 | 200.60 | 87.80 | -56.40 | -39.11 | 50 | -19.56 | |
| | short | 1/24/22 | 12/12/22 | 322 | 93.50 | 40.20 | 217.47 | 123.97 | 132.59 | | 66.29 | |
| | short | 1/02/23 | 3/27/23 | 84 | 31.40 | 25.70 | 38.36 | 6.96 | 22.18 | | 11.09 | 48.61 |
| Alexion | long | 8/11/08 | 10/13/08 | 63 | 23.75 | 19.45 | | -4.31 | -18.13 | | -9.07 | |
| | long | 12/26/11 | 9/21/15 | 1365 | 71.55 | 160.51 | | 88.96 | 124.33 | | 62.17 | 47.46 |
| Kyowa Kirin | long | 12/26/11 | 9/21/15 | 1365 | 9.25 | 17.78 | | 8.53 | 92.22 | | 46.11 | 46.11 |
| Euroapi | short | 10/23/23 | 4/29/24 | 189 | 4.80 | 2.92 | 7.91 | 3.11 | 64.63 | | 32.32 | 32.32 |
| Aspen Pharmacare | long | 8/24/09 | 7/19/10 | 329 | 5.45 | 8.38 | | 2.93 | 53.76 | | 26.88 | |
| | short | 9/21/15 | 7/18/16 | 301 | 20.20 | 23.35 | 17.05 | -3.15 | -15.59 | | -7.79 | |
| | short | 12/24/18 | 6/24/19 | 182 | 7.67 | 6.32 | 9.31 | 1.64 | 21.40 | | 10.70 | 29.51 |
| Regeneron | long | 4/13/20 | 1/24/22 | 651 | 517.02 | 621.48 | | 104.46 | 20.20 | | 10.10 | 10.10 |
| UCB | long | 4/29/24 | 7/15/24 | 77 | 123.55 | 143.85 | | 20.30 | 16.43 | | 8.22 | 8.22 |
| Genfit | short | 10/13/08 | 8/24/09 | 315 | 4.84 | 5.95 | 3.73 | -1.11 | -22.91 | | -11.46 | |
| | short | 8/08/11 | 12/26/11 | 140 | 2.53 | 1.59 | 4.03 | 1.50 | 59.37 | | 29.69 | |
| | short | 10/24/16 | 3/06/17 | 133 | 18.93 | 21.52 | 16.34 | -2.59 | -13.68 | | -6.84 | 6.97 |
| Kangmei Pharma | long | 8/24/09 | 7/19/10 | 329 | 4.00 | 5.28 | | 1.28 | 31.99 | | 15.99 | |
| | long | 11/08/10 | 8/08/11 | 273 | 9.09 | 7.50 | | -1.59 | -17.48 | | -8.74 | 5.86 |
| Bausch Health | short | 10/24/16 | 3/06/17 | 133 | 28.08 | 21.94 | 35.94 | 7.86 | 27.99 | | 13.99 | |
| | short | 1/02/23 | 3/27/23 | 84 | 8.50 | 10.17 | 6.83 | -1.67 | -19.65 | | -9.82 | 2.79 |
| Rovi | long | 4/29/24 | 7/15/24 | 77 | 82.70 | 86.00 | | 3.30 | 3.99 | | 2.00 | 2.00 |
| Daiichi Sankyo | long | 6/24/19 | 8/05/19 | 42 | 19.92 | 22.54 | | 2.62 | 13.13 | | 6.57 | |
| | long | 3/27/23 | 10/23/23 | 210 | 46.94 | 42.15 | | -4.79 | -10.20 | | -5.10 | 1.13 |
| Hanmi Science | short | 8/05/19 | 11/11/19 | 98 | 41.60 | 41.20 | 42.00 | 0.40 | 0.97 | | 0.49 | 0.49 |
| Chugai | short | 7/30/07 | 8/11/08 | 378 | 6.79 | 5.67 | 8.13 | 1.34 | 19.76 | | 9.88 | |
| | long | 4/13/20 | 1/24/22 | 651 | 45.22 | 36.92 | | -8.30 | -18.35 | | -9.17 | -0.20 |
| instrument | L/S | date buy | date sell | days | prc buy | prc sell | ps short | prc diff | d % | spl | di % | total |
| Sumitomo Pharma | long | 7/18/16 | 10/24/16 | 98 | 19.25 | 19.00 | | -0.25 | -1.30 | | -0.65 | -0.65 |
| Gilead Sciences | long | 12/12/22 | 1/02/23 | 21 | 88.54 | 85.85 | | -2.69 | -3.04 | | -1.52 | -1.52 |
| Jiangsu Hengrui Med | long | 11/11/19 | 3/16/20 | 126 | 88.88 | 82.05 | | -6.83 | -7.68 | | -3.84 | -3.84 |
| Virbac | long | 11/08/10 | 8/08/11 | 273 | 119.94 | 106.45 | | -13.49 | -11.25 | | -5.62 | -5.62 |
| Genomma Lab | long | 7/18/16 | 10/24/16 | 98 | 19.89 | 20.35 | | 0.46 | 2.31 | | 1.16 | |
| | long | 11/11/19 | 3/16/20 | 126 | 20.94 | 17.03 | | -3.91 | -18.67 | | -9.34 | -8.29 |
| IDEXX Labs | long | 6/24/19 | 8/05/19 | 42 | 275.01 | 260.07 | | -14.94 | -5.43 | | -2.72 | |
| | long | 3/27/23 | 10/23/23 | 210 | 489.05 | 427.72 | | -61.33 | -12.54 | | -6.27 | -8.82 |
| Ipsen | short | 7/19/10 | 11/08/10 | 112 | 26.44 | 24.33 | 28.72 | 2.29 | 8.65 | | 4.33 | |
| | short | 8/08/11 | 12/26/11 | 140 | 19.23 | 23.85 | 14.62 | -4.62 | -24.00 | | -12.00 | |
| | long | 3/06/17 | 12/24/18 | 658 | 82.79 | 110.15 | | 27.36 | 33.05 | | 16.52 | |
| | short | 3/16/20 | 4/13/20 | 28 | 40.78 | 54.60 | 26.96 | -13.82 | -33.89 | | -16.94 | -11.15 |
| Cipla | short | 7/30/07 | 8/11/08 | 378 | 18.72 | 23.24 | 14.20 | -4.52 | -24.15 | | -12.08 | -12.08 |
| Biotest | long | 8/11/08 | 10/13/08 | 63 | 19.80 | 13.76 | | -6.04 | -30.49 | | -15.24 | |
| | short | 7/19/10 | 11/08/10 | 112 | 9.33 | 13.33 | 5.33 | -4.00 | -42.86 | | -21.43 | |
| | short | 9/21/15 | 7/18/16 | 301 | 19.58 | 13.70 | 27.97 | 8.39 | 42.88 | | 21.44 | -19.13 |
| Moderna | short | 10/23/23 | 4/29/24 | 189 | 78.64 | 111.62 | 45.66 | -32.98 | -41.94 | | -20.97 | -20.97 |
| Eisai | short | 8/05/19 | 11/11/19 | 98 | 54.75 | 74.71 | 34.79 | -19.96 | -36.46 | | -18.23 | |
| | long | 12/12/22 | 1/02/23 | 21 | 95.80 | 87.04 | | -8.76 | -9.14 | | -4.57 | -21.97 |
| Incyte | long | 3/06/17 | 12/24/18 | 658 | 134.02 | 58.50 | | -75.52 | -56.35 | | -28.17 | -28.17 |
| Innate Pharma | short | 10/13/08 | 8/24/09 | 315 | 1.32 | 2.19 | 0.45 | -0.87 | -65.91 | | -32.95 | -32.95 |
| DBV Technologies | short | 12/24/18 | 6/24/19 | 182 | 8.80 | 14.82 | 2.78 | -6.02 | -68.41 | | -34.20 | |
| | short | 1/24/22 | 12/12/22 | 322 | 2.61 | 2.62 | 2.60 | -0.01 | -0.38 | | -0.19 | -34.33 |
Annotations
| 7/18/22 | GlaxoSmithKline | | | demergers OTC business -> Haleon |
| 6/27/22 | Lundbeck | | | splits into one A and four B shares (1:(1+4)) |
| 7/06/15 | Pharma | | | Best Long throws a signal for Kangmei. Due to the high volatility in China this should be handled with care. |
| 3/14/15 | Pharma | | | complete analysis |
|
|