| | |
| | |

Assessment - Dow Jones Utility Average - 7/01/24 - RS = 39
⇐
| |
|
⇓instrument |
freshest |
⇓ Δday |
7/01/24 |
⇓ Δwk |
10/02/23 |
prc diff |
⇓ Δ39 |
|
∅-RS |
| |  |
 |
 |
|
L |
 |
DJUA |
1,000.910 |
8/12/24 |
0.36 |
898.820 |
11.36 |
783.080 |
115.740 |
14.78 |
|
3.90 |
| | |
|
|
|
L |
|
PSEG |
80.510 |
8/12/24 |
0.81 |
73.630 |
9.34 |
54.690 |
18.940 |
34.63 |
|
15.99 |
| | |
|
|
|
L |
|
NextEra Energy |
77.580 |
8/12/24 |
0.15 |
69.900 |
10.99 |
52.150 |
17.750 |
34.04 |
|
14.55 |
| | |
|
|
|
L |
|
Southern |
87.200 |
8/12/24 |
0.46 |
77.000 |
13.25 |
62.710 |
14.290 |
22.79 |
|
10.63 |
| | |
|
|
|
L |
|
AEP |
97.140 |
8/12/24 |
-0.40 |
87.280 |
11.30 |
71.840 |
15.440 |
21.49 |
|
7.82 |
| | |
|
|
|
L |
|
Duke Energy |
113.370 |
8/12/24 |
0.62 |
99.350 |
14.11 |
85.440 |
13.910 |
16.28 |
|
7.65 |
| | |
|
|
|
L |
|
AES |
16.710 |
8/12/24 |
0.30 |
17.440 |
-4.19 |
14.160 |
3.280 |
23.16 |
|
7.05 |
| | |
|
|
|
|
|
Edison International |
82.410 |
8/12/24 |
0.52 |
71.190 |
15.76 |
61.040 |
10.150 |
16.63 |
|
4.14 |
| | |
|
|
|
L |
|
Sempra |
78.990 |
8/12/24 |
0.74 |
74.970 |
5.36 |
65.270 |
9.700 |
14.86 |
|
3.72 |
| | |
|
|
|
|
|
Dominion Resources |
54.720 |
8/12/24 |
0.46 |
48.010 |
13.98 |
42.310 |
5.700 |
13.47 |
|
3.21 |
| | |
|
|
|
|
|
FirstEnergy |
42.200 |
8/12/24 |
0.55 |
38.310 |
10.15 |
32.600 |
5.710 |
17.52 |
|
2.36 |
| | |
|
|
|
|
|
Atmos Energy |
128.640 |
8/12/24 |
0.46 |
115.980 |
10.92 |
102.760 |
13.220 |
12.86 |
|
1.36 |
| | |
|
|
|
|
|
Consolidated Edison |
101.940 |
8/12/24 |
0.91 |
88.810 |
14.78 |
81.620 |
7.190 |
8.81 |
|
-0.07 |
| | |
|
|
|
L |
|
American Water |
142.560 |
8/12/24 |
0.20 |
127.760 |
11.58 |
119.750 |
8.010 |
6.69 |
|
-0.28 |
| | |
|
|
|
|
|
Exelon |
36.900 |
8/12/24 |
-0.54 |
34.550 |
6.80 |
36.610 |
-2.060 |
-5.63 |
|
-7.81 |
| | |
|
|
|
L |
|
Xcel Energy |
58.020 |
8/12/24 |
0.10 |
52.430 |
10.66 |
55.030 |
-2.600 |
-4.72 |
|
-8.41 |
| DJUA - 15 out of 15 instruments rated - 7/01/24 / 10/02/23 - 13 did rise, Market-Ratio(39) = 86.67 % |
| Stock Exchange Currency: USD $ Dollar |
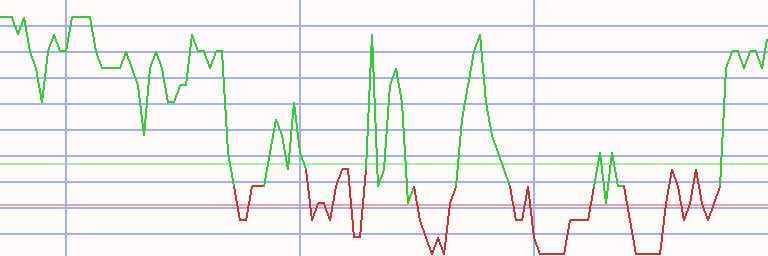
Technical Chart
Transactions Dow Jones Utility Average * A39 - 36/20 (2)
|
⇐ |
| |
| L/S | date buy | date sell | days | | instrument | spl | pieces | | prc buy | prc sell | ps short | prc diff | d % | asset | yield | |
| 1/02/06 |
4/10/06 |
98 |
|
- cash - |
| short |
4/10/06 |
4/17/06 |
7 |
|
|
|
NextEra Energy |
50 |
499 |
|
10.005 |
9.643 |
10.381 |
0.376 |
4 |
10,188 |
585 |
|
| |
|
|
|
|
|
|
NiSource |
50 |
630 |
|
7.941 |
7.906 |
7.977 |
0.036 |
0 |
10,210 |
26 |
|
| 100 |
2 |
196 | |
| long |
4/17/06 |
1/21/08 |
644 |
|
|
|
FirstEnergy |
50 |
105 |
|
48.450 |
68.660 |
|
20.210 |
42 |
12,332 |
22 |
|
| |
|
|
|
|
|
|
Exelon |
50 |
99 |
|
51.670 |
73.130 |
|
21.460 |
42 |
14,457 |
22 |
|
| 100 |
42 |
22 | |
| short |
1/21/08 |
3/17/08 |
56 |
|
|
|
AES |
50 |
408 |
|
17.690 |
16.070 |
19.473 |
1.783 |
10 |
15,184 |
87 |
|
| |
|
|
|
|
|
|
NiSource |
50 |
1,052 |
|
6.880 |
6.766 |
6.996 |
0.116 |
2 |
15,306 |
12 |
|
| 100 |
6 |
45 | |
| long |
3/17/08 |
7/28/08 |
133 |
|
|
|
FirstEnergy |
50 |
112 |
|
68.190 |
72.350 |
|
4.160 |
6 |
15,772 |
18 |
|
| |
|
|
|
|
|
|
Exelon |
50 |
96 |
|
79.390 |
79.450 |
|
0.060 |
0 |
15,778 |
0 |
|
| 100 |
3 |
9 | |
| short |
7/28/08 |
7/06/09 |
343 |
|
|
|
AES |
50 |
480 |
|
16.420 |
11.120 |
24.246 |
7.826 |
48 |
19,534 |
51 |
|
| |
|
|
|
|
|
|
Edison International |
50 |
165 |
|
47.850 |
31.400 |
72.918 |
25.068 |
52 |
23,671 |
57 |
|
| 100 |
50 |
54 | |
| long |
7/06/09 |
8/31/15 |
2247 |
|
|
|
NextEra Energy |
50 |
849 |
|
13.928 |
24.603 |
|
10.675 |
77 |
32,734 |
10 |
|
| |
|
|
|
|
|
|
PG & E |
50 |
307 |
|
38.470 |
49.580 |
|
11.110 |
29 |
36,144 |
4 |
|
| 100 |
53 |
7 | |
| short |
8/31/15 |
12/07/15 |
98 |
|
|
|
CenterPoint Energy |
50 |
970 |
|
18.620 |
16.410 |
21.128 |
2.508 |
13 |
38,577 |
60 |
|
| |
|
|
|
|
|
|
FirstEnergy |
50 |
565 |
|
31.960 |
32.480 |
31.440 |
-0.520 |
-2 |
38,283 |
-6 |
|
| 100 |
6 |
24 | |
| long |
12/07/15 |
3/16/20 |
1561 |
|
|
|
NiSource |
50 |
1,000 |
|
19.140 |
20.940 |
|
1.800 |
9 |
40,083 |
2 |
|
| |
|
|
|
|
|
|
American Water |
50 |
327 |
|
58.400 |
118.810 |
|
60.410 |
103 |
59,837 |
18 |
|
| 100 |
56 |
11 | |
| L/S | date buy | date sell | days | | instrument | spl | pieces | | prc buy | prc sell | ps short | prc diff | d % | asset | yield | | | short |
3/16/20 |
12/07/20 |
266 |
|
|
|
AES |
50 |
2,722 |
|
10.990 |
20.870 |
1.110 |
-9.880 |
-90 |
32,944 |
-96 |
|
| |
|
|
|
|
|
|
CenterPoint Energy |
50 |
2,397 |
|
12.480 |
23.140 |
1.820 |
-10.660 |
-85 |
7,392 |
-93 |
|
| 100 |
-88 |
-94 | |
| long |
12/07/20 |
10/10/22 |
672 |
|
|
|
AES |
50 |
177 |
|
20.870 |
24.890 |
|
4.020 |
19 |
8,103 |
10 |
|
| |
|
|
|
|
|
|
PG & E |
50 |
295 |
|
12.530 |
14.130 |
|
1.600 |
13 |
8,575 |
7 |
|
| 100 |
16 |
8 | |
| short |
10/10/22 |
11/14/22 |
35 |
|
|
|
American Water |
50 |
33 |
|
127.440 |
144.750 |
110.130 |
-17.310 |
-14 |
8,004 |
-78 |
|
| |
|
|
|
|
|
|
Exelon |
50 |
115 |
|
37.810 |
38.060 |
37.560 |
-0.250 |
-1 |
7,975 |
-7 |
|
| 100 |
-7 |
-53 | |
| long |
11/14/22 |
1/02/23 |
49 |
|
|
|
AES |
50 |
144 |
|
27.530 |
28.760 |
|
1.230 |
4 |
8,152 |
38 |
|
| |
|
|
|
|
|
|
PG & E |
50 |
277 |
|
14.460 |
16.260 |
|
1.800 |
12 |
8,651 |
140 |
|
| 100 |
8 |
83 | |
| short |
1/02/23 |
3/20/23 |
77 |
|
|
|
Dominion Resources |
50 |
70 |
|
61.320 |
55.620 |
67.604 |
6.284 |
10 |
9,091 |
59 |
|
| |
|
|
|
|
|
|
NiSource |
50 |
158 |
|
27.420 |
27.820 |
27.020 |
-0.400 |
-1 |
9,028 |
-7 |
|
| 100 |
4 |
22 | |
| long |
3/20/23 |
5/15/23 |
56 |
|
|
|
Consolidated Edison |
50 |
46 |
|
96.910 |
98.480 |
|
1.570 |
2 |
9,100 |
11 |
|
| |
|
|
|
|
|
|
Edison International |
50 |
66 |
|
69.000 |
72.240 |
|
3.240 |
5 |
9,314 |
35 |
|
| 100 |
3 |
23 | |
| short |
5/15/23 |
7/03/23 |
49 |
|
|
|
AES |
50 |
211 |
|
21.990 |
21.070 |
22.950 |
0.960 |
4 |
9,516 |
37 |
|
| |
|
|
|
|
|
|
Dominion Resources |
50 |
85 |
|
54.770 |
52.610 |
57.019 |
2.249 |
4 |
9,707 |
35 |
|
| 100 |
4 |
36 | |
| long |
7/03/23 |
9/04/23 |
63 |
|
|
|
Edison International |
50 |
70 |
|
69.090 |
68.410 |
|
-0.680 |
-1 |
9,660 |
-6 |
|
| |
|
|
|
|
|
|
Atmos Energy |
50 |
41 |
|
117.300 |
115.470 |
|
-1.830 |
-2 |
9,585 |
-9 |
|
| 100 |
-1 |
-7 | |
| L/S | date buy | date sell | days | | instrument | spl | pieces | | prc buy | prc sell | ps short | prc diff | d % | asset | yield | | | short |
9/04/23 |
12/11/23 |
98 |
|
|
|
AES |
50 |
267 |
|
17.890 |
18.050 |
17.730 |
-0.160 |
-1 |
9,542 |
-3 |
|
| |
|
|
|
|
|
|
Dominion Resources |
50 |
100 |
|
47.880 |
47.650 |
48.111 |
0.231 |
0 |
9,565 |
2 |
|
| 100 |
0 |
-1 | |
| long |
12/11/23 |
1/15/24 |
35 |
|
|
|
PSEG |
50 |
75 |
|
62.980 |
60.320 |
|
-2.660 |
-4 |
9,366 |
-36 |
|
| |
|
|
|
|
|
|
Southern |
50 |
67 |
|
71.360 |
71.420 |
|
0.060 |
0 |
9,370 |
1 |
|
| 100 |
-2 |
-19 | |
| short |
1/15/24 |
5/06/24 |
112 |
|
|
|
NextEra Energy |
50 |
76 |
|
61.040 |
71.250 |
50.830 |
-10.210 |
-17 |
8,594 |
-45 |
|
| |
|
|
|
|
|
|
Exelon |
50 |
131 |
|
36.070 |
37.550 |
34.590 |
-1.480 |
-4 |
8,400 |
-13 |
|
| 100 |
-10 |
-30 | |
| long |
5/06/24 |
8/12/24 |
98 |
|
|
|
NextEra Energy |
50 |
58 |
|
71.250 |
77.580 |
|
6.330 |
9 |
8,767 |
37 |
|
| |
|
|
|
|
|
|
PSEG |
50 |
59 |
|
71.340 |
80.510 |
|
9.170 |
13 |
9,308 |
57 |
|
| 100 |
11 |
47 | |
| accum | 4/10/06 |
8/12/24 | 7383 |
days out of 7481 invested (99%) |
-7 |
9,308 |
0 |
|
Instrument Related Contribution
| instrument | L/S | date buy | date sell | days | prc buy | prc sell | ps short | prc diff | d % | spl | di % | total |
| American Water | long | 12/07/15 | 3/16/20 | 1561 | 58.40 | 118.81 | | 60.41 | 103.44 | 50 | 51.72 | |
| | short | 10/10/22 | 11/14/22 | 35 | 127.44 | 144.75 | 110.13 | -17.31 | -13.58 | | -6.79 | 41.42 |
| NextEra Energy | short | 4/10/06 | 4/17/06 | 7 | 10.01 | 9.64 | 10.38 | 0.38 | 3.76 | | 1.88 | |
| | long | 7/06/09 | 8/31/15 | 2247 | 13.93 | 24.60 | | 10.68 | 76.65 | | 38.32 | |
| | short | 1/15/24 | 5/06/24 | 112 | 61.04 | 71.25 | 50.83 | -10.21 | -16.73 | | -8.36 | |
| | long | 5/06/24 | 8/12/24 | 98 | 71.25 | 77.58 | | 6.33 | 8.88 | | 4.44 | 34.87 |
| PG & E | long | 7/06/09 | 8/31/15 | 2247 | 38.47 | 49.58 | | 11.11 | 28.88 | | 14.44 | |
| | long | 12/07/20 | 10/10/22 | 672 | 12.53 | 14.13 | | 1.60 | 12.77 | | 6.38 | |
| | long | 11/14/22 | 1/02/23 | 49 | 14.46 | 16.26 | | 1.80 | 12.45 | | 6.22 | 29.32 |
| Edison International | short | 7/28/08 | 7/06/09 | 343 | 47.85 | 31.40 | 72.92 | 25.07 | 52.39 | | 26.19 | |
| | long | 3/20/23 | 5/15/23 | 56 | 69.00 | 72.24 | | 3.24 | 4.70 | | 2.35 | |
| | long | 7/03/23 | 9/04/23 | 63 | 69.09 | 68.41 | | -0.68 | -0.98 | | -0.49 | 28.52 |
| FirstEnergy | long | 4/17/06 | 1/21/08 | 644 | 48.45 | 68.66 | | 20.21 | 41.71 | | 20.86 | |
| | long | 3/17/08 | 7/28/08 | 133 | 68.19 | 72.35 | | 4.16 | 6.10 | | 3.05 | |
| | short | 8/31/15 | 12/07/15 | 98 | 31.96 | 32.48 | 31.44 | -0.52 | -1.63 | | -0.81 | 23.53 |
| Exelon | long | 4/17/06 | 1/21/08 | 644 | 51.67 | 73.13 | | 21.46 | 41.53 | | 20.77 | |
| | long | 3/17/08 | 7/28/08 | 133 | 79.39 | 79.45 | | 0.06 | 0.08 | | 0.04 | |
| | short | 10/10/22 | 11/14/22 | 35 | 37.81 | 38.06 | 37.56 | -0.25 | -0.66 | | -0.33 | |
| | short | 1/15/24 | 5/06/24 | 112 | 36.07 | 37.55 | 34.59 | -1.48 | -4.10 | | -2.05 | 17.94 |
| Dominion Resources | short | 1/02/23 | 3/20/23 | 77 | 61.32 | 55.62 | 67.60 | 6.28 | 10.25 | | 5.12 | |
| | short | 5/15/23 | 7/03/23 | 49 | 54.77 | 52.61 | 57.02 | 2.25 | 4.11 | | 2.05 | |
| | short | 9/04/23 | 12/11/23 | 98 | 47.88 | 47.65 | 48.11 | 0.23 | 0.48 | | 0.24 | 7.54 |
| NiSource | short | 4/10/06 | 4/17/06 | 7 | 7.94 | 7.91 | 7.98 | 0.04 | 0.45 | | 0.22 | |
| | short | 1/21/08 | 3/17/08 | 56 | 6.88 | 6.77 | 7.00 | 0.12 | 1.68 | | 0.84 | |
| | long | 12/07/15 | 3/16/20 | 1561 | 19.14 | 20.94 | | 1.80 | 9.40 | | 4.70 | |
| | short | 1/02/23 | 3/20/23 | 77 | 27.42 | 27.82 | 27.02 | -0.40 | -1.46 | | -0.73 | 5.05 |
| instrument | L/S | date buy | date sell | days | prc buy | prc sell | ps short | prc diff | d % | spl | di % | total |
| PSEG | long | 12/11/23 | 1/15/24 | 35 | 62.98 | 60.32 | | -2.66 | -4.22 | | -2.11 | |
| | long | 5/06/24 | 8/12/24 | 98 | 71.34 | 80.51 | | 9.17 | 12.85 | | 6.43 | 4.18 |
| Consolidated Edison | long | 3/20/23 | 5/15/23 | 56 | 96.91 | 98.48 | | 1.57 | 1.62 | | 0.81 | 0.81 |
| Southern | long | 12/11/23 | 1/15/24 | 35 | 71.36 | 71.42 | | 0.06 | 0.08 | | 0.04 | 0.04 |
| Atmos Energy | long | 7/03/23 | 9/04/23 | 63 | 117.30 | 115.47 | | -1.83 | -1.56 | | -0.78 | -0.78 |
| AES | short | 1/21/08 | 3/17/08 | 56 | 17.69 | 16.07 | 19.47 | 1.78 | 10.08 | | 5.04 | |
| | short | 7/28/08 | 7/06/09 | 343 | 16.42 | 11.12 | 24.25 | 7.83 | 47.66 | | 23.83 | |
| | short | 3/16/20 | 12/07/20 | 266 | 10.99 | 20.87 | 1.11 | -9.88 | -89.90 | | -44.95 | |
| | long | 12/07/20 | 10/10/22 | 672 | 20.87 | 24.89 | | 4.02 | 19.26 | | 9.63 | |
| | long | 11/14/22 | 1/02/23 | 49 | 27.53 | 28.76 | | 1.23 | 4.47 | | 2.23 | |
| | short | 5/15/23 | 7/03/23 | 49 | 21.99 | 21.07 | 22.95 | 0.96 | 4.37 | | 2.18 | |
| | short | 9/04/23 | 12/11/23 | 98 | 17.89 | 18.05 | 17.73 | -0.16 | -0.89 | | -0.45 | -18.36 |
| CenterPoint Energy | short | 8/31/15 | 12/07/15 | 98 | 18.62 | 16.41 | 21.13 | 2.51 | 13.47 | | 6.73 | |
| | short | 3/16/20 | 12/07/20 | 266 | 12.48 | 23.14 | 1.82 | -10.66 | -85.42 | | -42.71 | -38.85 |
Annotations
| 8/22/23 | Sempra | | | stock split 1:2 (two for one) |
|
|