| | Wed, Jun 24th, 2026, 23:36UTC |
| | |

Assessment - OMX Copenhagen 20 in Japanese yen - 7/01/24 - RS = 17
⇐
| |
|
⇓instrument |
freshest |
⇓ Δday |
7/01/24 |
⇓ Δwk |
3/04/24 |
prc diff |
⇓ Δ17 |
|
∅-RS |
| |  |
 |
 |
|
|
 |
OMXC 20 |
62,055.272 |
8/12/24 |
-2.06 |
67,295.818 |
-7.79 |
58,178.005 |
9,117.813 |
15.67 |
|
34.08 |
| | |
|
|
|
L |
|
Rockwool |
63,769.662 |
8/12/24 |
-0.22 |
65,628.836 |
-2.83 |
48,262.033 |
17,366.804 |
35.98 |
|
57.85 |
| | |
|
|
|
|
|
Novo Nordisk |
20,750.704 |
8/12/24 |
-2.80 |
23,346.575 |
-11.12 |
19,234.646 |
4,111.930 |
21.38 |
|
51.02 |
| | |
|
|
|
L |
|
Ambu |
3,200.103 |
8/12/24 |
-0.40 |
3,173.377 |
0.84 |
2,670.748 |
502.630 |
18.82 |
|
49.01 |
| | |
|
|
|
L |
|
GN Store Nord |
29,808.976 |
8/12/24 |
-0.98 |
33,327.128 |
-10.56 |
25,412.277 |
7,914.852 |
31.15 |
|
29.58 |
| | |
|
|
|
|
|
Pandora |
24,192.500 |
8/12/24 |
1.56 |
23,448.830 |
3.17 |
24,942.327 |
-1,493.497 |
-5.99 |
|
23.93 |
| | |
|
|
|
|
|
Novonesis |
9,974.468 |
8/12/24 |
0.12 |
9,816.438 |
1.61 |
8,740.230 |
1,076.208 |
12.31 |
|
30.20 |
| | |
|
|
|
|
|
Danske Bank |
4,611.913 |
8/12/24 |
0.15 |
4,859.416 |
-5.09 |
4,521.413 |
338.002 |
7.48 |
|
25.38 |
| | |
|
|
|
|
|
Jyske Bank |
12,061.390 |
8/12/24 |
0.48 |
12,828.299 |
-5.98 |
12,384.551 |
443.749 |
3.58 |
|
14.49 |
| | |
|
|
|
|
|
Demant |
6,033.019 |
8/12/24 |
-1.44 |
7,013.733 |
-13.98 |
7,849.981 |
-836.247 |
-10.65 |
|
8.06 |
| | |
|
|
|
|
|
Tryg |
3,453.415 |
8/12/24 |
0.61 |
3,557.994 |
-2.94 |
3,210.160 |
347.834 |
10.84 |
|
17.28 |
| | |
|
|
|
|
|
Coloplast |
20,553.167 |
8/12/24 |
0.25 |
19,344.704 |
6.25 |
20,423.106 |
-1,078.403 |
-5.28 |
|
10.25 |
| | |
|
|
|
|
|
ISS |
2,921.227 |
8/12/24 |
0.48 |
2,809.676 |
3.97 |
2,724.470 |
85.207 |
3.13 |
|
5.34 |
| | |
|
|
|
L |
|
Møller-Mærsk B |
250,291.277 |
8/12/24 |
1.99 |
298,862.194 |
-16.25 |
209,888.312 |
88,973.881 |
42.39 |
|
21.21 |
| | |
|
|
|
L |
|
Møller-Mærsk A |
245,875.739 |
8/12/24 |
1.93 |
290,960.705 |
-15.50 |
204,033.718 |
86,926.987 |
42.60 |
|
20.16 |
| | |
|
|
|
L |
|
Carlsberg B |
18,628.922 |
8/12/24 |
|
19,614.284 |
-5.02 |
20,580.983 |
-966.699 |
-4.70 |
|
-1.78 |
| | |
|
|
|
|
|
Vestas Wind Systems |
3,538.240 |
8/12/24 |
-7.76 |
3,767.151 |
-6.08 |
4,278.459 |
-511.308 |
-11.95 |
|
-1.45 |
| | |
|
|
|
L |
|
Ørsted |
9,702.563 |
8/12/24 |
0.63 |
8,738.117 |
11.04 |
8,080.218 |
657.899 |
8.14 |
|
2.01 |
| | |
|
|
|
L |
|
DSV |
28,247.822 |
8/12/24 |
|
26,574.566 |
6.30 |
23,922.707 |
2,651.859 |
11.09 |
|
4.96 |
| | |
|
|
|
|
|
Genmab |
42,319.444 |
8/12/24 |
0.89 |
40,309.213 |
4.99 |
42,845.984 |
-2,536.772 |
-5.92 |
|
-14.67 |
| OMXC 20 - 19 out of 19 instruments rated - 7/01/24 / 3/04/24 - 13 did rise, Market-Ratio(17) in JPY = 68.42 % |
| Stock Exchange Currency: DKK kr Danish krone |
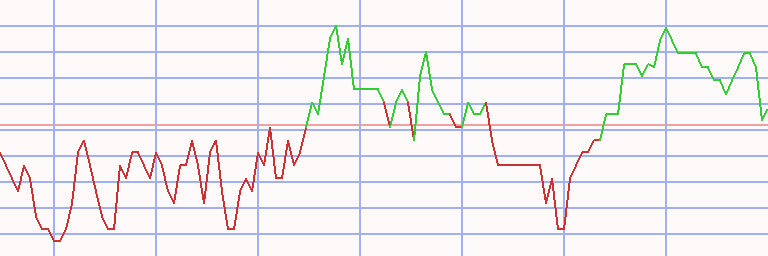
Technical Chart
Transactions OMX Copenhagen 20 in Japanese yen * S17 - 51 ex 3 (1)
|
⇐ |
| |
| L/S | date buy | date sell | days | | instrument | spl | pieces | | prc buy | prc sell | ps short | prc diff | d % | asset | yield | |
| 1/02/06 |
7/10/06 |
189 |
|
- cash - |
| short |
7/10/06 |
9/18/06 |
70 |
|
|
|
Møller-Mærsk B |
100 |
5 |
|
1,693.630 |
1,891.103 |
1,496.156 |
-197.473 |
-12 |
9,013 |
-48 |
|
| 9/18/06 |
8/20/07 |
336 |
|
- cash - |
| |
8/20/07 |
8/27/07 |
7 |
|
|
|
GN Store Nord |
100 |
1 |
|
8,204.760 |
8,281.000 |
8,128.520 |
-76.240 |
-1 |
8,936 |
-39 |
|
| 8/27/07 |
9/10/07 |
14 |
|
- cash - |
| |
9/10/07 |
9/24/07 |
14 |
|
|
|
GN Store Nord |
100 |
1 |
|
8,428.860 |
8,747.275 |
8,110.445 |
-318.415 |
-4 |
8,618 |
-63 |
|
| 9/24/07 |
10/29/07 |
35 |
|
- cash - |
| |
10/29/07 |
5/05/08 |
189 |
|
|
|
GN Store Nord |
100 |
0 |
|
9,039.250 |
4,388.580 |
18,618.332 |
9,579.082 |
106 |
8,618 |
0 |
|
| 5/05/08 |
6/16/08 |
42 |
|
- cash - |
| |
6/16/08 |
10/20/08 |
126 |
|
|
|
Rockwool |
100 |
0 |
|
16,447.284 |
7,446.321 |
36,328.429 |
19,881.145 |
121 |
8,618 |
0 |
|
| |
10/20/08 |
12/15/08 |
56 |
|
|
|
Carlsberg B |
100 |
2 |
|
4,281.177 |
3,209.583 |
5,710.548 |
1,429.371 |
33 |
11,477 |
554 |
|
| |
12/15/08 |
4/13/09 |
119 |
|
|
|
Danske Bank |
100 |
12 |
|
901.631 |
870.128 |
934.274 |
32.643 |
4 |
11,868 |
12 |
|
| 4/13/09 |
6/28/10 |
441 |
|
- cash - |
| |
6/28/10 |
7/12/10 |
14 |
|
|
|
Genmab |
100 |
17 |
|
680.249 |
888.682 |
471.817 |
-208.433 |
-31 |
8,325 |
-100 |
|
| 7/12/10 |
8/23/10 |
42 |
|
- cash - |
| |
8/23/10 |
9/06/10 |
14 |
|
|
|
Genmab |
100 |
10 |
|
826.783 |
832.279 |
821.286 |
-5.496 |
-1 |
8,270 |
-16 |
|
| 9/06/10 |
10/04/10 |
28 |
|
- cash - |
| |
10/04/10 |
10/25/10 |
21 |
|
|
|
Vestas Wind Systems |
100 |
13 |
|
631.168 |
609.019 |
654.123 |
22.955 |
4 |
8,569 |
86 |
|
| 10/25/10 |
4/25/11 |
182 |
|
- cash - |
| |
4/25/11 |
5/16/11 |
21 |
|
|
|
Vestas Wind Systems |
100 |
14 |
|
573.375 |
477.219 |
688.907 |
115.531 |
20 |
10,186 |
2,330 |
|
| 5/16/11 |
5/23/11 |
7 |
|
- cash - |
| |
5/23/11 |
11/28/11 |
189 |
|
|
|
Vestas Wind Systems |
100 |
20 |
|
495.193 |
203.768 |
1,203.407 |
708.214 |
143 |
24,350 |
456 |
|
| 11/28/11 |
5/21/12 |
175 |
|
- cash - |
| |
5/21/12 |
8/06/12 |
77 |
|
|
|
Vestas Wind Systems |
100 |
235 |
|
103.499 |
73.417 |
145.907 |
42.408 |
41 |
34,316 |
409 |
|
| 8/06/12 |
6/24/13 |
322 |
|
- cash - |
| |
6/24/13 |
7/01/13 |
7 |
|
|
|
Novo Nordisk |
100 |
22 |
|
1,501.792 |
1,576.195 |
1,427.388 |
-74.404 |
-5 |
32,679 |
-93 |
|
| 7/01/13 |
9/08/14 |
434 |
|
- cash - |
| |
9/08/14 |
9/15/14 |
7 |
|
|
|
Rockwool |
100 |
2 |
|
16,039.361 |
16,087.633 |
15,991.090 |
-48.272 |
0 |
32,583 |
-15 |
|
| 9/15/14 |
9/29/14 |
14 |
|
- cash - |
| |
9/29/14 |
12/22/14 |
84 |
|
|
|
Rockwool |
100 |
2 |
|
15,888.444 |
13,928.943 |
18,123.604 |
2,235.160 |
14 |
37,053 |
77 |
|
| 12/22/14 |
1/19/15 |
28 |
|
- cash - |
| |
1/19/15 |
1/26/15 |
7 |
|
|
|
Rockwool |
100 |
2 |
|
12,407.310 |
12,586.139 |
12,228.480 |
-178.829 |
-1 |
36,695 |
-53 |
|
| 1/26/15 |
8/10/15 |
196 |
|
- cash - |
| |
8/10/15 |
10/19/15 |
70 |
|
|
|
Møller-Mærsk B |
100 |
16 |
|
2,195.280 |
1,936.236 |
2,488.981 |
293.701 |
13 |
41,395 |
92 |
|
| 10/19/15 |
11/02/15 |
14 |
|
- cash - |
| |
11/02/15 |
12/07/15 |
35 |
|
|
|
Møller-Mærsk B |
100 |
23 |
|
1,778.857 |
1,781.763 |
1,775.951 |
-2.906 |
0 |
41,328 |
-2 |
|
| 12/07/15 |
12/14/15 |
7 |
|
- cash - |
| |
12/14/15 |
12/21/15 |
7 |
|
|
|
Møller-Mærsk B |
100 |
25 |
|
1,632.293 |
1,569.904 |
1,697.162 |
64.869 |
4 |
42,949 |
663 |
|
| 12/21/15 |
1/18/16 |
28 |
|
- cash - |
| |
1/18/16 |
1/25/16 |
7 |
|
|
|
Møller-Mærsk B |
100 |
32 |
|
1,330.654 |
1,423.200 |
1,238.108 |
-92.546 |
-7 |
39,988 |
-98 |
|
| 1/25/16 |
2/08/16 |
14 |
|
- cash - |
| |
2/08/16 |
2/15/16 |
7 |
|
|
|
Møller-Mærsk B |
100 |
26 |
|
1,488.825 |
1,461.790 |
1,516.359 |
27.534 |
2 |
40,704 |
160 |
|
| 2/15/16 |
3/07/16 |
21 |
|
- cash - |
| |
3/07/16 |
3/14/16 |
7 |
|
|
|
Møller-Mærsk A |
100 |
26 |
|
1,558.929 |
1,494.461 |
1,626.178 |
67.249 |
4 |
42,452 |
804 |
|
| 3/14/16 |
3/21/16 |
7 |
|
- cash - |
| |
3/21/16 |
4/18/16 |
28 |
|
|
|
Møller-Mærsk A |
100 |
28 |
|
1,471.937 |
1,423.451 |
1,522.073 |
50.137 |
3 |
43,856 |
55 |
|
| 4/18/16 |
6/20/16 |
63 |
|
- cash - |
| |
6/20/16 |
7/18/16 |
28 |
|
|
|
Møller-Mærsk A |
100 |
35 |
|
1,228.588 |
1,273.578 |
1,183.599 |
-44.990 |
-4 |
42,281 |
-39 |
|
| L/S | date buy | date sell | days | | instrument | spl | pieces | | prc buy | prc sell | ps short | prc diff | d % | asset | yield | |
| 7/18/16 |
11/21/16 |
126 |
|
- cash - |
| |
11/21/16 |
2/06/17 |
77 |
|
|
|
Novo Nordisk |
100 |
23 |
|
1,799.933 |
1,878.338 |
1,721.528 |
-78.405 |
-4 |
40,478 |
-19 |
|
| 2/06/17 |
10/02/17 |
238 |
|
- cash - |
| |
10/02/17 |
10/09/17 |
7 |
|
|
|
Pandora |
100 |
3 |
|
11,098.326 |
11,098.326 |
11,098.326 |
-0.000 |
0 |
40,478 |
0 |
|
| 10/09/17 |
1/29/18 |
112 |
|
- cash - |
| |
1/29/18 |
2/26/18 |
28 |
|
|
|
Vestas Wind Systems |
100 |
27 |
|
1,446.771 |
1,585.111 |
1,308.431 |
-138.340 |
-10 |
36,743 |
-73 |
|
| 2/26/18 |
3/05/18 |
7 |
|
- cash - |
| |
3/05/18 |
3/12/18 |
7 |
|
|
|
Møller-Mærsk B |
100 |
21 |
|
1,681.298 |
1,653.221 |
1,709.851 |
28.553 |
2 |
37,343 |
141 |
|
| 3/12/18 |
3/19/18 |
7 |
|
- cash - |
| |
3/19/18 |
4/02/18 |
14 |
|
|
|
Møller-Mærsk A |
100 |
23 |
|
1,583.578 |
1,572.887 |
1,594.341 |
10.763 |
1 |
37,590 |
19 |
|
| 4/02/18 |
4/16/18 |
14 |
|
- cash - |
| |
4/16/18 |
4/23/18 |
7 |
|
|
|
Møller-Mærsk A |
100 |
24 |
|
1,516.991 |
1,594.031 |
1,439.951 |
-77.040 |
-5 |
35,741 |
-93 |
|
| 4/23/18 |
5/14/18 |
21 |
|
- cash - |
| |
5/14/18 |
5/21/18 |
7 |
|
|
|
ISS |
100 |
9 |
|
3,772.235 |
3,771.281 |
3,773.189 |
0.954 |
0 |
35,750 |
1 |
|
| 5/21/18 |
5/28/18 |
7 |
|
- cash - |
| |
5/28/18 |
6/04/18 |
7 |
|
|
|
Genmab |
100 |
2 |
|
16,271.438 |
16,875.199 |
15,667.677 |
-603.761 |
-4 |
34,542 |
-86 |
|
| 6/04/18 |
6/25/18 |
21 |
|
- cash - |
| |
6/25/18 |
7/02/18 |
7 |
|
|
|
Pandora |
100 |
4 |
|
8,277.455 |
7,616.719 |
8,995.509 |
718.054 |
9 |
37,414 |
7,554 |
|
| 7/02/18 |
10/08/18 |
98 |
|
- cash - |
| |
10/08/18 |
2/11/19 |
126 |
|
|
|
Danske Bank |
100 |
15 |
|
2,490.749 |
2,080.120 |
2,982.440 |
491.691 |
20 |
44,790 |
69 |
|
| 2/11/19 |
8/05/19 |
175 |
|
- cash - |
| |
8/05/19 |
9/02/19 |
28 |
|
|
|
Ambu |
100 |
29 |
|
1,533.457 |
1,847.462 |
1,219.451 |
-314.005 |
-20 |
35,684 |
-95 |
|
| |
9/02/19 |
9/16/19 |
14 |
|
|
|
Danske Bank |
100 |
25 |
|
1,374.274 |
1,612.831 |
1,135.717 |
-238.557 |
-17 |
29,720 |
-99 |
|
| 9/16/19 |
11/04/19 |
49 |
|
- cash - |
| |
11/04/19 |
11/11/19 |
7 |
|
|
|
Ambu |
100 |
17 |
|
1,680.831 |
1,636.517 |
1,726.345 |
45.514 |
3 |
30,493 |
303 |
|
| 11/11/19 |
3/09/20 |
119 |
|
- cash - |
| |
3/09/20 |
6/22/20 |
105 |
|
|
|
ISS |
100 |
18 |
|
1,619.231 |
1,908.102 |
1,330.361 |
-288.870 |
-18 |
25,294 |
-49 |
|
| 6/22/20 |
11/02/20 |
133 |
|
- cash - |
| |
11/02/20 |
11/09/20 |
7 |
|
|
|
ISS |
100 |
17 |
|
1,426.376 |
1,808.477 |
1,044.276 |
-382.101 |
-27 |
18,798 |
-100 |
|
| 11/09/20 |
10/04/21 |
329 |
|
- cash - |
| |
10/04/21 |
10/18/21 |
14 |
|
|
|
Ambu |
100 |
5 |
|
3,160.861 |
3,145.674 |
3,176.121 |
15.260 |
0 |
18,874 |
13 |
|
| 10/18/21 |
11/08/21 |
21 |
|
- cash - |
| |
11/08/21 |
11/15/21 |
7 |
|
|
|
Ambu |
100 |
6 |
|
3,076.156 |
3,334.999 |
2,817.314 |
-258.842 |
-8 |
17,321 |
-99 |
|
| 11/15/21 |
11/29/21 |
14 |
|
- cash - |
| |
11/29/21 |
12/27/21 |
28 |
|
|
|
GN Store Nord |
100 |
0 |
|
49,426.208 |
53,552.864 |
45,299.552 |
-4,126.656 |
-8 |
17,321 |
0 |
|
| 12/27/21 |
1/10/22 |
14 |
|
- cash - |
| |
1/10/22 |
8/15/22 |
217 |
|
|
|
Ambu |
100 |
6 |
|
2,668.553 |
1,421.453 |
5,009.789 |
2,341.236 |
88 |
31,369 |
188 |
|
| 8/15/22 |
8/22/22 |
7 |
|
- cash - |
| |
8/22/22 |
9/12/22 |
21 |
|
|
|
Ambu |
100 |
23 |
|
1,311.748 |
1,482.476 |
1,141.019 |
-170.728 |
-13 |
27,442 |
-91 |
|
| 9/12/22 |
9/19/22 |
7 |
|
- cash - |
| |
9/19/22 |
10/31/22 |
42 |
|
|
|
Rockwool |
100 |
1 |
|
24,333.524 |
29,605.518 |
19,061.531 |
-5,271.993 |
-22 |
22,170 |
-88 |
|
| |
10/31/22 |
11/14/22 |
14 |
|
|
|
GN Store Nord |
100 |
0 |
|
23,540.749 |
27,403.048 |
19,678.450 |
-3,862.299 |
-16 |
22,170 |
0 |
|
| 11/14/22 |
11/21/22 |
7 |
|
- cash - |
| |
11/21/22 |
12/05/22 |
14 |
|
|
|
GN Store Nord |
100 |
0 |
|
23,992.320 |
25,405.526 |
22,579.114 |
-1,413.206 |
-6 |
22,170 |
0 |
|
| 12/05/22 |
12/12/22 |
7 |
|
- cash - |
| |
12/12/22 |
1/02/23 |
21 |
|
|
|
GN Store Nord |
100 |
0 |
|
23,367.208 |
23,832.612 |
22,901.805 |
-465.404 |
-2 |
22,170 |
0 |
|
| 1/02/23 |
4/10/23 |
98 |
|
- cash - |
| |
4/10/23 |
4/17/23 |
7 |
|
|
|
Møller-Mærsk B |
100 |
9 |
|
2,232.016 |
2,733.160 |
1,730.872 |
-501.144 |
-22 |
17,660 |
-100 |
|
| L/S | date buy | date sell | days | | instrument | spl | pieces | | prc buy | prc sell | ps short | prc diff | d % | asset | yield | |
| 4/17/23 |
5/08/23 |
21 |
|
- cash - |
| |
5/08/23 |
5/15/23 |
7 |
|
|
|
Møller-Mærsk B |
100 |
7 |
|
2,409.516 |
2,427.957 |
2,391.076 |
-18.440 |
-1 |
17,531 |
-33 |
|
| 5/15/23 |
6/19/23 |
35 |
|
- cash - |
| |
6/19/23 |
7/03/23 |
14 |
|
|
|
Møller-Mærsk B |
100 |
7 |
|
2,489.981 |
2,629.453 |
2,350.509 |
-139.472 |
-6 |
16,554 |
-78 |
|
| 7/03/23 |
8/14/23 |
42 |
|
- cash - |
| |
8/14/23 |
9/11/23 |
28 |
|
|
|
Tryg |
100 |
5 |
|
2,785.623 |
2,833.111 |
2,738.134 |
-47.488 |
-2 |
16,317 |
-20 |
|
| |
9/11/23 |
12/18/23 |
98 |
|
|
|
Ørsted |
100 |
2 |
|
8,110.888 |
7,149.892 |
9,201.049 |
1,090.161 |
13 |
18,497 |
60 |
|
| 12/18/23 |
6/24/26 |
919 |
|
- cash - |
| accum | 7/10/06 |
12/18/23 | 2191 |
days out of 7478 invested (29%) |
85 |
18,497 |
11 |
|
Instrument Related Contribution
| instrument | L/S | date buy | date sell | days | prc buy | prc sell | ps short | prc diff | d % | | | total |
| Vestas Wind Systems | short | 10/04/10 | 10/25/10 | 21 | 631.17 | 609.02 | 654.12 | 22.95 | 3.64 | | | |
| | | 4/25/11 | 5/16/11 | 21 | 573.38 | 477.22 | 688.91 | 115.53 | 20.15 | | | |
| | | 5/23/11 | 11/28/11 | 189 | 495.19 | 203.77 | 1,203.41 | 708.21 | 143.02 | | | |
| | | 5/21/12 | 8/06/12 | 77 | 103.50 | 73.42 | 145.91 | 42.41 | 40.97 | | | |
| | | 1/29/18 | 2/26/18 | 28 | 1,446.77 | 1,585.11 | 1,308.43 | -138.34 | -9.56 | | | 285.80 |
| Rockwool | | 6/16/08 | 10/20/08 | 126 | 16,447.28 | 7,446.32 | 36,328.43 | 19,881.14 | 120.88 | | | |
| | | 9/08/14 | 9/15/14 | 7 | 16,039.36 | 16,087.63 | 15,991.09 | -48.27 | -0.30 | | | |
| | | 9/29/14 | 12/22/14 | 84 | 15,888.44 | 13,928.94 | 18,123.60 | 2,235.16 | 14.07 | | | |
| | | 1/19/15 | 1/26/15 | 7 | 12,407.31 | 12,586.14 | 12,228.48 | -178.83 | -1.44 | | | |
| | | 9/19/22 | 10/31/22 | 42 | 24,333.52 | 29,605.52 | 19,061.53 | -5,271.99 | -21.67 | | | 93.93 |
| GN Store Nord | | 8/20/07 | 8/27/07 | 7 | 8,204.76 | 8,281.00 | 8,128.52 | -76.24 | -0.93 | | | |
| | | 9/10/07 | 9/24/07 | 14 | 8,428.86 | 8,747.28 | 8,110.45 | -318.42 | -3.78 | | | |
| | | 10/29/07 | 5/05/08 | 189 | 9,039.25 | 4,388.58 | 18,618.33 | 9,579.08 | 105.97 | | | |
| | | 11/29/21 | 12/27/21 | 28 | 49,426.21 | 53,552.86 | 45,299.55 | -4,126.66 | -8.35 | | | |
| | | 10/31/22 | 11/14/22 | 14 | 23,540.75 | 27,403.05 | 19,678.45 | -3,862.30 | -16.41 | | | |
| | | 11/21/22 | 12/05/22 | 14 | 23,992.32 | 25,405.53 | 22,579.11 | -1,413.21 | -5.89 | | | |
| | | 12/12/22 | 1/02/23 | 21 | 23,367.21 | 23,832.61 | 22,901.80 | -465.40 | -1.99 | | | 38.75 |
| Carlsberg B | | 10/20/08 | 12/15/08 | 56 | 4,281.18 | 3,209.58 | 5,710.55 | 1,429.37 | 33.39 | | | 33.39 |
| Ambu | | 8/05/19 | 9/02/19 | 28 | 1,533.46 | 1,847.46 | 1,219.45 | -314.01 | -20.48 | | | |
| | | 11/04/19 | 11/11/19 | 7 | 1,680.83 | 1,636.52 | 1,726.34 | 45.51 | 2.71 | | | |
| | | 10/04/21 | 10/18/21 | 14 | 3,160.86 | 3,145.67 | 3,176.12 | 15.26 | 0.48 | | | |
| | | 11/08/21 | 11/15/21 | 7 | 3,076.16 | 3,335.00 | 2,817.31 | -258.84 | -8.41 | | | |
| | | 1/10/22 | 8/15/22 | 217 | 2,668.55 | 1,421.45 | 5,009.79 | 2,341.24 | 87.73 | | | |
| | | 8/22/22 | 9/12/22 | 21 | 1,311.75 | 1,482.48 | 1,141.02 | -170.73 | -13.02 | | | 22.74 |
| Ørsted | | 9/11/23 | 12/18/23 | 98 | 8,110.89 | 7,149.89 | 9,201.05 | 1,090.16 | 13.44 | | | 13.44 |
| instrument | L/S | date buy | date sell | days | prc buy | prc sell | ps short | prc diff | d % | | | total |
| Pandora | | 10/02/17 | 10/09/17 | 7 | 11,098.33 | 11,098.33 | 11,098.33 | -0.00 | 0.00 | | | |
| | | 6/25/18 | 7/02/18 | 7 | 8,277.46 | 7,616.72 | 8,995.51 | 718.05 | 8.67 | | | 8.67 |
| Danske Bank | | 12/15/08 | 4/13/09 | 119 | 901.63 | 870.13 | 934.27 | 32.64 | 3.62 | | | |
| | | 10/08/18 | 2/11/19 | 126 | 2,490.75 | 2,080.12 | 2,982.44 | 491.69 | 19.74 | | | |
| | | 9/02/19 | 9/16/19 | 14 | 1,374.27 | 1,612.83 | 1,135.72 | -238.56 | -17.36 | | | 2.54 |
| Møller-Mærsk A | | 3/07/16 | 3/14/16 | 7 | 1,558.93 | 1,494.46 | 1,626.18 | 67.25 | 4.31 | | | |
| | | 3/21/16 | 4/18/16 | 28 | 1,471.94 | 1,423.45 | 1,522.07 | 50.14 | 3.41 | | | |
| | | 6/20/16 | 7/18/16 | 28 | 1,228.59 | 1,273.58 | 1,183.60 | -44.99 | -3.66 | | | |
| | | 3/19/18 | 4/02/18 | 14 | 1,583.58 | 1,572.89 | 1,594.34 | 10.76 | 0.68 | | | |
| | | 4/16/18 | 4/23/18 | 7 | 1,516.99 | 1,594.03 | 1,439.95 | -77.04 | -5.08 | | | -0.69 |
| Tryg | | 8/14/23 | 9/11/23 | 28 | 2,785.62 | 2,833.11 | 2,738.13 | -47.49 | -1.70 | | | -1.70 |
| Novo Nordisk | | 6/24/13 | 7/01/13 | 7 | 1,501.79 | 1,576.20 | 1,427.39 | -74.40 | -4.95 | | | |
| | | 11/21/16 | 2/06/17 | 77 | 1,799.93 | 1,878.34 | 1,721.53 | -78.40 | -4.36 | | | -9.09 |
| Møller-Mærsk B | | 7/10/06 | 9/18/06 | 70 | 1,693.63 | 1,891.10 | 1,496.16 | -197.47 | -11.66 | | | |
| | | 8/10/15 | 10/19/15 | 70 | 2,195.28 | 1,936.24 | 2,488.98 | 293.70 | 13.38 | | | |
| | | 11/02/15 | 12/07/15 | 35 | 1,778.86 | 1,781.76 | 1,775.95 | -2.91 | -0.16 | | | |
| | | 12/14/15 | 12/21/15 | 7 | 1,632.29 | 1,569.90 | 1,697.16 | 64.87 | 3.97 | | | |
| | | 1/18/16 | 1/25/16 | 7 | 1,330.65 | 1,423.20 | 1,238.11 | -92.55 | -6.95 | | | |
| | | 2/08/16 | 2/15/16 | 7 | 1,488.82 | 1,461.79 | 1,516.36 | 27.53 | 1.85 | | | |
| | | 3/05/18 | 3/12/18 | 7 | 1,681.30 | 1,653.22 | 1,709.85 | 28.55 | 1.70 | | | |
| | | 4/10/23 | 4/17/23 | 7 | 2,232.02 | 2,733.16 | 1,730.87 | -501.14 | -22.45 | | | |
| | | 5/08/23 | 5/15/23 | 7 | 2,409.52 | 2,427.96 | 2,391.08 | -18.44 | -0.77 | | | |
| | | 6/19/23 | 7/03/23 | 14 | 2,489.98 | 2,629.45 | 2,350.51 | -139.47 | -5.60 | | | -27.21 |
| Genmab | | 6/28/10 | 7/12/10 | 14 | 680.25 | 888.68 | 471.82 | -208.43 | -30.64 | | | |
| | | 8/23/10 | 9/06/10 | 14 | 826.78 | 832.28 | 821.29 | -5.50 | -0.66 | | | |
| | | 5/28/18 | 6/04/18 | 7 | 16,271.44 | 16,875.20 | 15,667.68 | -603.76 | -3.71 | | | -33.66 |
| instrument | L/S | date buy | date sell | days | prc buy | prc sell | ps short | prc diff | d % | | | total |
| ISS | | 5/14/18 | 5/21/18 | 7 | 3,772.23 | 3,771.28 | 3,773.19 | 0.95 | 0.03 | | | |
| | | 3/09/20 | 6/22/20 | 105 | 1,619.23 | 1,908.10 | 1,330.36 | -288.87 | -17.84 | | | |
| | | 11/02/20 | 11/09/20 | 7 | 1,426.38 | 1,808.48 | 1,044.28 | -382.10 | -26.79 | | | -39.83 |
Annotations
| 9/13/23 | Novo Nordisk | | | stock split 1:2 (two for one) |
| 6/18/18 | OMXC 20 | | | Ambu, FLSmidth and Tryg replace Møller-Mærsk A, Nordea Bank and TDC |
| 2/14/18 | OMXC 20 | | | Nordea Bank replaces Nets (acquired by Evergood 5) |
| 3/22/17 | OMXC 20 | | | index adaption: Dong Energy, Lundbeck and Nets for FlSmidth, Nordea and Tryg |
| 5/25/16 | William Demant | | | forward stock split 1:5 (five for one) |
| 9/16/15 | OMXC 20 | | | complete analysis
it was really a pleasure,
this combination of instruments seems to have been built for Share-o-matic |
| 5/18/15 | Tryg | | | forward stock split 1:5 (five for one) |
|
|