| | Sat, Jun 20th, 2026, 21:40UTC |
| | |

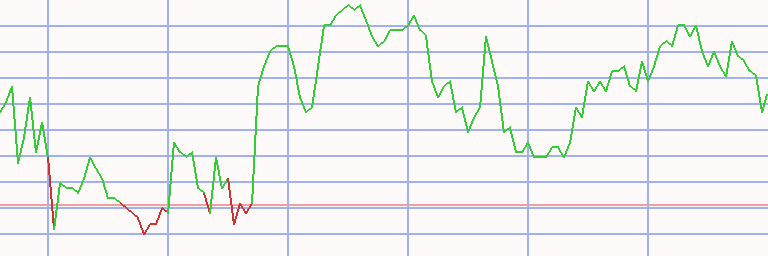
Assessment - Euro STOXX 50 in Euro - 7/01/24 - RS = 20
⇐
| |
|
⇓instrument |
freshest |
⇓ Δday |
7/01/24 |
⇓ Δwk |
2/12/24 |
prc diff |
⇓ Δ20 |
|
∅-RS |
| |  |
 |
 |
|
|
 |
Euro Stoxx 50 |
4,671.880 |
8/12/24 |
-0.07 |
4,929.990 |
-5.24 |
4,746.350 |
183.640 |
3.87 |
|
7.68 |
| | |
|
|
|
|
|
ASML |
784.600 |
8/12/24 |
0.08 |
954.300 |
-17.78 |
877.600 |
76.700 |
8.74 |
|
39.28 |
| | |
|
|
|
|
|
Unicredit |
34.570 |
8/12/24 |
0.38 |
36.205 |
-4.52 |
29.570 |
6.635 |
22.44 |
|
27.09 |
| | |
|
|
|
|
|
Schneider Electric |
211.250 |
8/12/24 |
0.38 |
225.350 |
-6.26 |
195.080 |
30.270 |
15.52 |
|
25.49 |
| | |
|
|
|
|
|
SAP |
189.300 |
8/12/24 |
-0.33 |
185.680 |
1.95 |
167.760 |
17.920 |
10.68 |
|
22.16 |
| | |
|
|
|
|
|
Intesa Sanpaolo |
3.471 |
8/12/24 |
0.54 |
3.582 |
-3.10 |
2.824 |
0.758 |
26.85 |
|
22.08 |
| | |
|
|
|
|
|
Inditex |
44.250 |
8/12/24 |
0.07 |
45.900 |
-3.59 |
39.420 |
6.480 |
16.44 |
|
22.07 |
| | |
|
|
|
|
|
Safran |
192.200 |
8/12/24 |
-0.18 |
202.100 |
-4.90 |
174.960 |
27.140 |
15.51 |
|
19.89 |
| | |
|
|
|
|
|
Wolters Kluwer |
150.000 |
8/12/24 |
0.20 |
153.550 |
-2.31 |
142.250 |
11.300 |
7.94 |
|
19.74 |
| | |
|
|
|
|
|
Ferrari |
385.700 |
8/12/24 |
|
382.200 |
0.92 |
360.400 |
21.800 |
6.05 |
|
18.71 |
| | |
|
|
|
L |
|
Münchener Rück |
439.200 |
8/12/24 |
1.01 |
466.900 |
-5.93 |
406.300 |
60.600 |
14.92 |
|
18.31 |
| | |
|
|
|
|
|
Adidas |
212.400 |
8/12/24 |
-1.03 |
219.500 |
-3.23 |
174.240 |
45.260 |
25.98 |
|
17.93 |
| | |
|
|
|
|
|
ING Groep |
15.232 |
8/12/24 |
0.21 |
16.358 |
-6.88 |
12.276 |
4.082 |
33.25 |
|
17.84 |
| | |
|
|
|
|
|
Saint-Gobain |
73.560 |
8/12/24 |
-0.41 |
74.500 |
-1.26 |
69.140 |
5.360 |
7.75 |
|
16.74 |
| | |
|
|
|
L |
|
Prosus |
32.850 |
8/12/24 |
1.77 |
33.115 |
-0.80 |
29.710 |
3.405 |
11.46 |
|
16.12 |
| | |
|
|
|
|
|
Banco Santander |
4.089 |
8/12/24 |
-0.24 |
4.448 |
-8.06 |
3.705 |
0.743 |
20.04 |
|
15.44 |
| | |
|
|
|
|
|
EssilorLuxottica |
207.300 |
8/12/24 |
-0.58 |
201.800 |
2.73 |
191.000 |
10.800 |
5.65 |
|
12.35 |
| | |
|
|
|
|
|
Banco Bilbao Viz |
8.924 |
8/12/24 |
0.27 |
9.500 |
-6.06 |
9.250 |
0.250 |
2.70 |
|
9.25 |
| | |
|
|
|
|
|
Adyen |
1,098.000 |
8/12/24 |
1.14 |
1,113.200 |
-1.37 |
1,507.000 |
-393.800 |
-26.13 |
|
9.22 |
| | |
|
|
|
|
|
Siemens |
157.200 |
8/12/24 |
0.01 |
177.120 |
-11.25 |
165.140 |
11.980 |
7.25 |
|
7.94 |
| | |
|
|
|
|
|
Allianz |
255.900 |
8/12/24 |
|
262.500 |
-2.51 |
246.250 |
16.250 |
6.60 |
|
7.44 |
| | |
|
|
|
L |
|
Infineon |
30.280 |
8/12/24 |
0.36 |
34.365 |
-11.89 |
34.265 |
0.100 |
0.29 |
|
7.08 |
| | |
|
|
|
L |
|
Nordea Bank |
10.420 |
8/12/24 |
-0.19 |
11.415 |
-8.72 |
10.736 |
0.679 |
6.32 |
|
6.97 |
| | |
|
|
|
L |
|
Iberdrola |
12.105 |
8/12/24 |
0.29 |
12.320 |
-1.75 |
10.785 |
1.535 |
14.23 |
|
6.71 |
| | |
|
|
|
L |
|
Deutsche Telekom |
24.730 |
8/12/24 |
0.49 |
23.680 |
4.43 |
22.260 |
1.420 |
6.38 |
|
6.60 |
| |
|
⇓instrument |
freshest |
⇓ Δday |
7/01/24 |
⇓ Δwk |
2/12/24 |
prc diff |
⇓ Δ20 |
|
∅-RS |
| | |
|
|
|
|
|
Deutsche Börse |
185.150 |
8/12/24 |
0.54 |
190.500 |
-2.81 |
187.600 |
2.900 |
1.55 |
|
6.10 |
| | |
|
|
|
|
|
L´Oreal |
376.650 |
8/12/24 |
-1.59 |
412.250 |
-8.64 |
428.650 |
-16.400 |
-3.83 |
|
5.47 |
| | |
|
|
|
|
|
Vivendi |
9.488 |
8/12/24 |
0.40 |
9.874 |
-3.91 |
10.445 |
-0.571 |
-5.47 |
|
4.40 |
| | |
|
|
|
|
|
Airbus |
133.760 |
8/12/24 |
-0.45 |
131.640 |
1.61 |
149.960 |
-18.320 |
-12.22 |
|
3.35 |
| | |
|
|
|
|
|
Danone |
60.140 |
8/12/24 |
0.07 |
57.700 |
4.23 |
61.010 |
-3.310 |
-5.43 |
|
2.97 |
| | |
|
|
|
|
|
TotalEnergies |
61.720 |
8/12/24 |
0.60 |
63.610 |
-2.97 |
59.820 |
3.790 |
6.34 |
|
2.12 |
| | |
|
|
|
|
|
Enel |
6.438 |
8/12/24 |
0.44 |
6.607 |
-2.56 |
5.917 |
0.690 |
11.66 |
|
2.05 |
| | |
|
|
|
L |
|
Nokia |
3.518 |
8/12/24 |
1.05 |
3.670 |
-4.14 |
3.363 |
0.307 |
9.13 |
|
1.09 |
| | |
|
|
|
|
|
Anheuser-Busch InBev |
55.200 |
8/12/24 |
-0.47 |
54.440 |
1.40 |
59.850 |
-5.410 |
-9.04 |
|
1.03 |
| | |
|
|
|
|
|
Axa |
32.350 |
8/12/24 |
-0.77 |
31.260 |
3.49 |
30.630 |
0.630 |
2.06 |
|
0.60 |
| | |
|
|
|
L |
|
Ahold Delhaize |
29.720 |
8/12/24 |
-0.30 |
27.960 |
6.29 |
26.325 |
1.635 |
6.21 |
|
-0.42 |
| | |
|
|
|
|
|
BNP Paribas |
59.250 |
8/12/24 |
|
61.670 |
-3.92 |
54.170 |
7.500 |
13.85 |
|
-1.82 |
| | |
|
|
|
S |
|
BASF |
41.280 |
8/12/24 |
-0.22 |
44.390 |
-7.01 |
44.820 |
-0.430 |
-0.96 |
|
-2.61 |
| | |
|
|
|
S |
|
Stellantis |
13.980 |
8/12/24 |
-0.57 |
18.634 |
-24.98 |
22.640 |
-4.006 |
-17.69 |
|
-3.30 |
| | |
|
|
|
S |
|
Mercedes-Benz |
57.480 |
8/12/24 |
-0.57 |
64.800 |
-11.30 |
65.650 |
-0.850 |
-1.29 |
|
-4.70 |
| | |
|
|
|
|
|
Sanofi |
95.670 |
8/12/24 |
-0.60 |
91.850 |
4.16 |
86.070 |
5.780 |
6.72 |
|
-4.86 |
| | |
|
|
|
S |
|
LVMH |
635.100 |
8/12/24 |
-0.14 |
712.000 |
-10.80 |
821.900 |
-109.900 |
-13.37 |
|
-6.25 |
| | |
|
|
|
S |
|
Air Liquide |
162.300 |
8/12/24 |
-0.79 |
162.620 |
-0.20 |
168.200 |
-5.580 |
-3.32 |
|
-6.52 |
| | |
|
|
|
S |
|
Eni |
14.456 |
8/12/24 |
1.09 |
14.532 |
-0.52 |
14.438 |
0.094 |
0.65 |
|
-7.22 |
| | |
|
|
|
S |
|
Volkswagen |
93.500 |
8/12/24 |
-0.47 |
106.050 |
-11.83 |
119.760 |
-13.710 |
-11.45 |
|
-8.53 |
| | |
|
|
|
|
|
Deutsche Post |
36.040 |
8/12/24 |
-0.36 |
38.520 |
-6.44 |
42.235 |
-3.715 |
-8.80 |
|
-9.28 |
| | |
|
|
|
S |
|
Vinci |
102.650 |
8/12/24 |
-0.77 |
100.900 |
1.73 |
116.180 |
-15.280 |
-13.15 |
|
-10.60 |
| | |
|
|
|
S |
|
BMW |
78.980 |
8/12/24 |
-0.90 |
89.140 |
-11.40 |
102.140 |
-13.000 |
-12.73 |
|
-12.27 |
| | |
|
|
|
S |
|
Pernod Ricard |
121.800 |
8/12/24 |
-0.33 |
126.950 |
-4.06 |
155.050 |
-28.100 |
-18.12 |
|
-18.73 |
| | |
|
|
|
S |
|
Kering |
249.850 |
8/12/24 |
-1.85 |
336.000 |
-25.64 |
411.900 |
-75.900 |
-18.43 |
|
-25.11 |
| |
|
⇓instrument |
freshest |
⇓ Δday |
7/01/24 |
⇓ Δwk |
2/12/24 |
prc diff |
⇓ Δ20 |
|
∅-RS |
| | |
|
|
|
L |
|
Bayer |
25.960 |
8/12/24 |
-0.04 |
26.170 |
-0.80 |
28.325 |
-2.155 |
-7.61 |
|
-25.49 |
| Euro 50 - 50 out of 50 instruments rated - 7/01/24 / 2/12/24 - 32 did rise, Market-Ratio(20) in EUR = 64.00 % |
| Stock Exchange Currency: EUR € Euro |
Technical Chart
Transactions Euro STOXX 50 in Euro * S20 - 20 ex 9 (1)
|
⇐ |
| |
| L/S | date buy | date sell | days | | instrument | spl | pieces | | prc buy | prc sell | ps short | prc diff | d % | asset | yield | |
| 1/02/06 |
7/17/06 |
196 |
|
- cash - |
| short |
7/17/06 |
7/24/06 |
7 |
|
|
|
Airbus |
100 |
494 |
|
20.220 |
21.560 |
18.880 |
-1.340 |
-7 |
9,338 |
-97 |
|
| 7/24/06 |
1/21/08 |
546 |
|
- cash - |
| |
1/21/08 |
2/18/08 |
28 |
|
|
|
Safran |
100 |
915 |
|
10.200 |
13.100 |
7.300 |
-2.900 |
-28 |
6,685 |
-99 |
|
| |
2/18/08 |
5/19/08 |
91 |
|
|
|
Infineon |
100 |
1,363 |
|
4.904 |
6.339 |
3.468 |
-1.435 |
-29 |
4,728 |
-75 |
|
| |
5/19/08 |
6/09/08 |
21 |
|
|
|
Nokia |
100 |
260 |
|
18.120 |
17.060 |
19.246 |
1.126 |
6 |
5,021 |
185 |
|
| 6/09/08 |
6/23/08 |
14 |
|
- cash - |
| |
6/23/08 |
6/30/08 |
7 |
|
|
|
Saint-Gobain |
100 |
125 |
|
40.030 |
39.740 |
40.322 |
0.292 |
1 |
5,057 |
46 |
|
| 6/30/08 |
7/07/08 |
7 |
|
- cash - |
| |
7/07/08 |
7/28/08 |
21 |
|
|
|
Saint-Gobain |
100 |
137 |
|
36.900 |
38.380 |
35.420 |
-1.480 |
-4 |
4,855 |
-51 |
|
| 7/28/08 |
8/25/08 |
28 |
|
- cash - |
| |
8/25/08 |
9/01/08 |
7 |
|
|
|
Deutsche Börse |
100 |
80 |
|
60.630 |
63.890 |
57.370 |
-3.260 |
-5 |
4,594 |
-94 |
|
| 9/01/08 |
9/08/08 |
7 |
|
- cash - |
| |
9/08/08 |
10/06/08 |
28 |
|
|
|
Deutsche Börse |
100 |
70 |
|
65.190 |
61.650 |
68.933 |
3.743 |
6 |
4,856 |
107 |
|
| |
10/06/08 |
11/24/08 |
49 |
|
|
|
Mercedes-Benz |
100 |
178 |
|
27.200 |
23.730 |
31.177 |
3.977 |
15 |
5,564 |
176 |
|
| |
11/24/08 |
3/16/09 |
112 |
|
|
|
ING Groep |
100 |
1,152 |
|
4.826 |
2.644 |
8.809 |
3.983 |
83 |
10,152 |
611 |
|
| 3/16/09 |
3/23/09 |
7 |
|
- cash - |
| |
3/23/09 |
4/06/09 |
14 |
|
|
|
Infineon |
100 |
14,322 |
|
0.709 |
0.999 |
0.419 |
-0.290 |
-41 |
6,001 |
-100 |
|
| 4/06/09 |
8/08/11 |
854 |
|
- cash - |
| |
8/08/11 |
8/15/11 |
7 |
|
|
|
Nokia |
100 |
1,600 |
|
3.750 |
4.070 |
3.430 |
-0.320 |
-9 |
5,489 |
-99 |
|
| 8/15/11 |
8/22/11 |
7 |
|
- cash - |
| |
8/22/11 |
10/31/11 |
70 |
|
|
|
Unicredit |
100 |
185 |
|
29.672 |
27.988 |
31.457 |
1.785 |
6 |
5,820 |
36 |
|
| 10/31/11 |
11/07/11 |
7 |
|
- cash - |
| |
11/07/11 |
12/26/11 |
49 |
|
|
|
Unicredit |
100 |
222 |
|
26.123 |
21.701 |
31.446 |
5.323 |
20 |
7,001 |
298 |
|
| 12/26/11 |
6/25/12 |
182 |
|
- cash - |
| |
6/25/12 |
7/02/12 |
7 |
|
|
|
Nokia |
100 |
4,094 |
|
1.710 |
1.640 |
1.783 |
0.073 |
4 |
7,300 |
784 |
|
| 7/02/12 |
10/13/14 |
833 |
|
- cash - |
| |
10/13/14 |
11/03/14 |
21 |
|
|
|
Adidas |
100 |
131 |
|
55.510 |
57.560 |
53.460 |
-2.050 |
-4 |
7,032 |
-48 |
|
| 11/03/14 |
8/24/15 |
294 |
|
- cash - |
| |
8/24/15 |
10/26/15 |
63 |
|
|
|
Banco Santander |
100 |
1,349 |
|
5.210 |
5.230 |
5.190 |
-0.020 |
0 |
7,005 |
-2 |
|
| 10/26/15 |
3/21/16 |
147 |
|
- cash - |
| |
3/21/16 |
4/25/16 |
35 |
|
|
|
Unicredit |
100 |
374 |
|
18.712 |
16.667 |
21.008 |
2.296 |
12 |
7,863 |
234 |
|
| 4/25/16 |
3/26/18 |
700 |
|
- cash - |
| |
3/26/18 |
4/02/18 |
7 |
|
|
|
Inditex |
100 |
318 |
|
24.680 |
25.430 |
23.930 |
-0.750 |
-3 |
7,625 |
-80 |
|
| 4/02/18 |
10/15/18 |
196 |
|
- cash - |
| |
10/15/18 |
11/05/18 |
21 |
|
|
|
Intesa Sanpaolo |
100 |
3,734 |
|
2.042 |
1.976 |
2.109 |
0.067 |
3 |
7,877 |
76 |
|
| 11/05/18 |
12/10/18 |
35 |
|
- cash - |
| |
12/10/18 |
1/21/19 |
42 |
|
|
|
Bayer |
100 |
129 |
|
60.800 |
65.970 |
55.630 |
-5.170 |
-9 |
7,210 |
-54 |
|
| 1/21/19 |
3/09/20 |
413 |
|
- cash - |
| |
3/09/20 |
6/08/20 |
91 |
|
|
|
Anheuser-Busch InBev |
100 |
168 |
|
42.705 |
50.700 |
34.710 |
-7.995 |
-19 |
5,867 |
-56 |
|
| 6/08/20 |
6/15/20 |
7 |
|
- cash - |
| |
6/15/20 |
6/22/20 |
7 |
|
|
|
Banco Santander |
100 |
2,728 |
|
2.151 |
2.130 |
2.172 |
0.021 |
1 |
5,925 |
67 |
|
| 6/22/20 |
6/29/20 |
7 |
|
- cash - |
| |
6/29/20 |
7/06/20 |
7 |
|
|
|
Airbus |
100 |
93 |
|
63.350 |
67.720 |
58.980 |
-4.370 |
-7 |
5,518 |
-98 |
|
| 7/06/20 |
3/07/22 |
609 |
|
- cash - |
| |
3/07/22 |
3/14/22 |
7 |
|
|
|
Vivendi |
100 |
513 |
|
10.740 |
11.735 |
9.745 |
-0.995 |
-9 |
5,008 |
-99 |
|
| L/S | date buy | date sell | days | | instrument | spl | pieces | | prc buy | prc sell | ps short | prc diff | d % | asset | yield | |
| 3/14/22 |
5/23/22 |
70 |
|
- cash - |
| |
5/23/22 |
6/20/22 |
28 |
|
|
|
Prosus |
100 |
244 |
|
20.440 |
22.570 |
18.310 |
-2.130 |
-10 |
4,488 |
-76 |
|
| |
6/20/22 |
7/18/22 |
28 |
|
|
|
Adyen |
100 |
3 |
|
1,238.600 |
1,550.000 |
927.200 |
-311.400 |
-25 |
3,554 |
-98 |
|
| |
7/18/22 |
7/25/22 |
7 |
|
|
|
Adidas |
100 |
21 |
|
165.180 |
176.020 |
154.340 |
-10.840 |
-7 |
3,326 |
-97 |
|
| 7/25/22 |
9/05/22 |
42 |
|
- cash - |
| |
9/05/22 |
9/12/22 |
7 |
|
|
|
Adidas |
100 |
22 |
|
145.200 |
149.220 |
141.180 |
-4.020 |
-3 |
3,238 |
-77 |
|
| 9/12/22 |
10/03/22 |
21 |
|
- cash - |
| |
10/03/22 |
10/10/22 |
7 |
|
|
|
Adidas |
100 |
27 |
|
119.000 |
114.240 |
123.958 |
4.958 |
4 |
3,372 |
740 |
|
| 10/10/22 |
10/17/22 |
7 |
|
- cash - |
| |
10/17/22 |
10/24/22 |
7 |
|
|
|
Adidas |
100 |
28 |
|
118.180 |
103.820 |
134.526 |
16.346 |
14 |
3,829 |
85,744 |
|
| 10/24/22 |
6/20/26 |
1335 |
|
- cash - |
| accum | 7/17/06 |
10/24/22 | 903 |
days out of 7474 invested (12%) |
-62 |
3,829 |
-32 |
|
Instrument Related Contribution
| instrument | L/S | date buy | date sell | days | prc buy | prc sell | ps short | prc diff | d % | | | total |
| ING Groep | short | 11/24/08 | 3/16/09 | 112 | 4.83 | 2.64 | 8.81 | 3.98 | 82.53 | | | 82.53 |
| Unicredit | | 8/22/11 | 10/31/11 | 70 | 29.67 | 27.99 | 31.46 | 1.79 | 6.02 | | | |
| | | 11/07/11 | 12/26/11 | 49 | 26.12 | 21.70 | 31.45 | 5.32 | 20.38 | | | |
| | | 3/21/16 | 4/25/16 | 35 | 18.71 | 16.67 | 21.01 | 2.30 | 12.27 | | | 43.28 |
| Mercedes-Benz | | 10/06/08 | 11/24/08 | 49 | 27.20 | 23.73 | 31.18 | 3.98 | 14.62 | | | 14.62 |
| Adidas | | 10/13/14 | 11/03/14 | 21 | 55.51 | 57.56 | 53.46 | -2.05 | -3.69 | | | |
| | | 7/18/22 | 7/25/22 | 7 | 165.18 | 176.02 | 154.34 | -10.84 | -6.56 | | | |
| | | 9/05/22 | 9/12/22 | 7 | 145.20 | 149.22 | 141.18 | -4.02 | -2.77 | | | |
| | | 10/03/22 | 10/10/22 | 7 | 119.00 | 114.24 | 123.96 | 4.96 | 4.17 | | | |
| | | 10/17/22 | 10/24/22 | 7 | 118.18 | 103.82 | 134.53 | 16.35 | 13.83 | | | 3.75 |
| Intesa Sanpaolo | | 10/15/18 | 11/05/18 | 21 | 2.04 | 1.98 | 2.11 | 0.07 | 3.31 | | | 3.31 |
| Nokia | | 5/19/08 | 6/09/08 | 21 | 18.12 | 17.06 | 19.25 | 1.13 | 6.21 | | | |
| | | 8/08/11 | 8/15/11 | 7 | 3.75 | 4.07 | 3.43 | -0.32 | -8.53 | | | |
| | | 6/25/12 | 7/02/12 | 7 | 1.71 | 1.64 | 1.78 | 0.07 | 4.27 | | | 1.30 |
| Banco Santander | | 8/24/15 | 10/26/15 | 63 | 5.21 | 5.23 | 5.19 | -0.02 | -0.38 | | | |
| | | 6/15/20 | 6/22/20 | 7 | 2.15 | 2.13 | 2.17 | 0.02 | 0.99 | | | 0.60 |
| Deutsche Börse | | 8/25/08 | 9/01/08 | 7 | 60.63 | 63.89 | 57.37 | -3.26 | -5.38 | | | |
| | | 9/08/08 | 10/06/08 | 28 | 65.19 | 61.65 | 68.93 | 3.74 | 5.74 | | | 0.06 |
| Inditex | | 3/26/18 | 4/02/18 | 7 | 24.68 | 25.43 | 23.93 | -0.75 | -3.04 | | | -3.04 |
| Saint-Gobain | | 6/23/08 | 6/30/08 | 7 | 40.03 | 39.74 | 40.32 | 0.29 | 0.73 | | | |
| | | 7/07/08 | 7/28/08 | 21 | 36.90 | 38.38 | 35.42 | -1.48 | -4.01 | | | -3.31 |
| Bayer | | 12/10/18 | 1/21/19 | 42 | 60.80 | 65.97 | 55.63 | -5.17 | -8.50 | | | -8.50 |
| Vivendi | | 3/07/22 | 3/14/22 | 7 | 10.74 | 11.74 | 9.75 | -1.00 | -9.26 | | | -9.26 |
| Prosus | | 5/23/22 | 6/20/22 | 28 | 20.44 | 22.57 | 18.31 | -2.13 | -10.42 | | | -10.42 |
| Airbus | | 7/17/06 | 7/24/06 | 7 | 20.22 | 21.56 | 18.88 | -1.34 | -6.63 | | | |
| | | 6/29/20 | 7/06/20 | 7 | 63.35 | 67.72 | 58.98 | -4.37 | -6.90 | | | -13.07 |
| instrument | L/S | date buy | date sell | days | prc buy | prc sell | ps short | prc diff | d % | | | total |
| Anheuser-Busch InBev | | 3/09/20 | 6/08/20 | 91 | 42.71 | 50.70 | 34.71 | -8.00 | -18.72 | | | -18.72 |
| Adyen | | 6/20/22 | 7/18/22 | 28 | 1,238.60 | 1,550.00 | 927.20 | -311.40 | -25.14 | | | -25.14 |
| Safran | | 1/21/08 | 2/18/08 | 28 | 10.20 | 13.10 | 7.30 | -2.90 | -28.43 | | | -28.43 |
| Infineon | | 2/18/08 | 5/19/08 | 91 | 4.90 | 6.34 | 3.47 | -1.44 | -29.27 | | | |
| | | 3/23/09 | 4/06/09 | 14 | 0.71 | 1.00 | 0.42 | -0.29 | -40.89 | | | -58.19 |
Annotations
| 2/19/24 | Euro 50 | | | Component update: Ferrari, Saint-Gobain, Vivendi and Wolters Kluwer replace CRH, Flutter,
Hermes and Vonovia |
| 9/14/23 | Prosus | | | stock split 1:2.1796 (two-point-onesevenninesix for one) |
| 9/24/18 | Euro 50 | | | Amadeus, Kering and Linde replace Deutsche Bank, E.ON and Saint-Gobain |
| 1/23/17 | Unicredit | | | reverse stock split 10:1 (one for ten) |
| 10/04/16 | AB InBev | | | acquisition of SAB Miller completed |
| 9/19/16 | Euro 50 | | | Adidas, Ahold Delhaize and CRH replace Carrefour, Generali and Unicredit |
| 7/24/16 | Ahold Delhaize | | | merger |
| 9/21/15 | Euro 50 | | | Fresenius and Safran replace Repsol and RWE |
| 9/12/15 | Euro 50 | | | complete analysis
ex Repsol, RWE - in Fresenius, Safran |
| 8/22/15 | Euro 50 | | | complete analysis - difficult market |
| 9/22/14 | €-Stoxx 50 | | | Nokia replaces CRH. |
|
|