| | Tue, Jun 23rd, 2026, 9:14UTC |
| | |

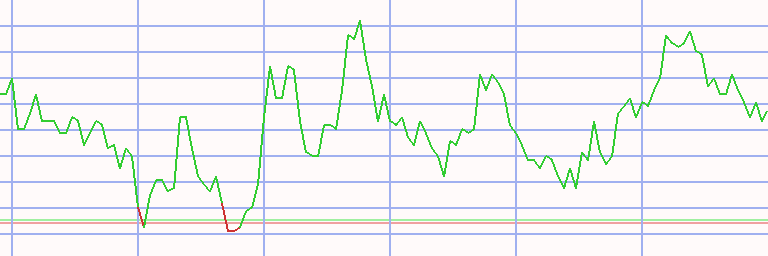
Assessment - Dow Jones Composite Average in Swiss Franc - 7/01/24 - RS = 21
⇐
| |
|
⇓instrument |
freshest |
⇓ Δday |
7/01/24 |
⇓ Δwk |
2/05/24 |
prc diff |
Δ21 |
|
⇓∅-RS |
| |  |
 |
 |
|
|
 |
DJCA |
11,418.973 |
8/12/24 |
-0.32 |
11,247.554 |
1.52 |
10,673.507 |
574.048 |
5.38 |
|
6.44 |
| | |
|
|
|
L |
|
Kirby |
105.282 |
8/12/24 |
-0.14 |
109.384 |
-3.75 |
73.076 |
36.308 |
49.69 |
|
44.01 |
| | |
|
|
|
L |
|
PSEG |
72.751 |
8/12/24 |
0.81 |
66.534 |
9.34 |
50.625 |
15.909 |
31.42 |
|
18.83 |
| | |
|
|
|
S |
|
FedEx |
252.248 |
8/12/24 |
0.63 |
269.896 |
-6.54 |
207.294 |
62.602 |
30.20 |
|
19.38 |
| | |
|
|
|
L |
|
NextEra Energy |
70.103 |
8/12/24 |
0.15 |
63.164 |
10.99 |
48.686 |
14.478 |
29.74 |
|
12.94 |
| | |
|
|
|
L |
|
Goldman Sachs |
438.712 |
8/12/24 |
-0.97 |
418.976 |
4.71 |
333.170 |
85.806 |
25.75 |
|
29.55 |
| | |
|
|
|
|
|
United Airlines |
36.525 |
8/12/24 |
-2.51 |
43.672 |
-16.37 |
34.803 |
8.870 |
25.49 |
|
9.30 |
| | |
|
|
|
L |
|
Walmart |
62.079 |
8/12/24 |
1.10 |
60.977 |
1.81 |
48.903 |
12.074 |
24.69 |
|
23.30 |
| | |
|
|
|
|
|
Delta Air Lines |
35.296 |
8/12/24 |
-0.61 |
42.398 |
-16.75 |
34.133 |
8.265 |
24.22 |
|
14.19 |
| | |
|
|
|
|
|
JP Morgan Chase |
186.319 |
8/12/24 |
0.19 |
185.650 |
0.36 |
151.789 |
33.861 |
22.31 |
|
26.65 |
| | |
|
|
|
L |
|
C.H. Robinson |
89.188 |
8/12/24 |
0.20 |
78.444 |
13.70 |
64.404 |
14.040 |
21.80 |
|
6.20 |
| | |
|
|
|
L |
|
Apple |
196.566 |
8/12/24 |
0.71 |
195.861 |
0.36 |
163.254 |
32.608 |
19.97 |
|
20.39 |
| | |
|
|
|
L |
|
Southern |
78.796 |
8/12/24 |
0.46 |
69.579 |
13.25 |
58.437 |
11.143 |
19.07 |
|
11.60 |
| | |
|
|
|
|
|
Matson |
117.589 |
8/12/24 |
0.73 |
116.640 |
0.81 |
98.145 |
18.495 |
18.84 |
|
31.72 |
| | |
|
|
|
L |
|
AEP |
87.778 |
8/12/24 |
-0.40 |
78.869 |
11.30 |
66.805 |
12.064 |
18.06 |
|
9.22 |
| | |
|
|
|
|
|
Alaska Air Group |
31.257 |
8/12/24 |
-0.26 |
36.226 |
-13.72 |
30.688 |
5.538 |
18.05 |
|
2.67 |
| | |
|
|
|
|
|
American Express |
214.205 |
8/12/24 |
-0.34 |
211.277 |
1.39 |
179.137 |
32.140 |
17.94 |
|
29.31 |
| | |
|
|
|
|
|
Microsoft |
367.605 |
8/12/24 |
0.19 |
412.714 |
-10.93 |
352.855 |
59.859 |
16.96 |
|
25.25 |
| | |
|
|
|
L |
|
Honeywell |
177.825 |
8/12/24 |
-0.73 |
190.620 |
-6.71 |
167.890 |
22.730 |
13.54 |
|
9.36 |
| | |
|
|
|
|
|
Edison International |
74.468 |
8/12/24 |
0.52 |
64.329 |
15.76 |
57.027 |
7.302 |
12.80 |
|
5.56 |
| | |
|
|
|
L |
|
3M |
111.472 |
8/12/24 |
-0.65 |
90.914 |
22.61 |
80.661 |
10.253 |
12.71 |
|
4.12 |
| | |
|
|
|
|
|
Dominion Resources |
49.447 |
8/12/24 |
0.46 |
43.383 |
13.98 |
38.874 |
4.510 |
11.60 |
|
2.24 |
| | |
|
|
|
L |
|
Sempra |
71.378 |
8/12/24 |
0.74 |
67.745 |
5.36 |
60.933 |
6.812 |
11.18 |
|
5.83 |
| | |
|
|
|
|
|
Ryder System |
119.134 |
8/12/24 |
-1.29 |
110.866 |
7.46 |
100.224 |
10.642 |
10.62 |
|
16.53 |
| | |
|
|
|
|
|
FirstEnergy |
38.133 |
8/12/24 |
0.55 |
34.618 |
10.15 |
31.506 |
3.112 |
9.88 |
|
4.53 |
| |
|
⇓instrument |
freshest |
⇓ Δday |
7/01/24 |
⇓ Δwk |
2/05/24 |
prc diff |
Δ21 |
|
⇓∅-RS |
| | |
|
|
|
L |
|
AES |
15.100 |
8/12/24 |
0.30 |
15.759 |
-4.19 |
14.361 |
1.398 |
9.73 |
|
1.11 |
| | |
|
|
|
L |
|
Coca-Cola |
61.600 |
8/12/24 |
-0.74 |
57.182 |
7.73 |
52.226 |
4.956 |
9.49 |
|
8.35 |
| | |
|
|
|
L |
|
American Water |
128.821 |
8/12/24 |
0.20 |
115.448 |
11.58 |
105.704 |
9.743 |
9.22 |
|
1.06 |
| | |
|
|
|
L |
|
Duke Energy |
102.444 |
8/12/24 |
0.62 |
89.775 |
14.11 |
82.853 |
6.922 |
8.35 |
|
7.92 |
| | |
|
|
|
|
|
Atmos Energy |
116.243 |
8/12/24 |
0.46 |
104.803 |
10.92 |
97.232 |
7.571 |
7.79 |
|
3.00 |
| | |
|
|
|
|
|
Uber Technologies |
62.585 |
8/12/24 |
1.05 |
64.248 |
-2.59 |
60.011 |
4.237 |
7.06 |
|
28.45 |
| | |
|
|
|
L |
|
Procter & Gamble |
150.734 |
8/12/24 |
-2.19 |
147.038 |
2.51 |
137.619 |
9.419 |
6.84 |
|
7.34 |
| | |
|
|
|
|
|
Exelon |
33.344 |
8/12/24 |
-0.54 |
31.220 |
6.80 |
29.244 |
1.976 |
6.76 |
|
-7.42 |
| | |
|
|
|
|
|
Chevron |
131.044 |
8/12/24 |
0.02 |
141.436 |
-7.35 |
132.504 |
8.932 |
6.74 |
|
2.58 |
| | |
|
|
|
|
|
Caterpillar |
303.646 |
8/12/24 |
-0.66 |
297.366 |
2.11 |
279.570 |
17.796 |
6.37 |
|
15.10 |
| | |
|
|
|
|
|
Walt Disney |
77.667 |
8/12/24 |
-0.30 |
88.592 |
-12.33 |
84.071 |
4.521 |
5.38 |
|
5.24 |
| | |
|
|
|
|
|
Merck (MSD) |
102.544 |
8/12/24 |
-0.93 |
115.574 |
-11.27 |
109.758 |
5.816 |
5.30 |
|
13.76 |
| | |
|
|
|
|
|
Verizon |
36.624 |
8/12/24 |
-0.54 |
37.717 |
-2.90 |
35.994 |
1.723 |
4.79 |
|
15.08 |
| | |
|
|
|
|
|
Consolidated Edison |
92.116 |
8/12/24 |
0.91 |
80.251 |
14.78 |
78.000 |
2.252 |
2.89 |
|
-0.20 |
| | |
|
|
|
|
|
Dow |
47.187 |
8/12/24 |
-0.84 |
47.558 |
-0.78 |
46.241 |
1.317 |
2.85 |
|
-0.95 |
| | |
|
|
|
S |
|
UnitedHealth |
510.812 |
8/12/24 |
1.17 |
446.980 |
14.28 |
437.500 |
9.480 |
2.17 |
|
-0.23 |
| | |
|
|
|
S |
|
UPS |
112.827 |
8/12/24 |
-0.76 |
122.848 |
-8.16 |
120.979 |
1.869 |
1.55 |
|
-10.63 |
| | |
|
|
|
|
|
Expeditors Wash |
107.631 |
8/12/24 |
0.03 |
109.222 |
-1.46 |
108.357 |
0.864 |
0.80 |
|
2.91 |
| | |
|
|
|
L |
|
Amgen |
289.161 |
8/12/24 |
-0.77 |
281.037 |
2.89 |
280.066 |
0.972 |
0.35 |
|
16.06 |
| | |
|
|
|
S |
|
Cisco Systems |
40.537 |
8/12/24 |
-1.34 |
42.940 |
-5.60 |
43.066 |
-0.126 |
-0.29 |
|
-4.22 |
| | |
|
|
|
|
|
Visa |
234.844 |
8/12/24 |
0.05 |
237.871 |
-1.27 |
239.714 |
-1.842 |
-0.77 |
|
4.41 |
| | |
|
|
|
|
|
IBM |
171.220 |
8/12/24 |
-1.03 |
158.225 |
8.21 |
159.548 |
-1.323 |
-0.83 |
|
12.11 |
| | |
|
|
|
|
|
Travelers Companies |
189.518 |
8/12/24 |
-1.29 |
183.409 |
3.33 |
185.348 |
-1.938 |
-1.05 |
|
9.82 |
| | |
|
|
|
|
|
Landstar System |
167.271 |
8/12/24 |
-1.04 |
165.725 |
0.93 |
167.585 |
-1.860 |
-1.11 |
|
0.91 |
| | |
|
|
|
|
|
Home Depot |
312.484 |
8/12/24 |
-0.81 |
303.791 |
2.86 |
308.919 |
-5.128 |
-1.66 |
|
3.43 |
| |
|
⇓instrument |
freshest |
⇓ Δday |
7/01/24 |
⇓ Δwk |
2/05/24 |
prc diff |
Δ21 |
|
⇓∅-RS |
| | |
|
|
|
|
|
Southwest Airlines |
22.934 |
8/12/24 |
0.20 |
25.401 |
-9.71 |
25.878 |
-0.477 |
-1.84 |
|
-2.10 |
| | |
|
|
|
S |
|
Johnson & Johnson |
144.472 |
8/12/24 |
-0.46 |
132.327 |
9.18 |
135.523 |
-3.195 |
-2.36 |
|
-4.79 |
| | |
|
|
|
S |
|
CSX |
30.272 |
8/12/24 |
-1.47 |
30.353 |
-0.27 |
31.950 |
-1.597 |
-5.00 |
|
2.53 |
| | |
|
|
|
S |
|
Union Pacific |
213.934 |
8/12/24 |
-0.32 |
203.190 |
5.29 |
214.540 |
-11.350 |
-5.29 |
|
0.55 |
| | |
|
|
|
|
|
Boeing |
148.313 |
8/12/24 |
-2.25 |
168.707 |
-12.09 |
179.737 |
-11.030 |
-6.14 |
|
-6.38 |
| | |
|
|
|
L |
|
Xcel Energy |
52.429 |
8/12/24 |
0.10 |
47.377 |
10.66 |
50.904 |
-3.526 |
-6.93 |
|
-7.84 |
| | |
|
|
|
S |
|
salesforce.com |
227.091 |
8/12/24 |
-0.48 |
231.519 |
-1.91 |
250.613 |
-19.094 |
-7.62 |
|
6.95 |
| | |
|
|
|
S |
|
McDonald´s |
243.492 |
8/12/24 |
0.58 |
225.898 |
7.79 |
248.751 |
-22.853 |
-9.19 |
|
-8.59 |
| | |
|
|
|
S |
|
Old Dominion FL |
172.250 |
8/12/24 |
-1.35 |
161.478 |
6.67 |
180.251 |
-18.772 |
-10.41 |
|
-8.32 |
| | |
|
|
|
|
|
Norfolk Southern |
214.323 |
8/12/24 |
-1.02 |
193.431 |
10.80 |
216.141 |
-22.710 |
-10.51 |
|
-3.07 |
| | |
|
|
|
S |
|
American Airlines |
8.684 |
8/12/24 |
-2.54 |
9.976 |
-12.95 |
12.404 |
-2.428 |
-19.57 |
|
-19.25 |
| | |
|
|
|
|
|
Nike |
67.447 |
8/12/24 |
0.40 |
69.426 |
-2.85 |
86.707 |
-17.281 |
-19.93 |
|
-22.79 |
| | |
|
|
|
S |
|
J.B. Hunt |
147.084 |
8/12/24 |
-0.20 |
143.388 |
2.58 |
179.824 |
-36.437 |
-20.26 |
|
-13.22 |
| | |
|
|
|
S |
|
Intel |
17.494 |
8/12/24 |
-1.78 |
27.868 |
-37.22 |
37.204 |
-9.336 |
-25.09 |
|
-16.59 |
| | |
|
|
|
|
|
Avis Budget |
75.101 |
8/12/24 |
-4.43 |
91.519 |
-17.94 |
135.601 |
-44.082 |
-32.51 |
|
-33.32 |
| | |
|
|
|
S |
|
Walgreens Boots |
9.217 |
8/12/24 |
-4.49 |
10.464 |
-11.92 |
19.276 |
-8.812 |
-45.71 |
|
-45.76 |
| DJCA - 65 out of 65 instruments rated - 7/01/24 / 2/05/24 - 43 did rise, Market-Ratio(21) in CHF = 66.15 % |
| Stock Exchange Currency: USD $ Dollar |
Technical Chart
Transactions Dow Jones Composite Average in Swiss Franc * A21 - 14/13 (1)
|
⇐ |
| |
| L/S | date buy | date sell | days | | instrument | spl | pieces | | prc buy | prc sell | ps short | prc diff | d % | asset | yield | |
| 1/02/06 |
9/29/08 |
1001 |
|
- cash - |
| short |
9/29/08 |
10/27/08 |
28 |
|
|
|
Avis Budget |
100 |
1,503 |
|
6.653 |
1.634 |
27.089 |
20.436 |
307 |
40,716 |
> 999,999 |
|
| long |
10/27/08 |
11/03/08 |
7 |
|
|
|
Walmart |
100 |
2,107 |
|
19.322 |
21.610 |
|
2.288 |
12 |
45,538 |
34,159 |
|
| short |
11/03/08 |
11/24/08 |
21 |
|
|
|
Avis Budget |
100 |
17,951 |
|
2.537 |
0.672 |
9.570 |
7.033 |
277 |
171,785 |
> 999,999 |
|
| long |
11/24/08 |
1/05/09 |
42 |
|
|
|
Walmart |
100 |
7,988 |
|
21.505 |
20.352 |
|
-1.153 |
-5 |
162,572 |
-38 |
|
| short |
1/05/09 |
3/16/09 |
70 |
|
|
|
Avis Budget |
100 |
188,117 |
|
0.864 |
0.522 |
1.432 |
0.568 |
66 |
269,403 |
1,292 |
|
| long |
3/16/09 |
3/23/09 |
7 |
|
|
|
PG & E |
100 |
6,169 |
|
43.664 |
45.470 |
|
1.806 |
4 |
280,542 |
727 |
|
| short |
3/23/09 |
3/30/09 |
7 |
|
|
|
Avis Budget |
100 |
296,225 |
|
0.947 |
0.950 |
0.944 |
-0.003 |
0 |
279,696 |
-15 |
|
| long |
3/30/09 |
8/24/15 |
2338 |
|
|
|
Verizon |
100 |
8,087 |
|
34.584 |
41.649 |
|
7.065 |
20 |
336,832 |
3 |
|
| short |
8/24/15 |
8/31/15 |
7 |
|
|
|
Chevron |
100 |
5,017 |
|
67.138 |
78.354 |
55.923 |
-11.216 |
-17 |
280,563 |
-100 |
|
| long |
8/31/15 |
3/16/20 |
1659 |
|
|
|
JetBlue Airways |
100 |
12,992 |
|
21.593 |
10.044 |
|
-11.550 |
-53 |
130,512 |
-15 |
|
| short |
3/16/20 |
4/27/20 |
42 |
|
|
|
Boeing |
100 |
1,063 |
|
122.695 |
125.591 |
119.799 |
-2.896 |
-2 |
127,434 |
-19 |
|
| long |
4/27/20 |
5/04/20 |
7 |
|
|
|
Apple |
100 |
1,844 |
|
69.093 |
70.771 |
|
1.678 |
2 |
130,527 |
249 |
|
| short |
5/04/20 |
5/18/20 |
14 |
|
|
|
United Airlines |
100 |
5,351 |
|
24.392 |
23.396 |
25.430 |
1.038 |
4 |
136,084 |
197 |
|
| long |
5/18/20 |
5/25/20 |
7 |
|
|
|
Apple |
100 |
1,782 |
|
76.344 |
77.382 |
|
1.038 |
1 |
137,933 |
102 |
|
| short |
5/25/20 |
6/01/20 |
7 |
|
|
|
United Airlines |
100 |
5,594 |
|
24.654 |
28.303 |
21.005 |
-3.649 |
-15 |
117,520 |
-100 |
|
| long |
6/01/20 |
6/22/20 |
21 |
|
|
|
Apple |
100 |
1,520 |
|
77.303 |
84.978 |
|
7.675 |
10 |
129,186 |
418 |
|
| short |
6/22/20 |
7/06/20 |
14 |
|
|
|
United Airlines |
100 |
3,732 |
|
34.610 |
33.139 |
36.146 |
1.536 |
4 |
134,919 |
210 |
|
| long |
7/06/20 |
6/20/22 |
714 |
|
|
|
Apple |
100 |
1,533 |
|
87.965 |
127.194 |
|
39.230 |
45 |
195,059 |
21 |
|
| short |
6/20/22 |
6/27/22 |
7 |
|
|
|
JetBlue Airways |
100 |
23,624 |
|
8.257 |
8.363 |
8.151 |
-0.106 |
-1 |
192,554 |
-49 |
|
| long |
6/27/22 |
9/26/22 |
91 |
|
|
|
Chevron |
100 |
1,366 |
|
140.875 |
140.220 |
|
-0.655 |
0 |
191,659 |
-2 |
|
| short |
9/26/22 |
10/17/22 |
21 |
|
|
|
JetBlue Airways |
100 |
29,060 |
|
6.595 |
6.819 |
6.371 |
-0.224 |
-3 |
185,144 |
-45 |
|
| long |
10/17/22 |
8/12/24 |
665 |
|
|
|
PG & E |
100 |
13,133 |
|
14.097 |
16.473 |
|
2.376 |
17 |
216,353 |
9 |
|
| accum | 9/29/08 |
8/12/24 | 6476 |
days out of 7477 invested (87%) |
2,064 |
216,353 |
19 |
|
Instrument Related Contribution
| instrument | L/S | date buy | date sell | days | prc buy | prc sell | ps short | prc diff | d % | | | total |
| Avis Budget | short | 9/29/08 | 10/27/08 | 28 | 6.65 | 1.63 | 27.09 | 20.44 | 307.19 | | | |
| | short | 11/03/08 | 11/24/08 | 21 | 2.54 | 0.67 | 9.57 | 7.03 | 277.25 | | | |
| | short | 1/05/09 | 3/16/09 | 70 | 0.86 | 0.52 | 1.43 | 0.57 | 65.71 | | | |
| | short | 3/23/09 | 3/30/09 | 7 | 0.95 | 0.95 | 0.94 | -0.00 | -0.30 | | | 2,437.85 |
| Apple | long | 4/27/20 | 5/04/20 | 7 | 69.09 | 70.77 | | 1.68 | 2.43 | | | |
| | long | 5/18/20 | 5/25/20 | 7 | 76.34 | 77.38 | | 1.04 | 1.36 | | | |
| | long | 6/01/20 | 6/22/20 | 21 | 77.30 | 84.98 | | 7.67 | 9.93 | | | |
| | long | 7/06/20 | 6/20/22 | 714 | 87.96 | 127.19 | | 39.23 | 44.60 | | | 65.03 |
| PG & E | long | 3/16/09 | 3/23/09 | 7 | 43.66 | 45.47 | | 1.81 | 4.14 | | | |
| | long | 10/17/22 | 8/12/24 | 665 | 14.10 | 16.47 | | 2.38 | 16.86 | | | 21.69 |
| Verizon | long | 3/30/09 | 8/24/15 | 2338 | 34.58 | 41.65 | | 7.07 | 20.43 | | | 20.43 |
| Walmart | long | 10/27/08 | 11/03/08 | 7 | 19.32 | 21.61 | | 2.29 | 11.84 | | | |
| | long | 11/24/08 | 1/05/09 | 42 | 21.51 | 20.35 | | -1.15 | -5.36 | | | 5.85 |
| Boeing | short | 3/16/20 | 4/27/20 | 42 | 122.70 | 125.59 | 119.80 | -2.90 | -2.36 | | | -2.36 |
| United Airlines | short | 5/04/20 | 5/18/20 | 14 | 24.39 | 23.40 | 25.43 | 1.04 | 4.26 | | | |
| | short | 5/25/20 | 6/01/20 | 7 | 24.65 | 28.30 | 21.01 | -3.65 | -14.80 | | | |
| | short | 6/22/20 | 7/06/20 | 14 | 34.61 | 33.14 | 36.15 | 1.54 | 4.44 | | | -7.23 |
| Chevron | short | 8/24/15 | 8/31/15 | 7 | 67.14 | 78.35 | 55.92 | -11.22 | -16.71 | | | |
| | long | 6/27/22 | 9/26/22 | 91 | 140.88 | 140.22 | | -0.66 | -0.47 | | | -17.09 |
| JetBlue Airways | long | 8/31/15 | 3/16/20 | 1659 | 21.59 | 10.04 | | -11.55 | -53.49 | | | |
| | short | 6/20/22 | 6/27/22 | 7 | 8.26 | 8.36 | 8.15 | -0.11 | -1.28 | | | |
| | short | 9/26/22 | 10/17/22 | 21 | 6.60 | 6.82 | 6.37 | -0.22 | -3.40 | | | -55.64 |
Annotations
| 3/14/24 | DJCA | | | Component update: Uber Technologies replaces JetBlue Airways |
| 2/26/24 | Walmart | | | stock split 1:3 (three for one) |
| 8/22/23 | Sempra | | | stock split 1:2 (two for one) |
| 6/29/21 | CSX | | | stock split 1:3 (three for one) |
| 12/24/15 | Nike | | | stock split 1:2 (two for one) |
| 10/15/15 | DJCA | | | American Airlines replaces Con-Way |
| 3/19/15 | Visa | | | forward stock split 1:4 (four for one) |
| 3/18/15 | DJIA | | | Apple replaces AT&T |
|
|