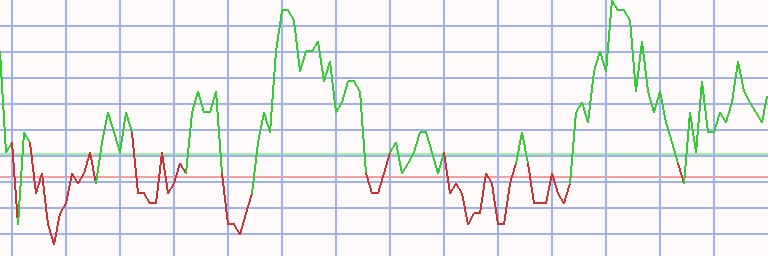
Auswertung - OMX Helsinki 25 in Yen - 1.07.24 - RS = 9
⇐
⇓ jüngster
⇓ 1.07.24
⇓ 29.04.24
K-Diff
⇓
∅-RS
OMXH 25
766.231,063
12.08.24
0,07
789.532,323
-2,95
747.954,438
41.577,885
5,56
11,62
L
Cargotec
7.913,243
12.08.24
0,57
8.172,339
-3,17
10.641,679
-2.469,340
-23,20
0,45
L
Wärtsilä
3.113,478
12.08.24
0,53
3.133,409
-0,64
2.890,488
242,921
8,40
52,64
Konecranes
10.433,142
12.08.24
-1,55
9.427,955
10,66
8.228,896
1.199,059
14,57
52,07
L
Qt
15.875,013
12.08.24
3,44
13.847,309
14,64
12.540,784
1.306,525
10,42
31,44
L
Fortum
2.467,039
12.08.24
1,24
2.429,778
1,53
2.068,100
361,678
17,49
23,20
L
Telia Company
463,772
12.08.24
-0,26
438,296
5,81
368,443
69,853
18,96
27,44
L
Kone
8.102,149
12.08.24
-0,32
8.006,830
1,19
7.743,662
263,167
3,40
13,90
L
Nordea Bank
1.805,869
12.08.24
-0,19
1.978,311
-8,72
1.832,176
146,135
7,98
15,63
L
Valmet
4.256,444
12.08.24
-0,53
4.684,515
-9,14
3.972,224
712,291
17,93
20,72
Huhtamäki
6.180,163
12.08.24
-0,34
6.547,576
-5,61
6.057,056
490,520
8,10
19,23
UPM-Kymmene
5.152,447
12.08.24
0,17
5.693,168
-9,50
5.531,665
161,502
2,92
12,35
Stora Enso
1.867,394
12.08.24
0,14
2.233,940
-16,41
2.109,094
124,846
5,92
17,36
Metso
1.501,887
12.08.24
0,65
1.748,678
-14,11
1.807,914
-59,236
-3,28
8,76
L
Orion
7.592,623
12.08.24
-0,68
7.181,884
5,72
6.078,808
1.103,075
18,15
20,34
L
Nokia
609,611
12.08.24
1,05
635,954
-4,14
576,341
59,613
10,34
17,25
Metsä Board
1.057,179
12.08.24
-0,65
1.283,346
-17,62
1.149,502
133,844
11,64
10,25
L
Elisa
7.528,500
12.08.24
0,37
7.462,642
0,88
7.151,342
311,300
4,35
7,08
Sampo
7.017,241
12.08.24
0,40
6.963,515
0,77
6.425,165
538,351
8,38
9,30
Kesko
2.978,298
12.08.24
-0,20
2.877,779
3,49
2.703,087
174,692
6,46
4,27
S
Kojamo
1.660,291
12.08.24
-1,44
1.678,488
-1,08
1.780,306
-101,818
-5,72
8,28
S
Nokian Tyres
1.383,344
12.08.24
-0,84
1.360,468
1,68
1.441,981
-81,513
-5,65
3,55
TietoEVRY
3.124,743
12.08.24
-0,44
3.185,401
-1,90
3.010,123
175,278
5,82
-5,12
Outokumpu
561,865
12.08.24
0,31
586,821
-4,25
641,847
-55,026
-8,57
-10,67
S
Neste
3.155,072
12.08.24
-1,54
2.921,973
7,98
3.607,462
-685,489
-19,00
-36,93
⇓ jüngster
⇓ 1.07.24
⇓ 29.04.24
K-Diff
⇓
∅-RS
Mandatum
731,360
12.08.24
732,573
-0,17
763,992
-31,419
-4,11
-nv-
OMXH 25 - 25 von 25 Wertpapieren bewertet - 1.07.24 / 29.04.24 - 18 davon sind besser, Markt-Kennzahl(9) in JPY = 72,00 % Börsenplatz-Währung: EUR € Euro
Technischer Chart
Transaktionen OMX Helsinki 25 in Yen * S9 - 31/40 (1)
⇐ L/S K-Datum V-Datum Tage Wertpapier Spl Stück K-Kurs V-Kurs S-V-Kurs K-Diff D % Kapital Rdte
2.01.06 15.05.06 133 - cash -
short
15.05.06
17.07.06
63
TietoEVRY
100
3
2.790,749
2.493,063
3.123,980
333,232
12
11.000
92
17.07.06 13.08.07 392 - cash -
13.08.07
17.09.07
35
TietoEVRY
100
4
2.336,293
2.322,616
2.350,051
13,758
1
11.055
6
17.09.07 3.12.07 77 - cash -
3.12.07
17.03.08
105
YIT
100
4
2.624,175
2.475,004
2.782,337
158,162
6
11.687
23
17.03.08 9.06.08 84 - cash -
9.06.08
25.08.08
77
Kesko
100
12
956,051
842,186
1.085,311
129,259
14
13.238
82
25.08.08 22.09.08 28 - cash -
22.09.08
19.01.09
119
YIT
100
10
1.257,671
545,820
2.897,912
1.640,240
130
29.641
1.194
19.01.09 9.03.09 49 - cash -
9.03.09
16.03.09
7
Stora Enso
100
72
407,868
371,085
448,298
40,430
10
32.552
13.713
16.03.09 6.07.09 112 - cash -
6.07.09
13.07.09
7
Stora Enso
100
69
468,567
504,429
432,706
-35,862
-8
30.077
-98
13.07.09 17.05.10 308 - cash -
17.05.10
21.06.10
35
Nokia
100
32
937,910
789,961
1.113,569
175,658
19
35.698
499
21.06.10 28.06.10 7 - cash -
28.06.10
5.07.10
7
Nokia
100
49
728,442
734,198
722,686
-5,756
-1
35.416
-34
5.07.10 7.03.11 245 - cash -
7.03.11
21.03.11
14
Nokia
100
50
703,505
678,036
729,931
26,426
4
36.738
162
21.03.11 6.06.11 77 - cash -
6.06.11
3.10.11
119
Nokia
100
72
505,121
454,671
561,169
56,048
11
40.773
38
3.10.11 12.12.11 70 - cash -
12.12.11
19.12.11
7
Outokumpu
100
33
1.221,629
1.106,710
1.348,480
126,851
10
44.959
17.166
19.12.11 26.12.11 7 - cash -
26.12.11
9.01.12
14
Outokumpu
100
38
1.176,714
1.224,229
1.129,199
-47,515
-4
43.154
-66
9.01.12 9.04.12 91 - cash -
9.04.12
9.07.12
91
Outokumpu
100
34
1.242,178
594,010
2.597,609
1.355,431
109
89.238
1.828
9.07.12 15.04.13 280 - cash -
15.04.13
29.04.13
14
Outokumpu
100
155
575,518
588,881
562,155
-13,363
-2
87.167
-46
29.04.13 24.06.13 56 - cash -
24.06.13
5.08.13
42
Outokumpu
100
158
549,809
542,933
556,772
6,963
1
88.267
12
5.08.13 4.08.14 364 - cash -
4.08.14
17.11.14
105
Nokian Tyres
100
24
3.587,833
3.171,135
4.059,286
471,453
13
99.582
54
17.11.14 15.06.15 210 - cash -
15.06.15
20.07.15
35
Outokumpu
100
147
677,361
532,177
862,152
184,792
27
126.746
1.137
20.07.15 27.07.15 7 - cash -
27.07.15
3.08.15
7
Outokumpu
100
235
538,662
560,184
517,141
-21,521
-4
121.689
-88
3.08.15 24.08.15 21 - cash -
24.08.15
26.10.15
63
Outokumpu
100
261
466,115
469,480
462,750
-3,365
-1
120.811
-4
26.10.15 11.01.16 77 - cash -
11.01.16
14.03.16
63
Outokumpu
100
381
316,646
471,089
162,203
-154,443
-49
61.968
-98
14.03.16 9.05.16 56 - cash -
9.05.16
30.05.16
21
Nordea Bank
100
61
1.011,003
1.094,436
927,569
-83,434
-8
56.878
-78
30.05.16 31.07.17 427 - cash -
31.07.17
25.09.17
56
Huhtamäki
100
13
4.274,600
4.579,941
3.969,259
-305,341
-7
52.909
-38
25.09.17 25.12.17 91 - cash -
25.12.17
8.01.18
14
Orion
100
12
4.078,691
4.369,808
3.787,574
-291,117
-7
49.415
-85
8.01.18 8.10.18 273 - cash -
8.10.18
17.12.18
70
Metso
100
74
659,496
390,580
1.113,564
454,067
69
83.016
1.436
L/S K-Datum V-Datum Tage Wertpapier Spl Stück K-Kurs V-Kurs S-V-Kurs K-Diff D % Kapital Rdte
17.12.18 13.05.19 147 - cash -
13.05.19
1.07.19
49
Metsä Board
100
150
552,258
580,754
523,762
-28,496
-5
78.742
-33
1.07.19 2.03.20 245 - cash -
2.03.20
11.05.20
70
Wärtsilä
100
69
1.131,902
771,414
1.660,849
528,947
47
115.239
638
11.05.20 27.09.21 504 - cash -
27.09.21
22.11.21
56
Kone
100
14
8.005,187
7.949,060
8.061,710
56,523
1
116.031
5
22.11.21 24.01.22 63 - cash -
24.01.22
31.01.22
7
Neste
100
22
5.059,940
5.136,574
4.983,305
-76,634
-2
114.345
-55
31.01.22 14.02.22 14 - cash -
14.02.22
30.05.22
105
Neste
100
23
4.915,532
5.972,103
3.858,960
-1.056,571
-21
90.044
-57
30.05.22 13.06.22 14 - cash -
13.06.22
15.08.22
63
Nokian Tyres
100
58
1.539,237
1.479,791
1.601,072
61,834
4
93.630
26
15.08.22 26.09.22 42 - cash -
26.09.22
31.10.22
35
Qt
100
17
5.454,068
6.356,884
4.551,253
-902,816
-17
78.282
-85
31.10.22 20.03.23 140 - cash -
20.03.23
17.04.23
28
Nokian Tyres
100
70
1.113,741
1.290,773
936,709
-177,032
-16
65.890
-90
17.04.23 19.06.23 63 - cash -
19.06.23
11.09.23
84
Kojamo
100
44
1.468,860
1.420,127
1.519,265
50,405
3
68.108
16
11.09.23 25.09.23 14 - cash -
25.09.23
13.11.23
49
Kojamo
100
49
1.362,443
1.511,648
1.213,239
-149,205
-11
60.797
-58
13.11.23 18.03.24 126 - cash -
18.03.24
25.03.24
7
Neste
100
15
4.035,145
4.214,501
3.855,789
-179,356
-4
58.106
-91
25.03.24 8.11.26 958 - cash -
kum 15.05.06
25.03.24 1743
Tage von 7615 investiert (23%)
481
58.106
45
Anteil der Einzelwerte
Wertpapier L/S K-Datum V-Datum Tage K-Kurs V-Kurs S-V-Kurs K-Diff D % Summe YIT short 3.12.07 17.03.08 105 2.624,17 2.475,00 2.782,34 158,16 6,03 22.09.08 19.01.09 119 1.257,67 545,82 2.897,91 1.640,24 130,42 144,31 Metso 8.10.18 17.12.18 70 659,50 390,58 1.113,56 454,07 68,85 68,85 Wärtsilä 2.03.20 11.05.20 70 1.131,90 771,41 1.660,85 528,95 46,73 46,73 Outokumpu 12.12.11 19.12.11 7 1.221,63 1.106,71 1.348,48 126,85 10,38 26.12.11 9.01.12 14 1.176,71 1.224,23 1.129,20 -47,51 -4,04 9.04.12 9.07.12 91 1.242,18 594,01 2.597,61 1.355,43 109,12 15.04.13 29.04.13 14 575,52 588,88 562,16 -13,36 -2,32 24.06.13 5.08.13 42 549,81 542,93 556,77 6,96 1,27 15.06.15 20.07.15 35 677,36 532,18 862,15 184,79 27,28 27.07.15 3.08.15 7 538,66 560,18 517,14 -21,52 -4,00 24.08.15 26.10.15 63 466,11 469,48 462,75 -3,37 -0,72 11.01.16 14.03.16 63 316,65 471,09 162,20 -154,44 -48,77 36,16 Nokia 17.05.10 21.06.10 35 937,91 789,96 1.113,57 175,66 18,73 28.06.10 5.07.10 7 728,44 734,20 722,69 -5,76 -0,79 7.03.11 21.03.11 14 703,51 678,04 729,93 26,43 3,76 6.06.11 3.10.11 119 505,12 454,67 561,17 56,05 11,10 35,78 Kesko 9.06.08 25.08.08 77 956,05 842,19 1.085,31 129,26 13,52 13,52 TietoEVRY 15.05.06 17.07.06 63 2.790,75 2.493,06 3.123,98 333,23 11,94 13.08.07 17.09.07 35 2.336,29 2.322,62 2.350,05 13,76 0,59 12,60 Stora Enso 9.03.09 16.03.09 7 407,87 371,08 448,30 40,43 9,91 6.07.09 13.07.09 7 468,57 504,43 432,71 -35,86 -7,65 1,50 Kone 27.09.21 22.11.21 56 8.005,19 7.949,06 8.061,71 56,52 0,71 0,71 Nokian Tyres 4.08.14 17.11.14 105 3.587,83 3.171,13 4.059,29 471,45 13,14 13.06.22 15.08.22 63 1.539,24 1.479,79 1.601,07 61,83 4,02 20.03.23 17.04.23 28 1.113,74 1.290,77 936,71 -177,03 -15,90 -1,02 Wertpapier L/S K-Datum V-Datum Tage K-Kurs V-Kurs S-V-Kurs K-Diff D % Summe Metsä Board 13.05.19 1.07.19 49 552,26 580,75 523,76 -28,50 -5,16 -5,16 Orion 25.12.17 8.01.18 14 4.078,69 4.369,81 3.787,57 -291,12 -7,14 -7,14 Huhtamäki 31.07.17 25.09.17 56 4.274,60 4.579,94 3.969,26 -305,34 -7,14 -7,14 Kojamo 19.06.23 11.09.23 84 1.468,86 1.420,13 1.519,26 50,41 3,43 25.09.23 13.11.23 49 1.362,44 1.511,65 1.213,24 -149,20 -10,95 -7,90 Nordea Bank 9.05.16 30.05.16 21 1.011,00 1.094,44 927,57 -83,43 -8,25 -8,25 Qt 26.09.22 31.10.22 35 5.454,07 6.356,88 4.551,25 -902,82 -16,55 -16,55 Neste 24.01.22 31.01.22 7 5.059,94 5.136,57 4.983,31 -76,63 -1,51 14.02.22 30.05.22 105 4.915,53 5.972,10 3.858,96 -1.056,57 -21,49 18.03.24 25.03.24 7 4.035,14 4.214,50 3.855,79 -179,36 -4,44 -26,12
Anmerkungen
19.02.24 OMXH 25 Komponenten-Aktualisierung: Mandatum und Metsä Board ersetzen SSAB und Tokmanni 1.04.22 Valmet Fusion mit Neles 29.04.20 Kesko Aktien-Split 1:4 (vier für eine) 3.04.19 Neste Oil Aktien-Split 1:3 (drei für eine) 9.03.18 Wärtsilä Aktiensplit 1:3 (drei für eine) 17.12.16 OMXH 25 Die Kursdaten-Börse wurde von Frankfurt auf Helsinki umgestellt, OMXH 25 Index-Anpassung: Metsä Board ersetzt Kemira 17.09.15 OMXH 25 vollständige Analyse
Anmerkung verfassen