| | |
| | |

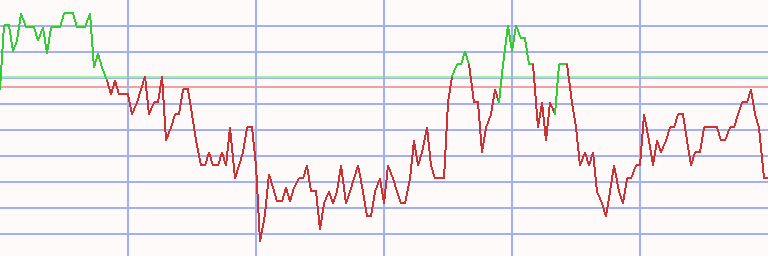
Assessment - CAC Next 20 - 7/01/24 - RS = 30
⇐
| |
|
⇓instrument |
freshest |
⇓ Δday |
7/01/24 |
⇓ Δwk |
12/04/23 |
prc diff |
⇓ Δ30 |
|
∅-RS |
| |  |
 |
 |
|
|
 |
CAC Next 20 |
17,034.800 |
8/12/24 |
-0.27 |
17,020.200 |
0.09 |
17,101.500 |
-81.300 |
-0.48 |
|
-1.75 |
| | |
|
|
|
|
|
Euronext |
92.550 |
8/12/24 |
1.26 |
88.900 |
4.11 |
76.850 |
12.050 |
15.68 |
|
19.35 |
| | |
|
|
|
L |
|
Sodexo |
86.300 |
8/12/24 |
0.52 |
85.700 |
0.70 |
72.860 |
12.840 |
17.62 |
|
12.88 |
| | |
|
|
|
L |
|
Klépierre |
26.320 |
8/12/24 |
-0.45 |
25.200 |
4.44 |
23.300 |
1.900 |
8.15 |
|
7.39 |
| | |
|
|
|
|
|
Bureau Veritas |
27.960 |
8/12/24 |
-0.50 |
26.400 |
5.91 |
22.040 |
4.360 |
19.78 |
|
7.24 |
| | |
|
|
|
|
|
Rexel |
21.840 |
8/12/24 |
-1.22 |
24.400 |
-10.49 |
22.140 |
2.260 |
10.21 |
|
6.72 |
| | |
|
|
|
|
|
Accor |
33.570 |
8/12/24 |
-0.74 |
38.190 |
-12.10 |
32.860 |
5.330 |
16.22 |
|
5.40 |
| | |
|
|
|
|
|
Getlink |
15.905 |
8/12/24 |
-0.03 |
15.515 |
2.51 |
16.915 |
-1.400 |
-8.28 |
|
-2.59 |
| | |
|
|
|
S |
|
bioMérieux |
96.650 |
8/12/24 |
-0.67 |
89.700 |
7.75 |
100.850 |
-11.150 |
-11.06 |
|
-5.87 |
| | |
|
|
|
|
|
Gecina |
93.100 |
8/12/24 |
-0.64 |
88.450 |
5.26 |
105.100 |
-16.650 |
-15.84 |
|
-6.74 |
| | |
|
|
|
S |
|
Eiffage |
90.040 |
8/12/24 |
-0.60 |
88.600 |
1.63 |
93.540 |
-4.940 |
-5.28 |
|
-9.38 |
| | |
|
|
|
S |
|
Arkema |
77.950 |
8/12/24 |
-1.39 |
81.600 |
-4.47 |
91.880 |
-10.280 |
-11.19 |
|
-10.40 |
| | |
|
|
|
L |
|
Ubisoft |
17.130 |
8/12/24 |
1.36 |
20.470 |
-16.32 |
25.020 |
-4.550 |
-18.19 |
|
-12.89 |
| | |
|
|
|
|
|
Soitec |
106.100 |
8/12/24 |
0.66 |
104.300 |
1.73 |
153.000 |
-48.700 |
-31.83 |
|
-20.13 |
| | |
|
|
|
|
|
Air France-KLM |
7.656 |
8/12/24 |
-0.44 |
8.100 |
-5.48 |
12.136 |
-4.036 |
-33.26 |
|
-21.01 |
| | |
|
|
|
S |
|
Sartorius Stedim |
172.300 |
8/12/24 |
-1.54 |
146.700 |
17.45 |
200.600 |
-53.900 |
-26.87 |
|
-23.43 |
| | |
|
|
|
L |
|
Solvay |
30.590 |
8/12/24 |
-1.83 |
33.490 |
-8.66 |
109.300 |
-75.810 |
-69.36 |
|
-23.94 |
| | |
|
|
|
|
|
Rémy Cointreau |
69.550 |
8/12/24 |
-2.25 |
77.600 |
-10.37 |
108.100 |
-30.500 |
-28.21 |
|
-26.74 |
| | |
|
|
|
|
|
Valeo |
9.400 |
8/12/24 |
-0.95 |
10.045 |
-6.42 |
12.850 |
-2.805 |
-21.83 |
|
-28.87 |
| | |
|
|
|
|
|
Forvia |
9.166 |
8/12/24 |
0.17 |
11.500 |
-20.30 |
18.280 |
-6.780 |
-37.09 |
|
-29.56 |
| | |
|
|
|
L |
|
Worldline |
7.808 |
8/12/24 |
-0.79 |
10.425 |
-25.10 |
15.105 |
-4.680 |
-30.98 |
|
-34.26 |
| | |
|
|
|
|
|
Pluxee |
20.490 |
8/12/24 |
2.35 |
26.970 |
-24.03 |
|
|
|
|
-na- |
| CAC Next 20 - 20 out of 21 instruments rated - 7/01/24 / 12/04/23 - 6 did rise, Market-Ratio(30) = 30.00 % |
| Stock Exchange Currency: EUR € Euro |
Technical Chart
Transactions CAC Next 20 * L30 - 70/66 (2)
|
⇐ |
| |
| L/S | date buy | date sell | days | | instrument | spl | pieces | | prc buy | prc sell | | prc diff | d % | asset | yield | |
| 1/02/06 |
12/11/06 |
343 |
|
- cash - |
| long |
12/11/06 |
7/30/07 |
231 |
|
|
|
EDF |
50 |
95 |
|
52.300 |
72.820 |
|
20.520 |
39 |
11,949 |
69 |
|
| |
|
|
|
|
|
|
Hermes International |
50 |
57 |
|
87.000 |
71.960 |
|
-15.040 |
-17 |
11,092 |
-26 |
|
| 100 |
11 |
18 | |
| 7/30/07 |
8/18/08 |
385 |
|
- cash - |
| |
8/18/08 |
9/01/08 |
14 |
|
|
|
Gemalto |
50 |
214 |
|
25.800 |
29.130 |
|
3.330 |
13 |
11,805 |
2,269 |
|
| |
|
|
|
|
|
|
Hermes International |
50 |
55 |
|
99.820 |
96.260 |
|
-3.560 |
-4 |
11,609 |
-61 |
|
| 100 |
5 |
231 | |
| 9/01/08 |
5/25/09 |
266 |
|
- cash - |
| |
5/25/09 |
6/01/09 |
7 |
|
|
|
Gemalto |
50 |
238 |
|
24.290 |
24.130 |
|
-0.160 |
-1 |
11,571 |
-29 |
|
| |
|
|
|
|
|
|
Iliad |
50 |
77 |
|
75.325 |
79.125 |
|
3.800 |
5 |
11,863 |
1,202 |
|
| 100 |
2 |
211 | |
| 6/01/09 |
8/24/09 |
84 |
|
- cash - |
| |
8/24/09 |
5/10/10 |
259 |
|
|
|
Arkema |
50 |
251 |
|
23.614 |
29.058 |
|
5.444 |
23 |
13,230 |
34 |
|
| |
|
|
|
|
|
|
Natixis |
50 |
2,570 |
|
2.309 |
3.781 |
|
1.472 |
64 |
17,013 |
100 |
|
| 100 |
43 |
66 | |
| 5/10/10 |
12/06/10 |
210 |
|
- cash - |
| |
12/06/10 |
7/18/11 |
224 |
|
|
|
Arkema |
50 |
164 |
|
51.621 |
64.400 |
|
12.779 |
25 |
19,109 |
43 |
|
| |
|
|
|
|
|
|
Ingenico |
50 |
342 |
|
24.950 |
32.265 |
|
7.315 |
29 |
21,610 |
52 |
|
| 100 |
27 |
48 | |
| 7/18/11 |
3/05/12 |
231 |
|
- cash - |
| |
3/05/12 |
5/28/12 |
84 |
|
|
|
Gemalto |
50 |
249 |
|
43.235 |
49.925 |
|
6.690 |
15 |
23,276 |
87 |
|
| |
|
|
|
|
|
|
Hermes International |
50 |
38 |
|
282.200 |
266.200 |
|
-16.000 |
-6 |
22,668 |
-22 |
|
| 100 |
5 |
23 | |
| 5/28/12 |
6/11/12 |
14 |
|
- cash - |
| |
6/11/12 |
9/03/12 |
84 |
|
|
|
Gemalto |
50 |
217 |
|
52.210 |
64.240 |
|
12.030 |
23 |
25,279 |
146 |
|
| |
|
|
|
|
|
|
Zodiac Aerospace |
50 |
724 |
|
15.656 |
15.500 |
|
-0.156 |
-1 |
25,166 |
-4 |
|
| 100 |
11 |
57 | |
| 9/03/12 |
9/10/12 |
7 |
|
- cash - |
| |
9/10/12 |
9/17/12 |
7 |
|
|
|
Gemalto |
50 |
199 |
|
62.980 |
68.330 |
|
5.350 |
8 |
26,230 |
6,920 |
|
| |
|
|
|
|
|
|
Ingenico |
50 |
298 |
|
42.335 |
39.835 |
|
-2.500 |
-6 |
25,485 |
-96 |
|
| 100 |
1 |
93 | |
| L/S | date buy | date sell | days | | instrument | spl | pieces | | prc buy | prc sell | | prc diff | d % | asset | yield | |
| 9/17/12 |
11/05/12 |
49 |
|
- cash - |
| |
11/05/12 |
11/12/12 |
7 |
|
|
|
Gemalto |
50 |
183 |
|
69.530 |
69.080 |
|
-0.450 |
-1 |
25,403 |
-29 |
|
| |
|
|
|
|
|
|
Bureau Veritas |
50 |
616 |
|
20.702 |
20.650 |
|
-0.052 |
0 |
25,371 |
-12 |
|
| 100 |
0 |
-21 | |
| 11/12/12 |
12/03/12 |
21 |
|
- cash - |
| |
12/03/12 |
6/24/13 |
203 |
|
|
|
Gemalto |
50 |
178 |
|
71.260 |
64.130 |
|
-7.130 |
-10 |
24,102 |
-17 |
|
| |
|
|
|
|
|
|
Iliad |
50 |
93 |
|
136.000 |
159.050 |
|
23.050 |
17 |
26,246 |
33 |
|
| 100 |
3 |
6 | |
| 6/24/13 |
7/01/13 |
7 |
|
- cash - |
| |
7/01/13 |
9/16/13 |
77 |
|
|
|
STMicroelectronics |
50 |
1,887 |
|
6.951 |
7.122 |
|
0.171 |
2 |
26,568 |
12 |
|
| |
|
|
|
|
|
|
Iliad |
50 |
77 |
|
168.400 |
177.450 |
|
9.050 |
5 |
27,265 |
28 |
|
| 100 |
4 |
20 | |
| 9/16/13 |
9/30/13 |
14 |
|
- cash - |
| |
9/30/13 |
10/28/13 |
28 |
|
|
|
EDF |
50 |
583 |
|
23.380 |
25.570 |
|
2.190 |
9 |
28,542 |
221 |
|
| |
|
|
|
|
|
|
Thales |
50 |
335 |
|
40.635 |
44.085 |
|
3.450 |
8 |
29,698 |
189 |
|
| 100 |
9 |
205 | |
| 10/28/13 |
11/04/13 |
7 |
|
- cash - |
| |
11/04/13 |
11/25/13 |
21 |
|
|
|
EDF |
50 |
567 |
|
26.175 |
26.830 |
|
0.655 |
3 |
30,069 |
54 |
|
| |
|
|
|
|
|
|
Thales |
50 |
330 |
|
44.930 |
44.235 |
|
-0.695 |
-2 |
29,840 |
-24 |
|
| 100 |
0 |
9 | |
| 11/25/13 |
1/13/14 |
49 |
|
- cash - |
| |
1/13/14 |
3/03/14 |
49 |
|
|
|
EDF |
50 |
597 |
|
24.980 |
28.490 |
|
3.510 |
14 |
31,935 |
166 |
|
| |
|
|
|
|
|
|
Natixis |
50 |
3,153 |
|
4.734 |
4.990 |
|
0.256 |
5 |
32,742 |
48 |
|
| 100 |
10 |
100 | |
| 3/03/14 |
3/10/14 |
7 |
|
- cash - |
| |
3/10/14 |
3/17/14 |
7 |
|
|
|
EDF |
50 |
566 |
|
28.880 |
28.590 |
|
-0.290 |
-1 |
32,578 |
-41 |
|
| |
|
|
|
|
|
|
Natixis |
50 |
3,189 |
|
5.141 |
4.963 |
|
-0.178 |
-3 |
32,011 |
-84 |
|
| 100 |
-2 |
-69 | |
| 3/17/14 |
3/24/14 |
7 |
|
- cash - |
| |
3/24/14 |
6/16/14 |
84 |
|
|
|
Natixis |
50 |
3,115 |
|
5.138 |
4.970 |
|
-0.168 |
-3 |
31,487 |
-13 |
|
| |
|
|
|
|
|
|
Getlink |
50 |
1,799 |
|
8.894 |
9.616 |
|
0.722 |
8 |
32,786 |
40 |
|
| 100 |
2 |
11 | |
| L/S | date buy | date sell | days | | instrument | spl | pieces | | prc buy | prc sell | | prc diff | d % | asset | yield | |
| 6/16/14 |
1/26/15 |
224 |
|
- cash - |
| |
1/26/15 |
8/17/15 |
203 |
|
|
|
Getlink |
50 |
1,366 |
|
11.995 |
13.045 |
|
1.050 |
9 |
34,220 |
16 |
|
| |
|
|
|
|
|
|
Ingenico |
50 |
176 |
|
92.860 |
124.500 |
|
31.640 |
34 |
39,789 |
69 |
|
| 100 |
21 |
42 | |
| 8/17/15 |
1/23/17 |
525 |
|
- cash - |
| |
1/23/17 |
1/30/17 |
7 |
|
|
|
STMicroelectronics |
50 |
1,847 |
|
10.770 |
12.495 |
|
1.725 |
16 |
42,975 |
231,259 |
|
| |
|
|
|
|
|
|
Zodiac Aerospace |
50 |
693 |
|
28.700 |
28.125 |
|
-0.575 |
-2 |
42,577 |
-65 |
|
| 100 |
7 |
3,317 | |
| 1/30/17 |
2/20/17 |
21 |
|
- cash - |
| |
2/20/17 |
2/27/17 |
7 |
|
|
|
STMicroelectronics |
50 |
1,567 |
|
13.585 |
14.490 |
|
0.905 |
7 |
43,995 |
2,787 |
|
| |
|
|
|
|
|
|
Zodiac Aerospace |
50 |
790 |
|
26.935 |
27.405 |
|
0.470 |
2 |
44,366 |
146 |
|
| 100 |
4 |
756 | |
| 2/27/17 |
3/20/17 |
21 |
|
- cash - |
| |
3/20/17 |
11/13/17 |
238 |
|
|
|
STMicroelectronics |
50 |
1,547 |
|
14.335 |
20.375 |
|
6.040 |
42 |
53,710 |
71 |
|
| |
|
|
|
|
|
|
Natixis |
50 |
3,939 |
|
5.632 |
6.513 |
|
0.881 |
16 |
57,180 |
25 |
|
| 100 |
29 |
48 | |
| 11/13/17 |
1/29/18 |
77 |
|
- cash - |
| |
1/29/18 |
2/05/18 |
7 |
|
|
|
EDF |
50 |
2,542 |
|
11.245 |
10.485 |
|
-0.760 |
-7 |
55,248 |
-97 |
|
| |
|
|
|
|
|
|
Eiffage |
50 |
294 |
|
97.220 |
94.080 |
|
-3.140 |
-3 |
54,325 |
-82 |
|
| 100 |
-5 |
-93 | |
| 2/05/18 |
3/12/18 |
35 |
|
- cash - |
| |
3/12/18 |
5/28/18 |
77 |
|
|
|
Dassault Systèmes |
50 |
1,223 |
|
22.200 |
23.200 |
|
1.000 |
5 |
55,548 |
23 |
|
| |
|
|
|
|
|
|
Edenred |
50 |
933 |
|
29.110 |
27.990 |
|
-1.120 |
-4 |
54,503 |
-17 |
|
| 100 |
0 |
2 | |
| 5/28/18 |
7/08/19 |
406 |
|
- cash - |
| |
7/08/19 |
8/05/19 |
28 |
|
|
|
Edenred |
50 |
604 |
|
45.060 |
43.900 |
|
-1.160 |
-3 |
53,803 |
-29 |
|
| |
|
|
|
|
|
|
Ingenico |
50 |
363 |
|
75.140 |
82.820 |
|
7.680 |
10 |
56,590 |
256 |
|
| 100 |
4 |
63 | |
| 8/05/19 |
12/09/19 |
126 |
|
- cash - |
| |
12/09/19 |
2/24/20 |
77 |
|
|
|
Ingenico |
50 |
297 |
|
95.000 |
135.800 |
|
40.800 |
43 |
68,708 |
444 |
|
| |
|
|
|
|
|
|
Teleperformance |
50 |
133 |
|
212.400 |
236.000 |
|
23.600 |
11 |
71,847 |
65 |
|
| 100 |
27 |
211 | |
| L/S | date buy | date sell | days | | instrument | spl | pieces | | prc buy | prc sell | | prc diff | d % | asset | yield | |
| 2/24/20 |
10/12/20 |
231 |
|
- cash - |
| |
10/12/20 |
11/02/20 |
21 |
|
|
|
Suez Environnement |
50 |
2,262 |
|
15.875 |
15.750 |
|
-0.125 |
-1 |
71,564 |
-13 |
|
| |
|
|
|
|
|
|
Ubisoft |
50 |
432 |
|
83.020 |
75.240 |
|
-7.780 |
-9 |
68,203 |
-82 |
|
| 100 |
-5 |
-60 | |
| 11/02/20 |
11/09/20 |
7 |
|
- cash - |
| |
11/09/20 |
1/04/21 |
56 |
|
|
|
Suez Environnement |
50 |
2,116 |
|
16.115 |
16.345 |
|
0.230 |
1 |
68,690 |
10 |
|
| |
|
|
|
|
|
|
Sartorius Stedim |
50 |
106 |
|
320.200 |
302.400 |
|
-17.800 |
-6 |
66,803 |
-31 |
|
| 100 |
-2 |
-13 | |
| 1/04/21 |
1/11/21 |
7 |
|
- cash - |
| |
1/11/21 |
7/05/21 |
175 |
|
|
|
EDF |
50 |
2,489 |
|
13.415 |
11.900 |
|
-1.515 |
-11 |
63,032 |
-22 |
|
| |
|
|
|
|
|
|
Suez Environnement |
50 |
2,003 |
|
16.680 |
20.090 |
|
3.410 |
20 |
69,862 |
47 |
|
| 100 |
5 |
10 | |
| 7/05/21 |
1/23/23 |
567 |
|
- cash - |
| |
1/23/23 |
2/27/23 |
35 |
|
|
|
EDF |
50 |
2,910 |
|
12.000 |
11.825 |
|
-0.175 |
-1 |
69,353 |
-14 |
|
| |
|
|
|
|
|
|
Sodexo |
50 |
528 |
|
66.100 |
64.660 |
|
-1.440 |
-2 |
68,593 |
-21 |
|
| 100 |
-2 |
-17 | |
| 2/27/23 |
4/17/23 |
49 |
|
- cash - |
| |
4/17/23 |
6/12/23 |
56 |
|
|
|
Sodexo |
50 |
473 |
|
72.480 |
74.170 |
|
1.690 |
2 |
69,392 |
16 |
|
| |
|
|
|
|
|
|
Forvia |
50 |
1,621 |
|
21.160 |
22.220 |
|
1.060 |
5 |
71,110 |
38 |
|
| 100 |
4 |
26 | |
| 6/12/23 |
7/17/23 |
35 |
|
- cash - |
| |
7/17/23 |
8/07/23 |
21 |
|
|
|
Accor |
50 |
1,048 |
|
33.900 |
33.130 |
|
-0.770 |
-2 |
70,303 |
-33 |
|
| |
|
|
|
|
|
|
Forvia |
50 |
1,483 |
|
23.980 |
21.640 |
|
-2.340 |
-10 |
66,833 |
-83 |
|
| 100 |
-6 |
-66 | |
| 8/07/23 |
7/04/25 |
697 |
|
- cash - |
| accum | 12/11/06 |
8/07/23 | 2394 |
days out of 7123 invested (34%) |
568 |
66,833 |
34 |
|
Instrument Related Contribution
| instrument | L/S | date buy | date sell | days | prc buy | prc sell | | prc diff | d % | spl | di % | total |
| Ingenico | long | 12/06/10 | 7/18/11 | 224 | 24.95 | 32.27 | | 7.32 | 29.32 | 50 | 14.66 | |
| | | 9/10/12 | 9/17/12 | 7 | 42.34 | 39.84 | | -2.50 | -5.91 | | -2.95 | |
| | | 1/26/15 | 8/17/15 | 203 | 92.86 | 124.50 | | 31.64 | 34.07 | | 17.04 | |
| | | 7/08/19 | 8/05/19 | 28 | 75.14 | 82.82 | | 7.68 | 10.22 | | 5.11 | |
| | | 12/09/19 | 2/24/20 | 77 | 95.00 | 135.80 | | 40.80 | 42.95 | | 21.47 | 66.28 |
| Natixis | | 8/24/09 | 5/10/10 | 259 | 2.31 | 3.78 | | 1.47 | 63.75 | | 31.88 | |
| | | 1/13/14 | 3/03/14 | 49 | 4.73 | 4.99 | | 0.26 | 5.41 | | 2.70 | |
| | | 3/10/14 | 3/17/14 | 7 | 5.14 | 4.96 | | -0.18 | -3.46 | | -1.73 | |
| | | 3/24/14 | 6/16/14 | 84 | 5.14 | 4.97 | | -0.17 | -3.27 | | -1.63 | |
| | | 3/20/17 | 11/13/17 | 238 | 5.63 | 6.51 | | 0.88 | 15.64 | | 7.82 | 41.16 |
| STMicroelectronics | | 7/01/13 | 9/16/13 | 77 | 6.95 | 7.12 | | 0.17 | 2.46 | | 1.23 | |
| | | 1/23/17 | 1/30/17 | 7 | 10.77 | 12.50 | | 1.73 | 16.02 | | 8.01 | |
| | | 2/20/17 | 2/27/17 | 7 | 13.59 | 14.49 | | 0.90 | 6.66 | | 3.33 | |
| | | 3/20/17 | 11/13/17 | 238 | 14.34 | 20.38 | | 6.04 | 42.13 | | 21.07 | 36.78 |
| Gemalto | | 8/18/08 | 9/01/08 | 14 | 25.80 | 29.13 | | 3.33 | 12.91 | | 6.45 | |
| | | 5/25/09 | 6/01/09 | 7 | 24.29 | 24.13 | | -0.16 | -0.66 | | -0.33 | |
| | | 3/05/12 | 5/28/12 | 84 | 43.24 | 49.93 | | 6.69 | 15.47 | | 7.74 | |
| | | 6/11/12 | 9/03/12 | 84 | 52.21 | 64.24 | | 12.03 | 23.04 | | 11.52 | |
| | | 9/10/12 | 9/17/12 | 7 | 62.98 | 68.33 | | 5.35 | 8.49 | | 4.25 | |
| | | 11/05/12 | 11/12/12 | 7 | 69.53 | 69.08 | | -0.45 | -0.65 | | -0.32 | |
| | | 12/03/12 | 6/24/13 | 203 | 71.26 | 64.13 | | -7.13 | -10.01 | | -5.00 | 25.84 |
| Arkema | | 8/24/09 | 5/10/10 | 259 | 23.61 | 29.06 | | 5.44 | 23.05 | | 11.53 | |
| | | 12/06/10 | 7/18/11 | 224 | 51.62 | 64.40 | | 12.78 | 24.76 | | 12.38 | 25.33 |
| EDF | | 12/11/06 | 7/30/07 | 231 | 52.30 | 72.82 | | 20.52 | 39.24 | | 19.62 | |
| | | 9/30/13 | 10/28/13 | 28 | 23.38 | 25.57 | | 2.19 | 9.37 | | 4.68 | |
| | | 11/04/13 | 11/25/13 | 21 | 26.18 | 26.83 | | 0.65 | 2.50 | | 1.25 | |
| | | 1/13/14 | 3/03/14 | 49 | 24.98 | 28.49 | | 3.51 | 14.05 | | 7.03 | |
| | | 3/10/14 | 3/17/14 | 7 | 28.88 | 28.59 | | -0.29 | -1.00 | | -0.50 | |
| | | 1/29/18 | 2/05/18 | 7 | 11.25 | 10.49 | | -0.76 | -6.76 | | -3.38 | |
| | | 1/11/21 | 7/05/21 | 175 | 13.42 | 11.90 | | -1.52 | -11.29 | | -5.65 | |
| | | 1/23/23 | 2/27/23 | 35 | 12.00 | 11.83 | | -0.18 | -1.46 | | -0.73 | 22.19 |
| instrument | L/S | date buy | date sell | days | prc buy | prc sell | | prc diff | d % | spl | di % | total |
| Iliad | | 5/25/09 | 6/01/09 | 7 | 75.33 | 79.13 | | 3.80 | 5.04 | | 2.52 | |
| | | 12/03/12 | 6/24/13 | 203 | 136.00 | 159.05 | | 23.05 | 16.95 | | 8.47 | |
| | | 7/01/13 | 9/16/13 | 77 | 168.40 | 177.45 | | 9.05 | 5.37 | | 2.69 | 14.20 |
| Suez Environnement | | 10/12/20 | 11/02/20 | 21 | 15.88 | 15.75 | | -0.13 | -0.79 | | -0.39 | |
| | | 11/09/20 | 1/04/21 | 56 | 16.12 | 16.35 | | 0.23 | 1.43 | | 0.71 | |
| | | 1/11/21 | 7/05/21 | 175 | 16.68 | 20.09 | | 3.41 | 20.44 | | 10.22 | 10.57 |
| Getlink | | 3/24/14 | 6/16/14 | 84 | 8.89 | 9.62 | | 0.72 | 8.12 | | 4.06 | |
| | | 1/26/15 | 8/17/15 | 203 | 12.00 | 13.05 | | 1.05 | 8.75 | | 4.38 | 8.61 |
| Teleperformance | | 12/09/19 | 2/24/20 | 77 | 212.40 | 236.00 | | 23.60 | 11.11 | | 5.56 | 5.56 |
| Thales | | 9/30/13 | 10/28/13 | 28 | 40.64 | 44.09 | | 3.45 | 8.49 | | 4.25 | |
| | | 11/04/13 | 11/25/13 | 21 | 44.93 | 44.24 | | -0.70 | -1.55 | | -0.77 | 3.44 |
| Dassault Systèmes | | 3/12/18 | 5/28/18 | 77 | 22.20 | 23.20 | | 1.00 | 4.50 | | 2.25 | 2.25 |
| Sodexo | | 1/23/23 | 2/27/23 | 35 | 66.10 | 64.66 | | -1.44 | -2.18 | | -1.09 | |
| | | 4/17/23 | 6/12/23 | 56 | 72.48 | 74.17 | | 1.69 | 2.33 | | 1.17 | 0.06 |
| Bureau Veritas | | 11/05/12 | 11/12/12 | 7 | 20.70 | 20.65 | | -0.05 | -0.25 | | -0.13 | -0.13 |
| Zodiac Aerospace | | 6/11/12 | 9/03/12 | 84 | 15.66 | 15.50 | | -0.16 | -1.00 | | -0.50 | |
| | | 1/23/17 | 1/30/17 | 7 | 28.70 | 28.13 | | -0.57 | -2.00 | | -1.00 | |
| | | 2/20/17 | 2/27/17 | 7 | 26.94 | 27.41 | | 0.47 | 1.74 | | 0.87 | -0.64 |
| Accor | | 7/17/23 | 8/07/23 | 21 | 33.90 | 33.13 | | -0.77 | -2.27 | | -1.14 | -1.14 |
| Eiffage | | 1/29/18 | 2/05/18 | 7 | 97.22 | 94.08 | | -3.14 | -3.23 | | -1.61 | -1.61 |
| Forvia | | 4/17/23 | 6/12/23 | 56 | 21.16 | 22.22 | | 1.06 | 5.01 | | 2.50 | |
| | | 7/17/23 | 8/07/23 | 21 | 23.98 | 21.64 | | -2.34 | -9.76 | | -4.88 | -2.50 |
| Sartorius Stedim | | 11/09/20 | 1/04/21 | 56 | 320.20 | 302.40 | | -17.80 | -5.56 | | -2.78 | -2.78 |
| Edenred | | 3/12/18 | 5/28/18 | 77 | 29.11 | 27.99 | | -1.12 | -3.85 | | -1.92 | |
| | | 7/08/19 | 8/05/19 | 28 | 45.06 | 43.90 | | -1.16 | -2.57 | | -1.29 | -3.19 |
| instrument | L/S | date buy | date sell | days | prc buy | prc sell | | prc diff | d % | spl | di % | total |
| Ubisoft | | 10/12/20 | 11/02/20 | 21 | 83.02 | 75.24 | | -7.78 | -9.37 | | -4.69 | -4.69 |
| Hermes International | | 12/11/06 | 7/30/07 | 231 | 87.00 | 71.96 | | -15.04 | -17.29 | | -8.64 | |
| | | 8/18/08 | 9/01/08 | 14 | 99.82 | 96.26 | | -3.56 | -3.57 | | -1.78 | |
| | | 3/05/12 | 5/28/12 | 84 | 282.20 | 266.20 | | -16.00 | -5.67 | | -2.83 | -12.82 |
Annotations
| 2/20/24 | CAC Next 20 | | | Component update: Soitec and Worldline replace ADP and Edenred |
| 2/01/24 | CAC Next 20 | | | Sodexo spins Pluxee off |
| 8/31/23 | Air France-KLM | | | reverse split 10:1 (one for ten) |
| 9/20/17 | bioMérieux | | | stock split 1:3 (three for one) |
| 3/20/17 | CAC Next 20 | | | Klépierre replaces Atos |
| 7/15/16 | CAC Next 20 | | | Eiffage replaces Eutelsat |
| 6/06/16 | Valeo | | | stock split 1:3 (three for one) |
| 5/06/16 | Sartorius Stedim | | | stock split 1 : 6 (six for one) |
| 3/21/16 | CAC Next 20 | | | Alstom replaces Sodexo |
| 1/05/16 | CAC Next 20 | | | complete analysis |
| 12/21/15 | Sartorius Stedim | | | recording started |
| | CAC Next 20 | | | EDF and Groupe Eurotunnel replace Klépierre and Vallourec |
| 8/23/15 | CAC Next 20 | | | complete analysis |
| 7/08/15 | CAC Next 20 | | | market adjustment to index: Hermes, Ingenico and Klépierre replace CGG, Eutelsat and Lagardere |
|
|