| | |
| | |

Assessment - BSE Sensex 30 - 7/01/24 - RS = 17
⇐
| |
|
⇓instrument |
freshest |
⇓ Δday |
7/01/24 |
⇓ Δwk |
3/04/24 |
prc diff |
⇓ Δ17 |
|
∅-RS |
| |  |
 |
 |
|
|
 |
BSE Sensex |
79,648.900 |
8/12/24 |
-0.07 |
79,476.200 |
0.22 |
73,872.300 |
5,603.900 |
7.59 |
|
11.19 |
| | |
|
|
|
L |
|
Mahindra & Mahindra |
2,717.650 |
8/12/24 |
-1.15 |
2,875.850 |
-5.50 |
1,921.050 |
954.800 |
49.70 |
|
71.22 |
| | |
|
|
|
L |
|
Power Grid |
341.150 |
8/12/24 |
-1.40 |
329.600 |
3.50 |
294.650 |
34.950 |
11.86 |
|
40.21 |
| | |
|
|
|
L |
|
Bharti Airtel |
1,458.600 |
8/12/24 |
-0.38 |
1,454.000 |
0.32 |
1,133.500 |
320.500 |
28.28 |
|
38.71 |
| | |
|
|
|
|
|
NTPC |
400.850 |
8/12/24 |
-2.39 |
369.750 |
8.41 |
353.850 |
15.900 |
4.49 |
|
36.59 |
| | |
|
|
|
L |
|
Tata Steel |
152.060 |
8/12/24 |
0.16 |
174.070 |
-12.64 |
153.100 |
20.970 |
13.70 |
|
36.02 |
| | |
|
|
|
|
|
Tata Motors |
1,076.150 |
8/12/24 |
0.75 |
1,002.050 |
7.39 |
987.200 |
14.850 |
1.50 |
|
33.28 |
| | |
|
|
|
L |
|
State Bank of India |
812.600 |
8/12/24 |
-1.42 |
841.950 |
-3.49 |
772.050 |
69.900 |
9.05 |
|
29.64 |
| | |
|
|
|
L |
|
UltraTech Cement |
11,302.800 |
8/12/24 |
0.02 |
11,904.700 |
-5.06 |
9,978.400 |
1,926.300 |
19.30 |
|
23.30 |
| | |
|
|
|
|
|
Maruti Suzuki |
12,273.200 |
8/12/24 |
0.40 |
12,108.700 |
1.36 |
11,594.200 |
514.500 |
4.44 |
|
19.59 |
| | |
|
|
|
|
|
Sun Pharma |
1,733.850 |
8/12/24 |
-0.08 |
1,520.100 |
14.06 |
1,552.100 |
-32.000 |
-2.06 |
|
19.15 |
| | |
|
|
|
|
|
Larsen & Toubro |
3,571.950 |
8/12/24 |
-0.56 |
3,526.550 |
1.29 |
3,644.450 |
-117.900 |
-3.24 |
|
17.86 |
| | |
|
|
|
L |
|
Axis Bank |
1,164.300 |
8/12/24 |
1.89 |
1,261.900 |
-7.73 |
1,106.750 |
155.150 |
14.02 |
|
12.99 |
| | |
|
|
|
L |
|
JSW Steel |
917.350 |
8/12/24 |
1.35 |
943.900 |
-2.81 |
824.300 |
119.600 |
14.51 |
|
12.89 |
| | |
|
|
|
|
|
Reliance Industries |
2,921.250 |
8/12/24 |
-0.93 |
3,120.300 |
-6.38 |
3,014.800 |
105.500 |
3.50 |
|
12.30 |
| | |
|
|
|
|
|
Tech Mahindra |
1,512.500 |
8/12/24 |
0.38 |
1,472.100 |
2.74 |
1,280.050 |
192.050 |
15.00 |
|
11.18 |
| | |
|
|
|
|
|
ICICI Bank |
1,172.800 |
8/12/24 |
0.10 |
1,211.850 |
-3.22 |
1,092.350 |
119.500 |
10.94 |
|
9.59 |
| | |
|
|
|
|
|
Wipro |
489.050 |
8/12/24 |
-0.46 |
527.350 |
-7.26 |
520.500 |
6.850 |
1.32 |
|
9.24 |
| | |
|
|
|
|
|
HCL Technologies |
1,585.250 |
8/12/24 |
-0.30 |
1,468.850 |
7.92 |
1,637.950 |
-169.100 |
-10.32 |
|
6.54 |
| | |
|
|
|
|
|
Nestlé India |
2,473.100 |
8/12/24 |
-1.26 |
2,568.100 |
-3.70 |
2,589.100 |
-21.000 |
-0.81 |
|
5.55 |
| | |
|
|
|
|
|
Titan |
3,320.850 |
8/12/24 |
-0.33 |
3,431.450 |
-3.22 |
3,732.400 |
-300.950 |
-8.06 |
|
4.98 |
| | |
|
|
|
|
|
Tata Consultancy |
4,195.650 |
8/12/24 |
-0.78 |
3,978.200 |
5.47 |
4,080.700 |
-102.500 |
-2.51 |
|
4.87 |
| | |
|
|
|
L |
|
HDFC Bank |
1,660.100 |
8/12/24 |
0.60 |
1,705.200 |
-2.64 |
1,432.700 |
272.500 |
19.02 |
|
3.28 |
| | |
|
|
|
L |
|
Bajaj Finance |
6,608.150 |
8/12/24 |
-0.15 |
7,276.750 |
-9.19 |
6,602.450 |
674.300 |
10.21 |
|
2.28 |
| | |
|
|
|
|
|
IndusInd Bank |
1,350.850 |
8/12/24 |
0.08 |
1,456.900 |
-7.28 |
1,531.300 |
-74.400 |
-4.86 |
|
2.15 |
| |
|
⇓instrument |
freshest |
⇓ Δday |
7/01/24 |
⇓ Δwk |
3/04/24 |
prc diff |
⇓ Δ17 |
|
∅-RS |
| | |
|
|
|
|
|
Infosys |
1,797.400 |
8/12/24 |
1.51 |
1,590.800 |
12.99 |
1,637.200 |
-46.400 |
-2.83 |
|
1.41 |
| | |
|
|
|
L |
|
Hindustan Unilever |
2,748.700 |
8/12/24 |
0.05 |
2,505.100 |
9.72 |
2,422.000 |
83.100 |
3.43 |
|
0.55 |
| | |
|
|
|
|
|
Bajaj Finserv |
1,559.000 |
8/12/24 |
-0.08 |
1,580.200 |
-1.34 |
1,619.300 |
-39.100 |
-2.41 |
|
-0.25 |
| | |
|
|
|
|
|
ITC |
494.600 |
8/12/24 |
-0.26 |
429.050 |
15.28 |
409.100 |
19.950 |
4.88 |
|
-2.20 |
| | |
|
|
|
L |
|
Kotak Mahindra Bank |
1,772.550 |
8/12/24 |
0.16 |
1,808.100 |
-1.97 |
1,727.200 |
80.900 |
4.68 |
|
-3.32 |
| | |
|
|
|
L |
|
Asian Paints |
3,053.200 |
8/12/24 |
0.41 |
2,927.800 |
4.28 |
2,831.750 |
96.050 |
3.39 |
|
-5.50 |
| BSE Sensex 30 - 30 out of 30 instruments rated - 7/01/24 / 3/04/24 - 21 did rise, Market-Ratio(17) = 70.00 % |
| Stock Exchange Currency: INR ₹ Indian rupee |
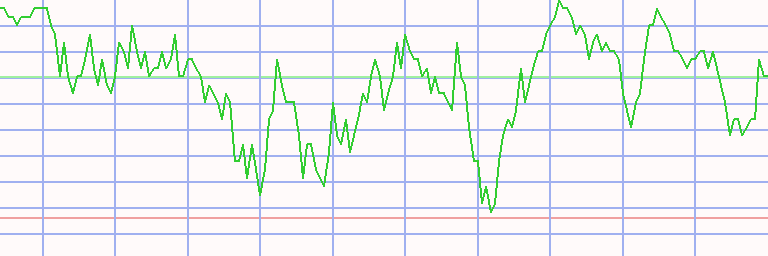
Technical Chart
Transactions BSE Sensex 30 * A17 - 70/15 (1)
|
⇐ |
| |
| L/S | date buy | date sell | days | | instrument | spl | pieces | | prc buy | prc sell | ps short | prc diff | d % | asset | yield | |
| 1/02/06 |
6/12/06 |
161 |
|
- cash - |
| short |
6/12/06 |
9/11/06 |
91 |
|
|
|
Wipro |
100 |
512 |
|
19.520 |
25.478 |
13.563 |
-5.958 |
-31 |
6,950 |
-77 |
|
| long |
9/11/06 |
8/25/08 |
714 |
|
|
|
Bharat Heavy |
100 |
458 |
|
15.146 |
22.813 |
|
7.667 |
51 |
10,461 |
23 |
|
| short |
8/25/08 |
3/23/09 |
210 |
|
|
|
Tata Motors |
100 |
1,204 |
|
8.686 |
3.321 |
22.718 |
14.032 |
162 |
27,356 |
432 |
|
| long |
3/23/09 |
2/07/11 |
686 |
|
|
|
Maruti Suzuki |
100 |
357 |
|
76.585 |
118.430 |
|
41.845 |
55 |
42,295 |
26 |
|
| short |
2/07/11 |
1/30/12 |
357 |
|
|
|
Bharat Heavy |
100 |
1,554 |
|
27.203 |
17.600 |
42.045 |
14.842 |
55 |
65,359 |
56 |
|
| long |
1/30/12 |
11/16/15 |
1386 |
|
|
|
Hindustan Unilever |
100 |
1,631 |
|
40.070 |
78.475 |
|
38.405 |
96 |
127,998 |
19 |
|
| short |
11/16/15 |
6/13/16 |
210 |
|
|
|
Bharat Heavy |
100 |
10,759 |
|
11.897 |
8.030 |
17.625 |
5.729 |
48 |
189,632 |
98 |
|
| long |
6/13/16 |
12/26/16 |
196 |
|
|
|
Tata Steel |
100 |
58,773 |
|
3.227 |
3.800 |
|
0.574 |
18 |
223,338 |
36 |
|
| short |
12/26/16 |
2/20/17 |
56 |
|
|
|
Sun Pharma |
100 |
3,654 |
|
61.105 |
67.900 |
54.310 |
-6.795 |
-11 |
198,509 |
-54 |
|
| long |
2/20/17 |
10/07/19 |
959 |
|
|
|
Tata Steel |
100 |
40,811 |
|
4.864 |
3.248 |
|
-1.616 |
-33 |
132,558 |
-14 |
|
| short |
10/07/19 |
7/13/20 |
280 |
|
|
|
Tata Steel |
100 |
40,812 |
|
3.248 |
3.421 |
3.075 |
-0.173 |
-5 |
125,498 |
-7 |
|
| long |
7/13/20 |
8/12/24 |
1491 |
|
|
|
Reliance Industries |
100 |
648 |
|
193.500 |
292.125 |
|
98.625 |
51 |
189,407 |
11 |
|
| accum | 6/12/06 |
8/12/24 | 6967 |
days out of 7128 invested (98%) |
1,794 |
189,407 |
17 |
|
Instrument Related Contribution
| instrument | L/S | date buy | date sell | days | prc buy | prc sell | ps short | prc diff | d % | | | total |
| Bharat Heavy | long | 9/11/06 | 8/25/08 | 714 | 15.15 | 22.81 | | 7.67 | 50.62 | | | |
| | short | 2/07/11 | 1/30/12 | 357 | 27.20 | 17.60 | 42.04 | 14.84 | 54.56 | | | |
| | short | 11/16/15 | 6/13/16 | 210 | 11.90 | 8.03 | 17.63 | 5.73 | 48.15 | | | 244.90 |
| Tata Motors | short | 8/25/08 | 3/23/09 | 210 | 8.69 | 3.32 | 22.72 | 14.03 | 161.55 | | | 161.55 |
| Hindustan Unilever | long | 1/30/12 | 11/16/15 | 1386 | 40.07 | 78.48 | | 38.41 | 95.84 | | | 95.84 |
| Maruti Suzuki | long | 3/23/09 | 2/07/11 | 686 | 76.59 | 118.43 | | 41.85 | 54.64 | | | 54.64 |
| Reliance Industries | long | 7/13/20 | 8/12/24 | 1491 | 193.50 | 292.13 | | 98.63 | 50.97 | | | 50.97 |
| Sun Pharma | short | 12/26/16 | 2/20/17 | 56 | 61.11 | 67.90 | 54.31 | -6.80 | -11.12 | | | -11.12 |
| Tata Steel | long | 6/13/16 | 12/26/16 | 196 | 3.23 | 3.80 | | 0.57 | 17.77 | | | |
| | long | 2/20/17 | 10/07/19 | 959 | 4.86 | 3.25 | | -1.62 | -33.22 | | | |
| | short | 10/07/19 | 7/13/20 | 280 | 3.25 | 3.42 | 3.08 | -0.17 | -5.33 | | | -25.54 |
| Wipro | short | 6/12/06 | 9/11/06 | 91 | 19.52 | 25.48 | 13.56 | -5.96 | -30.52 | | | -30.52 |
Annotations
| 3/04/24 | BSE Sensex 30 | | | Component update: JSW Steel replaces HDFC |
| 1/05/24 | Nestlé India | | | stock split 1:10 (ten for one) |
| 9/18/23 | Power Grid | | | stock split 3:4 (four for three) |
| 7/28/22 | Tata Steel | | | stock split 1:10 (ten for one) |
| 7/29/21 | Power Grid | | | stock split 3:4 (four for three) |
| 12/05/19 | HCL Technologies | | | splits 1:2 (two for one) |
| 9/04/18 | Infosys | | | stock split 1:2 (teo for one) |
| 5/31/18 | Tata Consultancy | | | stock split 1:2 (two for one) |
| 12/21/17 | Mahindra & Mahindra | | | stock split 1:2 (two for one) |
| 9/07/17 | Reliance Industries | | | stock split 1:2 (two for one) |
| 7/13/17 | Larsen & Toubro | | | stock split 2:3 (three for two) |
| 6/13/17 | Wipro | | | stock split 1:2 (two for one) |
| 7/01/16 | ITC | | | stock split 2:3 (three for two) |
| 4/02/16 | BSE Sensex | | | complete analysis |
| | BSE Sensex | | | Adani Ports, Asian Paints and Lupin replace Hindalco, Tata Power and Vedanta |
|
|