Wed, Jun 24th, 2026, 10:57UTC
Assessment - Austrian Traded Index in Euro - 7/01/24 - RS = 23
⇐
⇓ freshest
⇓ 7/01/24
⇓ 1/22/24
prc diff
⇓
∅-RS
ATX
3,568.200
8/12/24
0.19
3,648.520
-2.20
3,371.060
277.460
8.23
7.12
L
Telekom Austria
8.510
8/12/24
2.04
8.990
-5.34
8.100
0.890
10.99
24.74
Do&Co
144.600
8/12/24
-2.56
166.600
-13.21
125.200
41.400
33.07
24.32
Immofinanz
29.550
8/12/24
-0.51
26.400
11.93
21.550
4.850
22.51
20.43
Bawag
64.400
8/12/24
-1.38
61.000
5.57
47.280
13.720
29.02
20.26
Wienerberger
28.200
8/12/24
-2.76
31.120
-9.38
29.020
2.100
7.24
18.71
L
EVN
29.250
8/12/24
29.700
-1.52
25.400
4.300
16.93
18.01
Erste Group Bank
46.100
8/12/24
0.37
45.090
2.24
39.320
5.770
14.67
17.30
Andritz
54.650
8/12/24
-0.55
58.100
-5.94
55.700
2.400
4.31
13.53
Vienna Insurance
29.800
8/12/24
1.36
30.600
-2.61
26.550
4.050
15.25
7.92
Raiffeisen Bank Int
16.610
8/12/24
1.59
16.340
1.65
19.660
-3.320
-16.89
1.72
L
Lenzing
30.350
8/12/24
0.83
33.200
-8.58
29.850
3.350
11.22
-0.38
Uniqa
7.680
8/12/24
0.26
8.000
-4.00
7.580
0.420
5.54
-0.68
L
Verbund
76.850
8/12/24
1.52
75.750
1.45
75.650
0.100
0.13
-1.50
CA Immobilien
31.940
8/12/24
0.13
31.240
2.24
30.200
1.040
3.44
-4.78
Österreichische Post
29.550
8/12/24
0.34
30.100
-1.83
31.150
-1.050
-3.37
-5.10
OMV
38.980
8/12/24
1.56
40.760
-4.37
38.120
2.640
6.93
-7.22
L
Mayr-Melnhof
103.600
8/12/24
1.17
110.800
-6.50
118.800
-8.000
-6.73
-7.39
voestalpine
22.080
8/12/24
-0.18
25.280
-12.66
27.260
-1.980
-7.26
-8.15
AT&S
15.660
8/12/24
2.02
21.580
-27.43
21.580
0.000
0.00
-8.21
Schoeller-Bleckmann
34.050
8/12/24
-0.87
37.750
-9.80
44.000
-6.250
-14.20
-19.45
ATX - 20 out of 20 instruments rated - 7/01/24 / 1/22/24 - 14 did rise, Market-Ratio(23) in EUR = 70.00 % Stock Exchange Currency: EUR € Euro
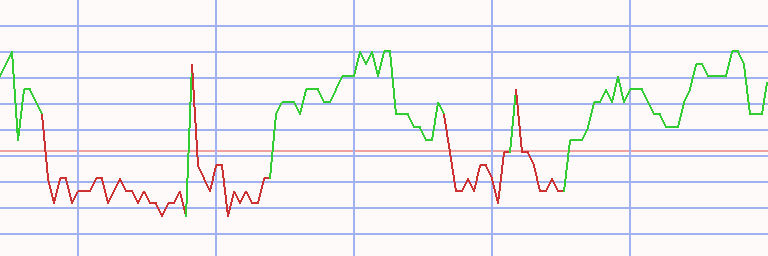
Technical Chart
Transactions Austrian Traded Index in Euro * L23 - 41 ex 5 (1)
⇐ L/S date buy date sell days instrument spl pieces prc buy prc sell prc diff d % asset yield long
1/02/06
4/24/06
112
OMV
100
199
50.120
56.100
5.980
12
11,190
44
4/24/06
9/11/06
140
voestalpine
100
354
31.580
29.070
-2.510
-8
10,301
-19
9/11/06 9/18/06 7 - cash -
9/18/06
9/25/06
7
voestalpine
100
323
31.850
30.200
-1.650
-5
9,769
-94
9/25/06 10/23/06 28 - cash -
10/23/06
9/10/07
322
voestalpine
100
267
36.540
56.700
20.160
55
15,151
65
9/10/07 10/15/07 35 - cash -
10/15/07
10/22/07
7
Schoeller-Bleckmann
100
216
69.850
75.000
5.150
7
16,264
3,983
10/22/07 4/28/08 189 - cash -
4/28/08
5/12/08
14
Verbund
100
321
50.653
51.368
0.715
1
16,493
44
5/12/08 5/19/08 7 - cash -
5/19/08
7/14/08
56
Verbund
100
302
54.594
50.971
-3.623
-7
15,399
-36
7/14/08 8/25/08 42 - cash -
8/25/08
9/08/08
14
Verbund
100
305
50.366
46.504
-3.862
-8
14,221
-88
9/08/08 3/30/09 203 - cash -
3/30/09
4/13/09
14
Mayr-Melnhof
100
273
51.940
52.000
0.060
0
14,237
3
4/13/09 4/27/09 14 - cash -
4/27/09
3/01/10
308
Immofinanz
100
1,137
12.520
19.350
6.830
55
22,003
68
3/01/10 3/08/10 7 - cash -
3/08/10
3/14/11
371
AT&S
100
2,833
7.765
13.011
5.246
68
36,864
66
3/14/11
6/13/11
91
Lenzing
100
434
84.788
97.020
12.232
14
42,173
72
6/13/11 7/04/11 21 - cash -
7/04/11
7/11/11
7
Lenzing
100
463
90.900
88.700
-2.200
-2
41,154
-72
7/11/11 1/16/12 189 - cash -
1/16/12
3/19/12
63
Schoeller-Bleckmann
100
594
69.190
65.910
-3.280
-5
39,206
-25
3/19/12
4/09/12
21
Lenzing
100
450
87.000
79.110
-7.890
-9
35,656
-81
4/09/12
7/02/12
84
Österreichische Post
100
1,382
25.800
26.930
1.130
4
37,217
20
7/02/12 8/20/12 49 - cash -
8/20/12
8/27/12
7
Andritz
100
849
43.800
42.260
-1.540
-4
35,910
-85
8/27/12 9/10/12 14 - cash -
9/10/12
12/17/12
98
Raiffeisen Bank Int
100
1,226
29.290
31.150
1.860
6
38,190
26
12/17/12
6/10/13
175
Erste Group Bank
100
1,652
23.105
23.687
0.582
3
39,152
5
6/10/13 7/29/13 49 - cash -
7/29/13
8/19/13
21
Wienerberger
100
4,173
9.380
11.400
2.020
22
47,581
2,866
8/19/13 9/02/13 14 - cash -
9/02/13
5/12/14
252
Wienerberger
100
4,343
10.955
13.120
2.165
20
56,984
30
5/12/14 5/19/14 7 - cash -
5/19/14
8/04/14
77
AT&S
100
6,338
8.990
8.446
-0.544
-6
53,536
-26
8/04/14 8/18/14 14 - cash -
8/18/14
10/06/14
49
Do&Co
100
1,058
50.600
50.410
-0.190
0
53,335
-3
10/06/14 1/12/15 98 - cash -
1/12/15
5/04/15
112
Do&Co
100
805
66.200
64.030
-2.170
-3
51,588
-10
5/04/15
8/17/15
105
AT&S
100
3,572
14.440
15.600
1.160
8
55,732
31
L/S date buy date sell days instrument spl pieces prc buy prc sell prc diff d % asset yield
8/17/15 11/09/15 84 - cash -
11/09/15
11/16/15
7
AT&S
100
3,545
15.720
15.300
-0.420
-3
54,243
-76
11/16/15 11/23/15 7 - cash -
11/23/15
12/28/15
35
Do&Co
100
570
95.000
93.360
-1.640
-2
53,308
-17
12/28/15 1/04/16 7 - cash -
1/04/16
1/11/16
7
Do&Co
100
551
96.720
95.400
-1.320
-1
52,580
-51
1/11/16 2/01/16 21 - cash -
2/01/16
2/08/16
7
Do&Co
100
556
94.400
90.200
-4.200
-4
50,245
-91
2/08/16 3/07/16 28 - cash -
3/07/16
3/28/16
21
Do&Co
100
510
98.400
105.000
6.600
7
53,611
209
3/28/16 4/25/16 28 - cash -
4/25/16
5/09/16
14
Do&Co
100
540
99.100
96.390
-2.710
-3
52,148
-51
5/09/16 5/23/16 14 - cash -
5/23/16
6/06/16
14
Lenzing
100
647
80.500
82.890
2.390
3
53,694
114
6/06/16 6/20/16 14 - cash -
6/20/16
6/27/16
7
Lenzing
100
642
83.520
76.970
-6.550
-8
49,489
-99
6/27/16 7/11/16 14 - cash -
7/11/16
8/22/16
42
Lenzing
100
575
85.990
100.200
14.210
17
57,660
278
8/22/16 9/05/16 14 - cash -
9/05/16
9/26/16
21
Lenzing
100
532
108.250
99.730
-8.520
-8
53,127
-76
9/26/16 10/10/16 14 - cash -
10/10/16
7/10/17
273
Lenzing
100
476
111.500
152.550
41.050
37
72,667
52
7/10/17
1/15/18
189
OMV
100
1,613
45.030
55.600
10.570
23
89,716
50
1/15/18
6/04/18
140
AT&S
100
3,424
26.200
17.880
-8.320
-32
61,229
-63
6/04/18 7/23/18 49 - cash -
7/23/18
8/20/18
28
Verbund
100
1,850
33.080
34.140
1.060
3
63,190
51
8/20/18 9/03/18 14 - cash -
9/03/18
9/10/18
7
Verbund
100
1,826
34.600
37.960
3.360
10
69,325
12,453
9/10/18 9/17/18 7 - cash -
9/17/18
9/24/18
7
Verbund
100
1,760
39.380
40.800
1.420
4
71,824
534
9/24/18 12/03/18 70 - cash -
12/03/18
12/10/18
7
Do&Co
100
811
88.500
81.200
-7.300
-8
65,904
-99
12/10/18 3/25/19 105 - cash -
3/25/19
4/01/19
7
Verbund
100
1,522
43.300
43.020
-0.280
-1
65,478
-29
4/01/19 4/08/19 7 - cash -
4/08/19
5/13/19
35
Verbund
100
1,495
43.780
44.220
0.440
1
66,136
11
5/13/19 5/20/19 7 - cash -
5/20/19
8/05/19
77
Verbund
100
1,422
46.500
52.300
5.800
12
74,383
75
8/05/19 9/16/19 42 - cash -
9/16/19
9/23/19
7
Verbund
100
1,442
51.550
51.550
0.000
0
74,383
0
9/23/19 10/21/19 28 - cash -
10/21/19
3/02/20
133
Wienerberger
100
3,135
23.720
22.240
-1.480
-6
69,743
-16
3/02/20 8/24/20 175 - cash -
8/24/20
10/19/20
56
Mayr-Melnhof
100
474
147.000
148.800
1.800
1
70,597
8
10/19/20 11/09/20 21 - cash -
11/09/20
11/16/20
7
Verbund
100
1,298
54.350
54.500
0.150
0
70,791
15
11/16/20 11/23/20 7 - cash -
11/23/20
9/13/21
294
Lenzing
100
990
71.500
104.000
32.500
45
102,966
59
L/S date buy date sell days instrument spl pieces prc buy prc sell prc diff d % asset yield
9/13/21
9/27/21
14
AT&S
100
2,764
37.250
32.400
-4.850
-13
89,561
-97
9/27/21
11/22/21
56
OMV
100
1,703
52.560
49.900
-2.660
-5
85,031
-29
11/22/21
1/24/22
63
AT&S
100
1,904
44.650
36.700
-7.950
-18
69,894
-68
1/24/22
2/28/22
35
Erste Group Bank
100
1,726
40.480
31.990
-8.490
-21
55,240
-91
2/28/22 8/15/22 168 - cash -
8/15/22
8/22/22
7
Schoeller-Bleckmann
100
1,074
51.400
55.000
3.600
7
59,107
3,312
8/22/22 11/21/22 91 - cash -
11/21/22
3/06/23
105
Schoeller-Bleckmann
100
1,017
58.100
68.600
10.500
18
69,785
78
3/06/23
6/19/23
105
voestalpine
100
1,929
36.160
32.320
-3.840
-11
62,378
-32
6/19/23 9/04/23 77 - cash -
9/04/23
9/11/23
7
Immofinanz
100
3,492
17.860
17.920
0.060
0
62,587
19
9/11/23 11/13/23 63 - cash -
11/13/23
1/29/24
77
EVN
100
2,384
26.250
25.150
-1.100
-4
59,965
-18
1/29/24
4/15/24
77
Raiffeisen Bank Int
100
3,019
19.860
17.600
-2.260
-11
53,142
-44
4/15/24
8/12/24
119
Immofinanz
100
2,266
23.450
29.550
6.100
26
66,965
103
accum 1/02/06
8/12/24 5315
days out of 7478 invested (71%)
570
66,965
14
Instrument Related Contribution
instrument L/S date buy date sell days prc buy prc sell prc diff d % total Lenzing long 3/14/11 6/13/11 91 84.79 97.02 12.23 14.43 7/04/11 7/11/11 7 90.90 88.70 -2.20 -2.42 3/19/12 4/09/12 21 87.00 79.11 -7.89 -9.07 5/23/16 6/06/16 14 80.50 82.89 2.39 2.97 6/20/16 6/27/16 7 83.52 76.97 -6.55 -7.84 7/11/16 8/22/16 42 85.99 100.20 14.21 16.53 9/05/16 9/26/16 21 108.25 99.73 -8.52 -7.87 10/10/16 7/10/17 273 111.50 152.55 41.05 36.82 11/23/20 9/13/21 294 71.50 104.00 32.50 45.45 105.83 Immofinanz 4/27/09 3/01/10 308 12.52 19.35 6.83 54.55 9/04/23 9/11/23 7 17.86 17.92 0.06 0.34 4/15/24 8/12/24 119 23.45 29.55 6.10 26.01 95.41 Wienerberger 7/29/13 8/19/13 21 9.38 11.40 2.02 21.54 9/02/13 5/12/14 252 10.96 13.12 2.17 19.76 10/21/19 3/02/20 133 23.72 22.24 -1.48 -6.24 36.47 OMV 1/02/06 4/24/06 112 50.12 56.10 5.98 11.93 7/10/17 1/15/18 189 45.03 55.60 10.57 23.47 9/27/21 11/22/21 56 52.56 49.90 -2.66 -5.06 31.21 Schoeller-Bleckmann 10/15/07 10/22/07 7 69.85 75.00 5.15 7.37 1/16/12 3/19/12 63 69.19 65.91 -3.28 -4.74 8/15/22 8/22/22 7 51.40 55.00 3.60 7.00 11/21/22 3/06/23 105 58.10 68.60 10.50 18.07 29.23 voestalpine 4/24/06 9/11/06 140 31.58 29.07 -2.51 -7.95 9/18/06 9/25/06 7 31.85 30.20 -1.65 -5.18 10/23/06 9/10/07 322 36.54 56.70 20.16 55.17 3/06/23 6/19/23 105 36.16 32.32 -3.84 -10.62 21.06 instrument L/S date buy date sell days prc buy prc sell prc diff d % total Verbund 4/28/08 5/12/08 14 50.65 51.37 0.72 1.41 5/19/08 7/14/08 56 54.59 50.97 -3.62 -6.64 8/25/08 9/08/08 14 50.37 46.50 -3.86 -7.67 7/23/18 8/20/18 28 33.08 34.14 1.06 3.20 9/03/18 9/10/18 7 34.60 37.96 3.36 9.71 9/17/18 9/24/18 7 39.38 40.80 1.42 3.61 3/25/19 4/01/19 7 43.30 43.02 -0.28 -0.65 4/08/19 5/13/19 35 43.78 44.22 0.44 1.01 5/20/19 8/05/19 77 46.50 52.30 5.80 12.47 9/16/19 9/23/19 7 51.55 51.55 0.00 0.00 11/09/20 11/16/20 7 54.35 54.50 0.15 0.28 16.07 Österreichische Post 4/09/12 7/02/12 84 25.80 26.93 1.13 4.38 4.38 Mayr-Melnhof 3/30/09 4/13/09 14 51.94 52.00 0.06 0.12 8/24/20 10/19/20 56 147.00 148.80 1.80 1.22 1.34 Andritz 8/20/12 8/27/12 7 43.80 42.26 -1.54 -3.52 -3.52 EVN 11/13/23 1/29/24 77 26.25 25.15 -1.10 -4.19 -4.19 Raiffeisen Bank Int 9/10/12 12/17/12 98 29.29 31.15 1.86 6.35 1/29/24 4/15/24 77 19.86 17.60 -2.26 -11.38 -5.75 Do&Co 8/18/14 10/06/14 49 50.60 50.41 -0.19 -0.38 1/12/15 5/04/15 112 66.20 64.03 -2.17 -3.28 11/23/15 12/28/15 35 95.00 93.36 -1.64 -1.73 1/04/16 1/11/16 7 96.72 95.40 -1.32 -1.36 2/01/16 2/08/16 7 94.40 90.20 -4.20 -4.45 3/07/16 3/28/16 21 98.40 105.00 6.60 6.71 4/25/16 5/09/16 14 99.10 96.39 -2.71 -2.73 12/03/18 12/10/18 7 88.50 81.20 -7.30 -8.25 -15.01 instrument L/S date buy date sell days prc buy prc sell prc diff d % total Erste Group Bank 12/17/12 6/10/13 175 23.11 23.69 0.58 2.52 1/24/22 2/28/22 35 40.48 31.99 -8.49 -20.97 -18.98 AT&S 3/08/10 3/14/11 371 7.77 13.01 5.25 67.55 5/19/14 8/04/14 77 8.99 8.45 -0.54 -6.05 5/04/15 8/17/15 105 14.44 15.60 1.16 8.03 11/09/15 11/16/15 7 15.72 15.30 -0.42 -2.67 1/15/18 6/04/18 140 26.20 17.88 -8.32 -31.76 9/13/21 9/27/21 14 37.25 32.40 -4.85 -13.02 11/22/21 1/24/22 63 44.65 36.70 -7.95 -17.81 -19.24
Annotations
2/19/24 ATX : Component update: Telekom Austria replaces Strabag 9/24/18 ATX Do&Co replaces Porr 6/25/18 Immofinanz reverse stock split 10:1 (one for ten) 5/22/18 ATX component exchange: AT&S and FACC for Agrana and Zumtobel 3/25/17 ATX Machine Learning processed for all techniques. 3/20/17 ATX Flughafen Wien replaces Do&Co 9/19/16 ATX Do&Co replaces AT&S 3/21/16 ATX AT&S replaces Flughafen Wien 9/09/15 ATX complete analysis (scheduled)
write an annotation