Auswertung - Shanghai Stock Exchange 50 in Yen - 1.07.24 - RS = 18
⇐
⇓ jüngster
⇓ 1.07.24
⇓ 26.02.24
K-Diff
Δ18
⇓
L
SSE 50 ew
39.680,197
12.08.24
-0,09
41.414,520
-4,19
38.155,907
3.258,613
8,54
7,97
Cosco Shipping
274,448
12.08.24
0,49
350,991
-21,81
219,233
131,759
60,10
63,72
Zijin Mining
340,785
12.08.24
0,13
400,245
-14,86
275,350
124,896
45,36
45,77
L
GigaDevice
1.734,766
12.08.24
0,09
2.094,632
-17,18
1.494,216
600,416
40,18
16,85
China CSSC
843,089
12.08.24
-0,13
913,420
-7,70
688,060
225,360
32,75
42,92
Haier Smart Home
572,191
12.08.24
1,46
629,876
-9,16
498,561
131,315
26,34
27,49
China Yangtze Pwr
647,403
12.08.24
-1,22
654,059
-1,02
522,431
131,628
25,20
34,74
PetroChina
193,245
12.08.24
-0,34
231,406
-16,49
185,102
46,304
25,02
37,36
L
China Shenhua En
871,931
12.08.24
0,64
1.004,607
-13,21
808,250
196,357
24,29
46,46
Sany Heavy Industry
340,342
12.08.24
-0,45
364,525
-6,63
294,404
70,121
23,82
17,59
PowerChina
119,807
12.08.24
-0,55
126,020
-4,93
105,533
20,486
19,41
17,64
L
Will Semiconductor
2.048,484
12.08.24
0,17
2.196,912
-6,76
1.844,737
352,175
19,09
9,10
Ind and Comm Bk
132,897
12.08.24
1,18
129,126
2,92
111,396
17,730
15,92
26,57
L
China Pacific Ins
607,690
12.08.24
0,22
633,204
-4,03
546,302
86,902
15,91
17,95
NARI Technology
522,049
12.08.24
551,336
-5,31
476,365
74,971
15,74
16,89
L
Great Wall Motor
492,763
12.08.24
-0,31
560,876
-12,14
485,788
75,088
15,46
7,06
L
Industrial Bank
361,197
12.08.24
-0,55
393,811
-8,28
345,077
48,734
14,12
20,16
AECC Aviation Power
843,089
12.08.24
-0,13
804,706
4,77
706,067
98,639
13,97
7,91
Agricultural Bank
102,946
12.08.24
0,65
98,508
4,50
86,688
11,820
13,64
25,62
Wanhua Chemical
1.662,216
12.08.24
-0,91
1.825,953
-8,97
1.608,125
217,828
13,55
5,61
China Merchants Bank
712,632
12.08.24
-0,65
762,330
-6,52
675,287
87,043
12,89
16,67
China Rwy Group
131,566
12.08.24
-1,33
145,766
-9,74
131,288
14,477
11,03
8,01
Bank of China
103,389
12.08.24
0,65
103,611
-0,21
93,389
10,223
10,95
23,19
China Telecom Corp
126,241
12.08.24
-1,56
135,338
-6,72
122,494
12,844
10,49
15,32
L
China Life
654,281
12.08.24
0,44
695,548
-5,93
636,549
58,999
9,27
7,17
⇓ jüngster
⇓ 1.07.24
⇓ 26.02.24
K-Diff
Δ18
⇓
L
China State Constr
122,026
12.08.24
-0,18
120,695
1,10
111,187
9,508
8,55
10,06
Shaanxi Coal
512,287
12.08.24
2,12
596,153
-14,07
549,861
46,291
8,42
40,39
S
China Petrol&Chem
145,766
12.08.24
0,15
141,772
2,82
131,079
10,693
8,16
14,73
L
SMIC
1.082,260
12.08.24
0,60
1.016,366
6,48
940,586
75,780
8,06
2,08
China Unicom
98,952
12.08.24
-1,33
103,833
-4,70
99,042
4,791
4,84
7,28
China Three Gorges R
105,386
12.08.24
-0,21
99,396
6,03
95,901
3,495
3,64
1,47
China Northern Rare
373,178
12.08.24
-0,65
400,023
-6,71
388,002
12,021
3,10
-4,83
L
Ping An Ins
901,218
12.08.24
0,02
923,404
-2,40
899,336
24,069
2,68
2,58
Zhangzhou Pientze
4.614,802
12.08.24
-0,60
4.575,532
0,86
4.543,791
31,741
0,70
-9,69
L
Poly Developments
183,261
12.08.24
-3,39
206,557
-11,28
205,622
0,935
0,45
-5,76
L
TBEA
295,747
12.08.24
0,23
309,724
-4,51
309,480
0,244
0,08
0,08
S
SAIC Motor Corp
304,843
12.08.24
-0,87
307,506
-0,87
309,480
-1,975
-0,64
3,07
S
Jiangsu Hengrui Med
967,999
12.08.24
2,85
849,079
14,01
881,119
-32,039
-3,64
-6,06
Shanxi Xinghuacun
4.244,065
12.08.24
-1,14
4.593,947
-7,62
4.778,937
-184,991
-3,87
-3,99
S
IM Yili
540,242
12.08.24
0,66
576,185
-6,24
600,744
-24,559
-4,09
2,18
Hygon
1.635,149
12.08.24
2,35
1.563,486
4,58
1.720,149
-156,663
-9,11
13,04
Foshan Haitian F&F
787,179
12.08.24
-0,03
763,217
3,14
842,172
-78,954
-9,38
-4,31
S
Citic Secs
418,660
12.08.24
-0,11
403,795
3,68
446,841
-43,046
-9,63
-5,12
S
Kweichow Moutai
31.862,101
12.08.24
-0,05
31.957,060
-0,30
35.491,403
-3.534,343
-9,96
-9,79
Beijing Kingsoft
4.270,245
12.08.24
-0,91
4.548,242
-6,11
5.130,086
-581,844
-11,34
-28,90
Zhejiang Huayou
493,873
12.08.24
-0,27
495,869
-0,40
562,216
-66,346
-11,80
-27,11
S
China Tourism
1.418,830
12.08.24
-1,36
1.386,659
2,32
1.793,227
-406,568
-22,67
-25,27
S
Tongwei
414,223
12.08.24
417,995
-0,90
543,161
-125,166
-23,04
-24,46
WuXi AppTec
918,079
12.08.24
-0,29
857,732
7,04
1.144,323
-286,591
-25,04
-32,62
L
Trina Solar
384,715
12.08.24
0,58
379,834
1,29
510,915
-131,081
-25,66
-31,97
⇓ jüngster
⇓ 1.07.24
⇓ 26.02.24
K-Diff
Δ18
⇓
S
LONGi Green Energy
309,059
12.08.24
0,87
311,721
-0,85
433,021
-121,300
-28,01
-32,60
SSE 50 - 50 von 50 Wertpapieren bewertet - 1.07.24 / 26.02.24 - 35 davon sind besser, Markt-Kennzahl(18) in JPY = 70,00 % Börsenplatz-Währung: CNY ¥ Renminbi Yuán
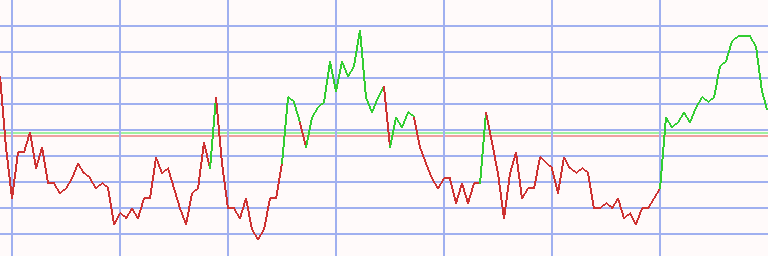
Technischer Chart
Transaktionen Shanghai Stock Exchange 50 in Yen * S18 - 47/48 (1)
⇐ L/S K-Datum V-Datum Tage Wertpapier Spl Stück K-Kurs V-Kurs S-V-Kurs K-Diff D % Kapital Rdte
2.01.06 21.01.08 749 - cash -
short
21.01.08
9.02.09
385
Shanghai Int Port
100
84
118,756
57,428
245,574
126,818
107
20.653
99
9.02.09 30.11.09 294 - cash -
30.11.09
14.12.09
14
China Rwy Constr
100
176
117,085
116,474
117,699
0,614
1
20.761
15
14.12.09 22.02.10 70 - cash -
22.02.10
11.10.10
231
Poly Developments
100
246
84,321
70,447
100,928
16,607
20
24.846
33
11.10.10 29.11.10 49 - cash -
29.11.10
13.12.10
14
Shanghai Pudong
100
197
125,656
126,130
125,183
-0,474
0
24.753
-9
13.12.10 20.12.10 7 - cash -
20.12.10
3.01.11
14
Shanghai Pudong
100
205
120,616
119,157
122,093
1,477
1
25.055
37
3.01.11 10.01.11 7 - cash -
10.01.11
24.01.11
14
China Merchants Secs
100
138
180,588
171,130
190,569
9,981
6
26.433
307
24.01.11 21.02.11 28 - cash -
21.02.11
28.03.11
35
Shanghai Pudong
100
208
126,603
128,261
124,946
-1,657
-1
26.088
-13
28.03.11 6.06.11 70 - cash -
6.06.11
23.01.12
231
China Rwy Constr
100
351
74,210
50,327
109,428
35,218
47
38.450
85
23.01.12 12.03.12 49 - cash -
12.03.12
26.03.12
14
China Rwy Group
100
1.081
35,548
34,156
36,997
1,449
4
40.015
183
26.03.12 11.06.12 77 - cash -
11.06.12
10.12.12
182
China Unicom
100
790
50,617
44,086
58,115
7,498
15
45.939
32
10.12.12 29.04.13 140 - cash -
29.04.13
28.10.13
182
China Northern Rare
100
158
289,969
269,238
312,296
22,327
8
49.466
16
28.10.13 30.12.13 63 - cash -
30.12.13
26.05.14
147
Poly Developments
100
532
92,820
82,171
104,848
12,028
13
55.865
35
26.05.14 9.06.14 14 - cash -
9.06.14
16.06.14
7
China Northern Rare
100
264
210,983
209,379
212,599
1,616
1
56.292
49
16.06.14 23.06.14 7 - cash -
23.06.14
30.06.14
7
Kangmei Pharma
100
471
119,505
122,158
116,853
-2,652
-2
55.043
-69
30.06.14 27.07.15 392 - cash -
27.07.15
28.12.15
154
China Northern Rare
100
181
302,832
259,854
352,919
50,087
17
64.108
44
28.12.15 11.01.16 14 - cash -
11.01.16
6.06.16
147
Haitong Secs
100
285
224,871
252,655
197,087
-27,784
-12
56.190
-28
6.06.16 27.06.16 21 - cash -
27.06.16
4.07.16
7
Cosco Shipping
100
724
77,513
80,125
74,901
-2,612
-3
54.299
-83
4.07.16 11.07.16 7 - cash -
11.07.16
18.07.16
7
Cosco Shipping
100
677
80,087
85,056
75,118
-4,969
-6
50.935
-96
18.07.16 25.07.16 7 - cash -
25.07.16
15.08.16
21
Cosco Shipping
100
612
83,178
81,470
84,921
1,744
2
52.002
43
15.08.16 19.12.16 126 - cash -
19.12.16
26.12.16
7
Orient Secs
100
198
261,441
261,917
260,964
-0,477
0
51.908
-9
26.12.16 3.04.17 98 - cash -
3.04.17
10.04.17
7
Dongxing Secs
100
175
296,290
289,963
302,756
6,466
2
53.039
208
10.04.17 22.05.17 42 - cash -
22.05.17
5.06.17
14
AECC Aviation Power
100
126
419,854
392,896
448,662
28,808
7
56.669
464
5.06.17 19.06.17 14 - cash -
19.06.17
3.07.17
14
Shandong Gold
100
120
468,489
480,781
456,197
-12,292
-3
55.194
-50
3.07.17 27.11.17 147 - cash -
27.11.17
15.01.18
49
Tsinghua Tongfang
100
294
187,724
173,203
203,461
15,738
8
59.821
82
15.01.18 12.02.18 28 - cash -
12.02.18
26.02.18
14
Founder Secs
100
554
107,930
110,500
105,361
-2,570
-2
58.397
-47
L/S K-Datum V-Datum Tage Wertpapier Spl Stück K-Kurs V-Kurs S-V-Kurs K-Diff D % Kapital Rdte
26.02.18 5.03.18 7 - cash -
5.03.18
5.11.18
245
Founder Secs
100
542
107,708
92,018
126,073
18,365
17
68.351
26
5.11.18 24.12.18 49 - cash -
24.12.18
21.01.19
28
China Molybdenum
100
1.080
63,273
63,249
63,297
0,024
0
68.378
1
21.01.19 28.01.19 7 - cash -
28.01.19
11.02.19
14
San’an Optoelectron
100
427
160,086
196,006
124,165
-35,921
-22
53.040
-100
11.02.19 1.07.19 140 - cash -
1.07.19
16.09.19
77
PetroChina
100
483
109,754
99,424
121,158
11,404
10
58.548
60
16.09.19 30.09.19 14 - cash -
30.09.19
14.10.19
14
Bank of Shanghai
100
414
141,367
149,755
132,980
-8,388
-6
55.075
-80
14.10.19 21.10.19 7 - cash -
21.10.19
9.12.19
49
PetroChina
100
592
93,011
87,199
99,210
6,199
7
58.745
62
9.12.19 27.01.20 49 - cash -
27.01.20
8.06.20
133
China Comms Constr
100
445
131,904
118,428
146,913
15,009
11
65.424
34
8.06.20 15.06.20 7 - cash -
15.06.20
6.07.20
21
PetroChina
100
1.022
64,002
72,288
55,716
-8,286
-13
56.956
-91
6.07.20 9.11.20 126 - cash -
9.11.20
30.11.20
21
Shandong Gold
100
138
412,234
378,026
449,537
37,303
9
62.104
351
30.11.20 7.12.20 7 - cash -
7.12.20
11.01.21
35
Shandong Gold
100
161
383,555
376,086
391,173
7,618
2
63.330
23
11.01.21 29.03.21 77 - cash -
29.03.21
22.11.21
238
Shenzhen Goodix Tech
100
35
1.790,778
2.031,211
1.550,345
-240,433
-13
54.915
-20
22.11.21 29.11.21 7 - cash -
29.11.21
6.12.21
7
Jiangsu Hengrui Med
100
60
910,024
877,430
943,830
33,805
4
56.943
570
6.12.21 10.01.22 35 - cash -
10.01.22
12.09.22
245
China Tourism
100
15
3.739,221
3.926,151
3.552,291
-186,930
-5
54.139
-7
12.09.22 19.09.22 7 - cash -
19.09.22
5.12.22
77
Wingtech Technology
100
48
1.110,598
1.118,410
1.102,786
-7,812
-1
53.764
-3
5.12.22 26.12.22 21 - cash -
26.12.22
2.01.23
7
LONGi Green Energy
100
67
801,722
801,822
801,623
-0,099
0
53.758
-1
2.01.23 10.04.23 98 - cash -
10.04.23
17.04.23
7
Trina Solar
100
54
979,071
984,360
973,783
-5,289
-1
53.472
-25
17.04.23 15.05.23 28 - cash -
15.05.23
31.07.23
77
LONGi Green Energy
100
80
662,398
593,727
739,010
76,613
12
59.601
68
31.07.23 7.08.23 7 - cash -
7.08.23
26.02.24
203
Foshan Haitian F&F
100
65
904,134
842,172
970,656
66,521
7
63.925
14
26.02.24 6.06.26 831 - cash -
kum 21.01.08
26.02.24 3416
Tage von 7460 investiert (46%)
539
63.925
22
Anteil der Einzelwerte
Wertpapier L/S K-Datum V-Datum Tage K-Kurs V-Kurs S-V-Kurs K-Diff D % Summe Shanghai Int Port short 21.01.08 9.02.09 385 118,76 57,43 245,57 126,82 106,79 106,79 China Rwy Constr 30.11.09 14.12.09 14 117,08 116,47 117,70 0,61 0,52 6.06.11 23.01.12 231 74,21 50,33 109,43 35,22 47,46 48,23 Poly Developments 22.02.10 11.10.10 231 84,32 70,45 100,93 16,61 19,69 30.12.13 26.05.14 147 92,82 82,17 104,85 12,03 12,96 35,21 China Northern Rare 29.04.13 28.10.13 182 289,97 269,24 312,30 22,33 7,70 9.06.14 16.06.14 7 210,98 209,38 212,60 1,62 0,77 27.07.15 28.12.15 154 302,83 259,85 352,92 50,09 16,54 26,47 China Unicom 11.06.12 10.12.12 182 50,62 44,09 58,11 7,50 14,81 14,81 Founder Secs 12.02.18 26.02.18 14 107,93 110,50 105,36 -2,57 -2,38 5.03.18 5.11.18 245 107,71 92,02 126,07 18,37 17,05 14,26 LONGi Green Energy 26.12.22 2.01.23 7 801,72 801,82 801,62 -0,10 -0,01 15.05.23 31.07.23 77 662,40 593,73 739,01 76,61 11,57 11,55 China Comms Constr 27.01.20 8.06.20 133 131,90 118,43 146,91 15,01 11,38 11,38 Tsinghua Tongfang 27.11.17 15.01.18 49 187,72 173,20 203,46 15,74 8,38 8,38 Shandong Gold 19.06.17 3.07.17 14 468,49 480,78 456,20 -12,29 -2,62 9.11.20 30.11.20 21 412,23 378,03 449,54 37,30 9,05 7.12.20 11.01.21 35 383,55 376,09 391,17 7,62 1,99 8,30 Foshan Haitian F&F 7.08.23 26.02.24 203 904,13 842,17 970,66 66,52 7,36 7,36 AECC Aviation Power 22.05.17 5.06.17 14 419,85 392,90 448,66 28,81 6,86 6,86 China Merchants Secs 10.01.11 24.01.11 14 180,59 171,13 190,57 9,98 5,53 5,53 China Rwy Group 12.03.12 26.03.12 14 35,55 34,16 37,00 1,45 4,07 4,07 Jiangsu Hengrui Med 29.11.21 6.12.21 7 910,02 877,43 943,83 33,81 3,71 3,71 PetroChina 1.07.19 16.09.19 77 109,75 99,42 121,16 11,40 10,39 21.10.19 9.12.19 49 93,01 87,20 99,21 6,20 6,66 15.06.20 6.07.20 21 64,00 72,29 55,72 -8,29 -12,95 2,50 Wertpapier L/S K-Datum V-Datum Tage K-Kurs V-Kurs S-V-Kurs K-Diff D % Summe Dongxing Secs 3.04.17 10.04.17 7 296,29 289,96 302,76 6,47 2,18 2,18 China Molybdenum 24.12.18 21.01.19 28 63,27 63,25 63,30 0,02 0,04 0,04 Orient Secs 19.12.16 26.12.16 7 261,44 261,92 260,96 -0,48 -0,18 -0,18 Shanghai Pudong 29.11.10 13.12.10 14 125,66 126,13 125,18 -0,47 -0,38 20.12.10 3.01.11 14 120,62 119,16 122,09 1,48 1,22 21.02.11 28.03.11 35 126,60 128,26 124,95 -1,66 -1,31 -0,48 Trina Solar 10.04.23 17.04.23 7 979,07 984,36 973,78 -5,29 -0,54 -0,54 Wingtech Technology 19.09.22 5.12.22 77 1.110,60 1.118,41 1.102,79 -7,81 -0,70 -0,70 Kangmei Pharma 23.06.14 30.06.14 7 119,51 122,16 116,85 -2,65 -2,22 -2,22 China Tourism 10.01.22 12.09.22 245 3.739,22 3.926,15 3.552,29 -186,93 -5,00 -5,00 Bank of Shanghai 30.09.19 14.10.19 14 141,37 149,75 132,98 -8,39 -5,93 -5,93 Cosco Shipping 27.06.16 4.07.16 7 77,51 80,13 74,90 -2,61 -3,37 11.07.16 18.07.16 7 80,09 85,06 75,12 -4,97 -6,20 25.07.16 15.08.16 21 83,18 81,47 84,92 1,74 2,10 -7,46 Haitong Secs 11.01.16 6.06.16 147 224,87 252,66 197,09 -27,78 -12,36 -12,36 Shenzhen Goodix Tech 29.03.21 22.11.21 238 1.790,78 2.031,21 1.550,34 -240,43 -13,43 -13,43 San’an Optoelectron 28.01.19 11.02.19 14 160,09 196,01 124,16 -35,92 -22,44 -22,44
Anmerkungen
23.02.24 SSE 50 Komponenten-Aktualisierung: Bank of China, Beijing Kingsoft, China CSSC, China Railway, China 28.07.17 SSE 50 Komponenten-Karussell 28.12.16 SSE 50 Beijing Xinwei, Dongxing Secs, Founder Secs, Shandong Gold und Tsinghua Tongfang 29.12.15 SSE 50 vollständige Analyse 28.12.15 SSE 50 CNNP, GD Power Development, Guotai Junan, New China Life und PowerChina ersetzen 28.08.15 SSE 50 vollständige Analyse 27.07.15 Ping An Ins Aktien-Split 10:20 (zwanzig für zehn) 17.07.15 Kweichow Moutai Aktien-Split 10:11 (elf für zehn) 16.07.15 Qingdao Haier Aktien-Split 10:20 (zwanzig für zehn) 11.05.15 China Northern Rare Aktien-Split 10:15 (fünfzehn für zehn) 6.06.13 NARI Technology Aktien-Split 10:15 (fünfzehn für zehn)
Anmerkung verfassen