Samstag, 20. Juni 2026, 7:58UTC
Auswertung - Dow Jones Industrial Avgerage in Euro - 1.07.24 - RS = 19
⇐
⇓ jüngster
⇓ 1.07.24
⇓ 19.02.24
K-Diff
Δ19
⇓
DJIA
36.692,397
12.08.24
-0,36
36.517,591
0,48
35.835,352
682,239
1,90
8,30
L
Goldman Sachs
452,630
12.08.24
-0,97
432,269
4,71
356,647
75,622
21,20
28,24
L
Apple
202,802
12.08.24
0,71
202,075
0,36
169,130
32,946
19,48
19,24
L
Walmart
64,049
12.08.24
1,10
62,911
1,81
52,681
10,230
19,42
22,03
JP Morgan Chase
192,230
12.08.24
0,19
191,540
0,36
166,087
25,453
15,33
25,36
Microsoft
379,268
12.08.24
0,19
425,808
-10,93
374,848
50,960
13,59
24,01
L
3M
115,008
12.08.24
-0,65
93,798
22,61
84,653
9,145
10,80
3,12
American Express
221,001
12.08.24
-0,34
217,980
1,39
197,193
20,787
10,54
27,96
L
Amgen
298,335
12.08.24
-0,77
289,954
2,89
263,190
26,764
10,17
14,97
L
Honeywell
183,467
12.08.24
-0,73
196,668
-6,71
182,915
13,753
7,52
8,29
L
Coca-Cola
63,555
12.08.24
-0,74
58,996
7,73
55,096
3,899
7,08
7,28
L
Procter & Gamble
155,516
12.08.24
-2,19
151,703
2,51
146,123
5,581
3,82
6,26
Verizon
37,786
12.08.24
-0,54
38,914
-2,90
37,563
1,351
3,60
13,95
Caterpillar
313,280
12.08.24
-0,66
306,800
2,11
298,637
8,163
2,73
13,92
Chevron
135,202
12.08.24
0,02
145,923
-7,35
143,451
2,472
1,72
1,55
Merck (MSD)
105,797
12.08.24
-0,93
119,241
-11,27
118,551
0,689
0,58
12,61
S
Cisco Systems
41,823
12.08.24
-1,34
44,303
-5,60
44,938
-0,635
-1,41
-5,13
Dow
48,685
12.08.24
-0,84
49,067
-0,78
51,469
-2,402
-4,67
-1,94
S
UnitedHealth
527,018
12.08.24
1,17
461,161
14,28
483,844
-22,684
-4,69
-1,17
Visa
242,295
12.08.24
0,05
245,418
-1,27
258,421
-13,003
-5,03
3,39
S
Johnson & Johnson
149,056
12.08.24
-0,46
136,526
9,18
145,232
-8,707
-5,99
-5,70
IBM
176,652
12.08.24
-1,03
163,245
8,21
174,074
-10,829
-6,22
11,03
Travelers Companies
195,531
12.08.24
-1,29
189,228
3,33
201,803
-12,575
-6,23
8,72
Home Depot
322,397
12.08.24
-0,81
313,429
2,86
336,154
-22,725
-6,76
2,43
Boeing
153,018
12.08.24
-2,25
174,060
-12,09
189,150
-15,090
-7,98
-7,20
⇓ jüngster
⇓ 1.07.24
⇓ 19.02.24
K-Diff
Δ19
⇓
S
salesforce.com
234,295
12.08.24
-0,48
238,864
-1,91
268,774
-29,911
-11,13
5,92
Walt Disney
80,131
12.08.24
-0,30
91,402
-12,33
103,532
-12,129
-11,72
4,16
S
McDonald´s
251,217
12.08.24
0,58
233,065
7,79
270,908
-37,843
-13,97
-9,46
Nike
69,587
12.08.24
0,40
71,628
-2,85
96,027
-24,398
-25,41
-23,50
S
Intel
18,049
12.08.24
-1,78
28,752
-37,22
40,364
-11,612
-28,77
-17,28
S
Walgreens Boots
9,509
12.08.24
-4,49
10,796
-11,92
20,391
-9,595
-47,05
-46,23
DJIA - 30 von 30 Wertpapieren bewertet - 1.07.24 / 19.02.24 - 15 davon sind besser, Markt-Kennzahl(19) in EUR = 50,00 % Börsenplatz-Währung: USD $ Dollar
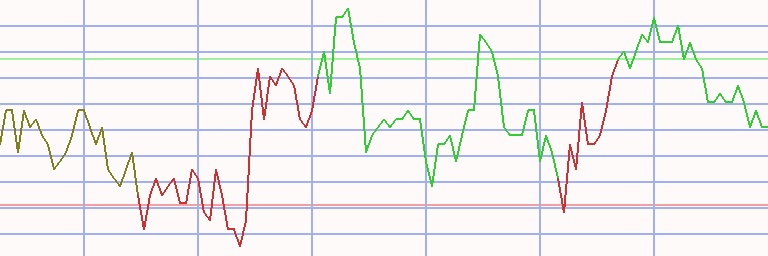
Technischer Chart
Transaktionen Dow Jones Industrial Avgerage in Euro * S19 - 20/77 (1)
⇐ L/S K-Datum V-Datum Tage Wertpapier Spl Stück K-Kurs V-Kurs S-V-Kurs K-Diff D % Kapital Rdte
2.01.06 4.02.08 763 - cash -
short
4.02.08
29.06.09
511
American Express
100
310
32,196
17,072
60,719
28,522
89
18.842
57
29.06.09 23.08.10 420 - cash -
23.08.10
4.10.10
42
Microsoft
100
986
19,103
17,336
21,050
1,947
10
20.762
132
4.10.10 22.08.11 322 - cash -
22.08.11
19.12.11
119
Goldman Sachs
100
280
73,991
67,244
81,415
7,424
10
22.840
34
19.12.11 24.08.15 1344 - cash -
24.08.15
30.05.16
280
Chevron
100
367
62,119
91,551
32,686
-29,433
-47
12.039
-57
30.05.16 24.12.18 938 - cash -
24.12.18
22.04.19
119
Goldman Sachs
100
87
136,947
181,665
92,230
-44,718
-33
8.148
-70
22.04.19 9.03.20 322 - cash -
9.03.20
20.07.20
133
Exxon Mobil
100
223
36,506
37,145
35,867
-0,639
-2
8.006
-5
20.07.20 20.06.22 700 - cash -
20.06.22
16.01.23
210
Walt Disney
100
89
89,623
91,886
87,361
-2,262
-3
7.804
-4
16.01.23 30.10.23 287 - cash -
30.10.23
8.01.24
70
Walgreens Boots
100
392
19,880
23,369
16,391
-3,489
-18
6.437
-63
8.01.24 20.06.26 894 - cash -
kum 4.02.08
8.01.24 1484
Tage von 7474 investiert (20%)
-36
6.437
-10
Anteil der Einzelwerte
Wertpapier L/S K-Datum V-Datum Tage K-Kurs V-Kurs S-V-Kurs K-Diff D % Summe American Express short 4.02.08 29.06.09 511 32,20 17,07 60,72 28,52 88,59 88,59 Microsoft 23.08.10 4.10.10 42 19,10 17,34 21,05 1,95 10,19 10,19 Exxon Mobil 9.03.20 20.07.20 133 36,51 37,15 35,87 -0,64 -1,75 -1,75 Walt Disney 20.06.22 16.01.23 210 89,62 91,89 87,36 -2,26 -2,52 -2,52 Walgreens Boots 30.10.23 8.01.24 70 19,88 23,37 16,39 -3,49 -17,55 -17,55 Goldman Sachs 22.08.11 19.12.11 119 73,99 67,24 81,41 7,42 10,03 24.12.18 22.04.19 119 136,95 181,66 92,23 -44,72 -32,65 -25,90 Chevron 24.08.15 30.05.16 280 62,12 91,55 32,69 -29,43 -47,38 -47,38
Anmerkungen
26.02.24 Walmart Aktiensplit 1:3 (drei für eine) 26.06.18 DJIA Walgreens Boots ersetzt General Electric 24.12.15 Nike Aktien-Split 1:2 (zwei für eine) 8.07.15 DJIA Der Dow Jones ist irgendwie Analyse- und Regel-resistent, auch bei Analyse für austauschende Verfahren 19.03.15 Visa ex Split 1:4 18.03.15 DJIA Apple ersetzt AT&T 23.09.13 DJIA Goldman Sachs, Nike und Visa ersetzen Alcoa, Bank of America und Hewlett-Packard
Anmerkung verfassen