| | |
| | |

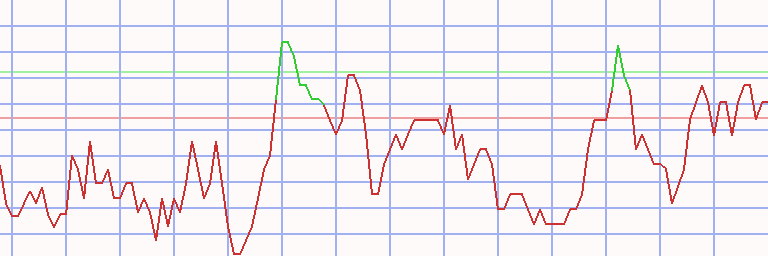
Auswertung - German Entrepreneurial Index GEX in Yen - 1.07.24 - RS = 9
⇐
| |
|
⇓Wertpapier |
jüngster |
⇓ ΔTag |
1.07.24 |
⇓ ΔWo |
29.04.24 |
K-Diff |
⇓ Δ9 |
|
∅-RS |
| |  |
 |
 |
|
L |
 |
GEX PR |
291.796,947 |
12.08.24 |
1,31 |
308.082,699 |
-5,29 |
296.916,235 |
11.166,464 |
3,76 |
|
5,07 |
| | |
|
|
|
L |
|
Multitude |
956,660 |
12.08.24 |
-0,72 |
1.050,246 |
-8,91 |
893,499 |
156,747 |
17,54 |
|
63,90 |
| | |
|
|
|
|
|
Serviceware |
2.235,673 |
12.08.24 |
-3,01 |
2.079,696 |
7,50 |
1.957,667 |
122,029 |
6,23 |
|
28,45 |
| | |
|
|
|
L |
|
DFV |
1.074,510 |
12.08.24 |
-0,80 |
1.256,483 |
-14,48 |
945,369 |
311,114 |
32,91 |
|
17,70 |
| | |
|
|
|
|
|
Mutares |
5.415,875 |
12.08.24 |
0,16 |
6.048,449 |
-10,46 |
7.086,087 |
-1.037,638 |
-14,64 |
|
24,46 |
| | |
|
|
|
|
|
Knorr-Bremse |
12.270,206 |
12.08.24 |
1,36 |
12.278,872 |
-0,07 |
11.720,906 |
557,966 |
4,76 |
|
23,01 |
| | |
|
|
|
L |
|
AUTO1 |
1.408,128 |
12.08.24 |
0,18 |
1.100,506 |
27,95 |
810,842 |
289,663 |
35,72 |
|
21,87 |
| | |
|
|
|
|
|
Stemmer Imaging |
8.336,115 |
12.08.24 |
-0,21 |
6.013,788 |
38,62 |
5.655,484 |
358,304 |
6,34 |
|
18,63 |
| | |
|
|
|
L |
|
Knaus Tabbert |
5.554,521 |
12.08.24 |
-1,69 |
6.793,674 |
-18,24 |
7.328,704 |
-535,030 |
-7,30 |
|
-8,39 |
| | |
|
|
|
L |
|
Nagarro |
13.154,077 |
12.08.24 |
-0,20 |
13.370,712 |
-1,62 |
12.130,845 |
1.239,867 |
10,22 |
|
6,04 |
| | |
|
|
|
L |
|
Dermapharm |
6.091,776 |
12.08.24 |
0,29 |
6.204,426 |
-1,82 |
5.270,643 |
933,783 |
17,72 |
|
-0,96 |
| | |
|
|
|
|
|
elumeo |
391,676 |
12.08.24 |
-0,88 |
412,473 |
-5,04 |
384,841 |
27,632 |
7,18 |
|
-0,04 |
| | |
|
|
|
S |
|
Porsche |
11.382,869 |
12.08.24 |
-0,97 |
12.020,643 |
-5,31 |
14.603,864 |
-2.583,221 |
-17,69 |
|
-15,22 |
| | |
|
|
|
S |
|
SMA Solar |
3.795,445 |
12.08.24 |
-1,26 |
4.589,196 |
-17,30 |
8.525,056 |
-3.935,860 |
-46,17 |
|
-51,12 |
| | |
|
|
|
|
|
Varta |
625,642 |
12.08.24 |
41,68 |
1.489,582 |
-58,00 |
1.557,768 |
-68,186 |
-4,38 |
|
-41,75 |
| | |
|
|
|
S |
|
creditshelf |
8,665 |
12.08.24 |
|
8,665 |
|
84,498 |
-75,832 |
-89,74 |
|
-85,90 |
| GEX - 15 von 15 Wertpapieren bewertet - 1.07.24 / 29.04.24 - 9 davon sind besser, Markt-Kennzahl(9) in JPY = 60,00 % |
| Börsenplatz-Währung: EUR € Euro |
Technischer Chart
Transaktionen German Entrepreneurial Index GEX in Yen * L9 - 72/54 (1)
|
⇐ |
| |
| L/S | K-Datum | V-Datum | Tage | | Wertpapier | Spl | Stück | | K-Kurs | V-Kurs | | K-Diff | D % | Kapital | Rdte | |
| 2.01.06 |
8.01.07 |
371 |
|
- cash - |
| long |
8.01.07 |
5.03.07 |
56 |
|
|
|
Drägerwerk |
100 |
1 |
|
8.800,533 |
9.342,247 |
|
541,714 |
6 |
10.542 |
48 |
|
| 5.03.07 |
19.05.08 |
441 |
|
- cash - |
| |
19.05.08 |
23.06.08 |
35 |
|
|
|
Manz |
100 |
0 |
|
28.545,052 |
28.645,920 |
|
100,868 |
0 |
10.542 |
0 |
|
| 23.06.08 |
20.04.09 |
301 |
|
- cash - |
| |
20.04.09 |
20.07.09 |
91 |
|
|
|
Patrizia Immobilien |
100 |
38 |
|
275,537 |
431,958 |
|
156,421 |
57 |
16.486 |
507 |
|
| 20.07.09 |
7.09.09 |
49 |
|
- cash - |
| |
7.09.09 |
16.11.09 |
70 |
|
|
|
Patrizia Immobilien |
100 |
36 |
|
457,279 |
512,947 |
|
55,668 |
12 |
18.490 |
82 |
|
| 16.11.09 |
5.04.10 |
140 |
|
- cash - |
| |
5.04.10 |
3.05.10 |
28 |
|
|
|
YOC |
100 |
3 |
|
4.812,502 |
4.190,947 |
|
-621,555 |
-13 |
16.625 |
-84 |
|
| 3.05.10 |
26.07.10 |
84 |
|
- cash - |
| |
26.07.10 |
23.08.10 |
28 |
|
|
|
YOC |
100 |
4 |
|
3.480,759 |
3.741,031 |
|
260,272 |
7 |
17.666 |
156 |
|
| 23.08.10 |
13.09.10 |
21 |
|
- cash - |
| |
13.09.10 |
29.11.10 |
77 |
|
|
|
YOC |
100 |
4 |
|
4.023,357 |
3.899,094 |
|
-124,263 |
-3 |
17.169 |
-14 |
|
| 29.11.10 |
31.01.11 |
63 |
|
- cash - |
| |
31.01.11 |
7.03.11 |
35 |
|
|
|
InVision |
100 |
9 |
|
1.798,853 |
2.637,282 |
|
838,429 |
47 |
24.715 |
5.305 |
|
| 7.03.11 |
23.01.12 |
322 |
|
- cash - |
| |
23.01.12 |
9.04.12 |
77 |
|
|
|
Delticom |
100 |
3 |
|
7.596,428 |
8.169,298 |
|
572,870 |
8 |
26.434 |
41 |
|
| 9.04.12 |
21.01.13 |
287 |
|
- cash - |
| |
21.01.13 |
1.04.13 |
70 |
|
|
|
MBB |
100 |
12 |
|
2.081,653 |
2.221,380 |
|
139,727 |
7 |
28.110 |
40 |
|
| 1.04.13 |
26.08.13 |
147 |
|
- cash - |
| |
26.08.13 |
16.12.13 |
112 |
|
|
|
Manz |
100 |
4 |
|
6.516,873 |
8.442,999 |
|
1.926,126 |
30 |
35.815 |
133 |
|
| 16.12.13 |
6.01.14 |
21 |
|
- cash - |
| |
6.01.14 |
27.01.14 |
21 |
|
|
|
ZhongDe Waste Tech |
100 |
53 |
|
673,303 |
659,697 |
|
-13,606 |
-2 |
35.094 |
-30 |
|
| 27.01.14 |
17.02.14 |
21 |
|
- cash - |
| |
17.02.14 |
17.03.14 |
28 |
|
|
|
ZhongDe Waste Tech |
100 |
58 |
|
604,817 |
538,442 |
|
-66,374 |
-11 |
31.244 |
-78 |
|
| 17.03.14 |
15.12.14 |
273 |
|
- cash - |
| |
15.12.14 |
18.05.15 |
154 |
|
|
|
Ströer Media |
100 |
9 |
|
3.229,708 |
4.901,896 |
|
1.672,188 |
52 |
46.294 |
169 |
|
| 18.05.15 |
26.10.15 |
161 |
|
- cash - |
| |
26.10.15 |
4.01.16 |
70 |
|
|
|
Hypoport |
100 |
6 |
|
7.349,837 |
9.767,058 |
|
2.417,220 |
33 |
60.797 |
340 |
|
| 4.01.16 |
21.03.16 |
77 |
|
- cash - |
| |
21.03.16 |
25.04.16 |
35 |
|
|
|
Verbio |
100 |
64 |
|
948,821 |
1.050,099 |
|
101,277 |
11 |
67.279 |
188 |
|
| 25.04.16 |
9.01.17 |
259 |
|
- cash - |
| |
9.01.17 |
17.04.17 |
98 |
|
|
|
MBB |
100 |
7 |
|
9.077,144 |
9.458,436 |
|
381,291 |
4 |
69.948 |
17 |
|
| 17.04.17 |
8.05.17 |
21 |
|
- cash - |
| |
8.05.17 |
3.07.17 |
56 |
|
|
|
MBB |
100 |
6 |
|
11.125,082 |
12.085,944 |
|
960,862 |
9 |
75.713 |
72 |
|
| 3.07.17 |
11.09.17 |
70 |
|
- cash - |
| |
11.09.17 |
13.11.17 |
63 |
|
|
|
Bauer |
100 |
19 |
|
3.883,067 |
3.758,694 |
|
-124,373 |
-3 |
73.350 |
-17 |
|
| 13.11.17 |
15.01.18 |
63 |
|
- cash - |
| |
15.01.18 |
5.02.18 |
21 |
|
|
|
Viscom |
100 |
15 |
|
4.761,385 |
4.453,812 |
|
-307,573 |
-6 |
68.736 |
-69 |
|
| 5.02.18 |
25.02.19 |
385 |
|
- cash - |
| |
25.02.19 |
24.06.19 |
119 |
|
|
|
Varta |
100 |
15 |
|
4.516,850 |
6.257,152 |
|
1.740,302 |
39 |
94.841 |
172 |
|
| 24.06.19 |
6.01.20 |
196 |
|
- cash - |
| |
6.01.20 |
24.02.20 |
49 |
|
|
|
Varta |
100 |
6 |
|
14.407,232 |
9.379,498 |
|
-5.027,735 |
-35 |
64.674 |
-96 |
|
| 24.02.20 |
18.05.20 |
84 |
|
- cash - |
| |
18.05.20 |
22.06.20 |
35 |
|
|
|
Sixt Leasing |
100 |
30 |
|
2.154,035 |
2.069,951 |
|
-84,084 |
-4 |
62.152 |
-34 |
|
| 22.06.20 |
28.12.20 |
189 |
|
- cash - |
| |
28.12.20 |
29.03.21 |
91 |
|
|
|
Akasol |
100 |
4 |
|
13.107,654 |
15.440,476 |
|
2.332,822 |
18 |
71.483 |
93 |
|
| 29.03.21 |
28.11.22 |
609 |
|
- cash - |
| |
28.11.22 |
23.01.23 |
56 |
|
|
|
SMA Solar |
100 |
8 |
|
8.665,536 |
11.026,718 |
|
2.361,182 |
27 |
90.373 |
381 |
|
| L/S | K-Datum | V-Datum | Tage | | Wertpapier | Spl | Stück | | K-Kurs | V-Kurs | | K-Diff | D % | Kapital | Rdte | |
| 23.01.23 |
1.01.24 |
343 |
|
- cash - |
| |
1.01.24 |
22.01.24 |
21 |
|
|
|
Mutares |
100 |
16 |
|
5.544,454 |
5.554,856 |
|
10,402 |
0 |
90.539 |
3 |
|
| 22.01.24 |
8.11.26 |
1021 |
|
- cash - |
| kum | 8.01.07 |
22.01.24 | 1596 |
Tage von 7615 investiert (21%) |
805 |
90.539 |
66 |
|
Anteil der Einzelwerte
| Wertpapier | L/S | K-Datum | V-Datum | Tage | K-Kurs | V-Kurs | | K-Diff | D % | | | Summe |
| Patrizia Immobilien | long | 20.04.09 | 20.07.09 | 91 | 275,54 | 431,96 | | 156,42 | 56,77 | | | |
| | | 7.09.09 | 16.11.09 | 70 | 457,28 | 512,95 | | 55,67 | 12,17 | | | 75,85 |
| Ströer Media | | 15.12.14 | 18.05.15 | 154 | 3.229,71 | 4.901,90 | | 1.672,19 | 51,78 | | | 51,78 |
| InVision | | 31.01.11 | 7.03.11 | 35 | 1.798,85 | 2.637,28 | | 838,43 | 46,61 | | | 46,61 |
| Hypoport | | 26.10.15 | 4.01.16 | 70 | 7.349,84 | 9.767,06 | | 2.417,22 | 32,89 | | | 32,89 |
| Manz | | 19.05.08 | 23.06.08 | 35 | 28.545,05 | 28.645,92 | | 100,87 | 0,35 | | | |
| | | 26.08.13 | 16.12.13 | 112 | 6.516,87 | 8.443,00 | | 1.926,13 | 29,56 | | | 30,01 |
| SMA Solar | | 28.11.22 | 23.01.23 | 56 | 8.665,54 | 11.026,72 | | 2.361,18 | 27,25 | | | 27,25 |
| MBB | | 21.01.13 | 1.04.13 | 70 | 2.081,65 | 2.221,38 | | 139,73 | 6,71 | | | |
| | | 9.01.17 | 17.04.17 | 98 | 9.077,14 | 9.458,44 | | 381,29 | 4,20 | | | |
| | | 8.05.17 | 3.07.17 | 56 | 11.125,08 | 12.085,94 | | 960,86 | 8,64 | | | 20,80 |
| Akasol | | 28.12.20 | 29.03.21 | 91 | 13.107,65 | 15.440,48 | | 2.332,82 | 17,80 | | | 17,80 |
| Verbio | | 21.03.16 | 25.04.16 | 35 | 948,82 | 1.050,10 | | 101,28 | 10,67 | | | 10,67 |
| Delticom | | 23.01.12 | 9.04.12 | 77 | 7.596,43 | 8.169,30 | | 572,87 | 7,54 | | | 7,54 |
| Drägerwerk | | 8.01.07 | 5.03.07 | 56 | 8.800,53 | 9.342,25 | | 541,71 | 6,16 | | | 6,16 |
| Mutares | | 1.01.24 | 22.01.24 | 21 | 5.544,45 | 5.554,86 | | 10,40 | 0,19 | | | 0,19 |
| Bauer | | 11.09.17 | 13.11.17 | 63 | 3.883,07 | 3.758,69 | | -124,37 | -3,20 | | | -3,20 |
| Sixt Leasing | | 18.05.20 | 22.06.20 | 35 | 2.154,03 | 2.069,95 | | -84,08 | -3,90 | | | -3,90 |
| Viscom | | 15.01.18 | 5.02.18 | 21 | 4.761,39 | 4.453,81 | | -307,57 | -6,46 | | | -6,46 |
| YOC | | 5.04.10 | 3.05.10 | 28 | 4.812,50 | 4.190,95 | | -621,55 | -12,92 | | | |
| | | 26.07.10 | 23.08.10 | 28 | 3.480,76 | 3.741,03 | | 260,27 | 7,48 | | | |
| | | 13.09.10 | 29.11.10 | 77 | 4.023,36 | 3.899,09 | | -124,26 | -3,09 | | | -9,29 |
| Varta | | 25.02.19 | 24.06.19 | 119 | 4.516,85 | 6.257,15 | | 1.740,30 | 38,53 | | | |
| | | 6.01.20 | 24.02.20 | 49 | 14.407,23 | 9.379,50 | | -5.027,73 | -34,90 | | | -9,81 |
| ZhongDe Waste Tech | | 6.01.14 | 27.01.14 | 21 | 673,30 | 659,70 | | -13,61 | -2,02 | | | |
| | | 17.02.14 | 17.03.14 | 28 | 604,82 | 538,44 | | -66,37 | -10,97 | | | -12,77 |
Anmerkungen
| 21.02.24 | GEX | | | Komponenten-Aktualisierung: The Social Chain (Insolvenz) und va-Q-tec (Übernahme durch EQT)
verlassen den Index |
| 10.02.17 | GEX | | | Maschinelles Lernen für alle Verfahren durchgeführt |
| 6.02.17 | GEX | | | Implementierung |
| 21.06.15 | Ferratum | | | Neuaufnahme |
|
|