| | Sonntag, 8. November 2026, 16:20UTC |
| | |

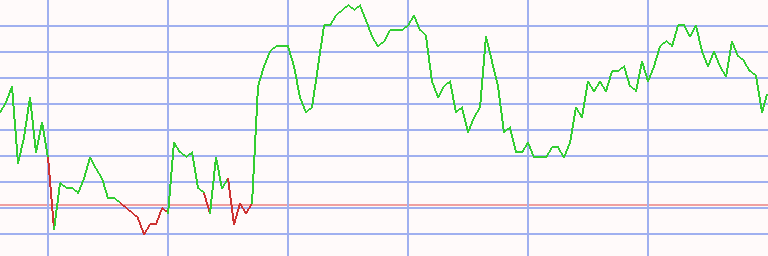
Auswertung - Euro STOXX 50 in Yen - 1.07.24 - RS = 20
⇐
| |
|
⇓Wertpapier |
jüngster |
⇓ ΔTag |
1.07.24 |
⇓ ΔWo |
12.02.24 |
K-Diff |
⇓ Δ20 |
|
∅-RS |
| |  |
 |
 |
|
|
 |
Euro Stoxx 50 |
809.674,179 |
12.08.24 |
-0,07 |
854.406,707 |
-5,24 |
763.934,525 |
90.472,182 |
11,84 |
|
17,13 |
| | |
|
|
|
|
|
ASML |
135.977,457 |
12.08.24 |
0,08 |
165.387,824 |
-17,78 |
141.251,475 |
24.136,349 |
17,09 |
|
47,29 |
| | |
|
|
|
|
|
Unicredit |
5.991,258 |
12.08.24 |
0,38 |
6.274,616 |
-4,52 |
4.759,351 |
1.515,266 |
31,84 |
|
48,59 |
| | |
|
|
|
|
|
Schneider Electric |
36.611,315 |
12.08.24 |
0,38 |
39.054,958 |
-6,26 |
31.398,516 |
7.656,442 |
24,38 |
|
36,22 |
| | |
|
|
|
|
|
SAP |
32.807,204 |
12.08.24 |
-0,33 |
32.179,829 |
1,95 |
27.001,308 |
5.178,522 |
19,18 |
|
38,60 |
| | |
|
|
|
|
|
Intesa Sanpaolo |
601,465 |
12.08.24 |
0,54 |
620,703 |
-3,10 |
454,448 |
166,255 |
36,58 |
|
39,52 |
| | |
|
|
|
|
|
Inditex |
7.668,879 |
12.08.24 |
0,07 |
7.954,837 |
-3,59 |
6.344,728 |
1.610,109 |
25,38 |
|
29,53 |
| | |
|
|
|
|
|
Safran |
33.309,798 |
12.08.24 |
-0,18 |
35.025,547 |
-4,90 |
28.160,162 |
6.865,385 |
24,38 |
|
30,19 |
| | |
|
|
|
|
|
Wolters Kluwer |
25.996,200 |
12.08.24 |
0,20 |
26.611,443 |
-2,31 |
22.895,422 |
3.716,021 |
16,23 |
|
29,21 |
| | |
|
|
|
|
|
Ferrari |
66.844,896 |
12.08.24 |
|
66.238,318 |
0,92 |
58.007,101 |
8.231,217 |
14,19 |
|
26,47 |
| | |
|
|
|
L |
|
Münchener Rück |
76.116,874 |
12.08.24 |
1,01 |
80.917,505 |
-5,93 |
65.394,798 |
15.522,708 |
23,74 |
|
29,34 |
| | |
|
|
|
|
|
Adidas |
36.810,619 |
12.08.24 |
-1,03 |
38.041,106 |
-3,23 |
28.044,276 |
9.996,830 |
35,65 |
|
27,01 |
| | |
|
|
|
|
|
ING Groep |
2.639,827 |
12.08.24 |
0,21 |
2.834,972 |
-6,88 |
1.975,847 |
859,126 |
43,48 |
|
31,37 |
| | |
|
|
|
|
|
Saint-Gobain |
12.748,536 |
12.08.24 |
-0,41 |
12.911,446 |
-1,26 |
11.128,221 |
1.783,225 |
16,02 |
|
27,57 |
| | |
|
|
|
L |
|
Prosus |
5.693,168 |
12.08.24 |
1,77 |
5.739,094 |
-0,80 |
4.781,884 |
957,211 |
20,02 |
|
21,60 |
| | |
|
|
|
|
|
Banco Santander |
708,656 |
12.08.24 |
-0,24 |
770,787 |
-8,06 |
596,327 |
174,460 |
29,26 |
|
24,98 |
| | |
|
|
|
|
|
EssilorLuxottica |
35.926,748 |
12.08.24 |
-0,58 |
34.973,554 |
2,73 |
30.741,832 |
4.231,722 |
13,77 |
|
18,25 |
| | |
|
|
|
|
|
Banco Bilbao Viz |
1.546,601 |
12.08.24 |
0,27 |
1.646,426 |
-6,06 |
1.488,806 |
157,620 |
10,59 |
|
22,87 |
| | |
|
|
|
|
|
Adyen |
190.292,184 |
12.08.24 |
1,14 |
192.926,466 |
-1,37 |
242.554,664 |
-49.628,198 |
-20,46 |
|
9,86 |
| | |
|
|
|
|
|
Siemens |
27.244,018 |
12.08.24 |
0,01 |
30.696,313 |
-11,25 |
26.579,613 |
4.116,700 |
15,49 |
|
22,71 |
| | |
|
|
|
|
|
Allianz |
44.349,517 |
12.08.24 |
|
45.493,350 |
-2,51 |
39.634,430 |
5.858,920 |
14,78 |
|
18,63 |
| | |
|
|
|
L |
|
Infineon |
5.247,766 |
12.08.24 |
0,36 |
5.955,729 |
-11,89 |
5.515,020 |
440,709 |
7,99 |
|
9,80 |
| | |
|
|
|
L |
|
Nordea Bank |
1.805,869 |
12.08.24 |
-0,19 |
1.978,311 |
-8,72 |
1.727,981 |
250,330 |
14,49 |
|
15,63 |
| | |
|
|
|
L |
|
Iberdrola |
2.097,893 |
12.08.24 |
0,29 |
2.135,155 |
-1,75 |
1.735,867 |
399,287 |
23,00 |
|
18,47 |
| | |
|
|
|
L |
|
Deutsche Telekom |
4.285,907 |
12.08.24 |
0,49 |
4.103,933 |
4,43 |
3.582,792 |
521,142 |
14,55 |
|
20,25 |
| |
|
⇓Wertpapier |
jüngster |
⇓ ΔTag |
1.07.24 |
⇓ ΔWo |
12.02.24 |
K-Diff |
⇓ Δ20 |
|
∅-RS |
| | |
|
|
|
|
|
Deutsche Börse |
32.087,976 |
12.08.24 |
0,54 |
33.015,174 |
-2,81 |
30.194,595 |
2.820,579 |
9,34 |
|
16,91 |
| | |
|
|
|
|
|
L´Oreal |
65.276,458 |
12.08.24 |
-1,59 |
71.446,223 |
-8,64 |
68.992,075 |
2.454,148 |
3,56 |
|
4,76 |
| | |
|
|
|
|
|
Vivendi |
1.644,346 |
12.08.24 |
0,40 |
1.711,243 |
-3,91 |
1.681,144 |
30,100 |
1,79 |
|
16,57 |
| | |
|
|
|
|
|
Airbus |
23.181,678 |
12.08.24 |
-0,45 |
22.814,265 |
1,61 |
24.136,362 |
-1.322,097 |
-5,48 |
|
0,51 |
| | |
|
|
|
|
|
Danone |
10.422,743 |
12.08.24 |
0,07 |
9.999,872 |
4,23 |
9.819,682 |
180,190 |
1,83 |
|
8,29 |
| | |
|
|
|
|
|
TotalEnergies |
10.696,570 |
12.08.24 |
0,60 |
11.024,122 |
-2,97 |
9.628,149 |
1.395,973 |
14,50 |
|
12,72 |
| | |
|
|
|
|
|
Enel |
1.115,757 |
12.08.24 |
0,44 |
1.145,046 |
-2,56 |
952,353 |
192,693 |
20,23 |
|
14,95 |
| | |
|
|
|
L |
|
Nokia |
609,611 |
12.08.24 |
1,05 |
635,954 |
-4,14 |
541,201 |
94,753 |
17,51 |
|
17,25 |
| | |
|
|
|
|
|
Anheuser-Busch InBev |
9.566,602 |
12.08.24 |
-0,47 |
9.434,888 |
1,40 |
9.632,977 |
-198,090 |
-2,06 |
|
6,52 |
| | |
|
|
|
|
|
Axa |
5.606,514 |
12.08.24 |
-0,77 |
5.417,608 |
3,49 |
4.929,960 |
487,648 |
9,89 |
|
12,92 |
| | |
|
|
|
L |
|
Ahold Delhaize |
5.150,714 |
12.08.24 |
-0,30 |
4.845,692 |
6,29 |
4.237,061 |
608,630 |
14,36 |
|
6,90 |
| | |
|
|
|
|
|
BNP Paribas |
10.268,499 |
12.08.24 |
|
10.687,904 |
-3,92 |
8.718,770 |
1.969,135 |
22,59 |
|
10,35 |
| | |
|
|
|
S |
|
BASF |
7.154,154 |
12.08.24 |
-0,22 |
7.693,142 |
-7,01 |
7.213,869 |
479,273 |
6,64 |
|
3,94 |
| | |
|
|
|
S |
|
Stellantis |
2.422,846 |
12.08.24 |
-0,57 |
3.229,421 |
-24,98 |
3.643,953 |
-414,532 |
-11,38 |
|
2,05 |
| | |
|
|
|
S |
|
Mercedes-Benz |
9.961,744 |
12.08.24 |
-0,57 |
11.230,358 |
-11,30 |
10.566,499 |
663,860 |
6,28 |
|
5,02 |
| | |
|
|
|
|
|
Sanofi |
16.580,376 |
12.08.24 |
-0,60 |
15.918,340 |
4,16 |
13.853,139 |
2.065,201 |
14,91 |
|
7,50 |
| | |
|
|
|
S |
|
LVMH |
110.067,911 |
12.08.24 |
-0,14 |
123.395,296 |
-10,80 |
132.286,449 |
-8.891,153 |
-6,72 |
|
0,59 |
| | |
|
|
|
S |
|
Air Liquide |
28.127,888 |
12.08.24 |
-0,79 |
28.183,347 |
-0,20 |
27.072,126 |
1.111,221 |
4,10 |
|
2,26 |
| | |
|
|
|
S |
|
Eni |
2.505,340 |
12.08.24 |
1,09 |
2.518,512 |
-0,52 |
2.323,825 |
194,687 |
8,38 |
|
7,28 |
| | |
|
|
|
S |
|
Volkswagen |
16.204,298 |
12.08.24 |
-0,47 |
18.379,313 |
-11,83 |
19.275,612 |
-896,298 |
-4,65 |
|
-0,20 |
| | |
|
|
|
|
|
Deutsche Post |
6.246,020 |
12.08.24 |
-0,36 |
6.675,824 |
-6,44 |
6.797,808 |
-121,984 |
-1,79 |
|
0,22 |
| | |
|
|
|
S |
|
Vinci |
17.790,066 |
12.08.24 |
-0,77 |
17.486,777 |
1,73 |
18.699,403 |
-1.212,626 |
-6,48 |
|
-0,91 |
| | |
|
|
|
S |
|
BMW |
13.687,866 |
12.08.24 |
-0,90 |
15.448,675 |
-11,40 |
16.439,637 |
-990,962 |
-6,03 |
|
-3,91 |
| | |
|
|
|
S |
|
Pernod Ricard |
21.108,914 |
12.08.24 |
-0,33 |
22.001,451 |
-4,06 |
24.955,608 |
-2.954,157 |
-11,84 |
|
-14,81 |
| | |
|
|
|
S |
|
Kering |
43.301,004 |
12.08.24 |
-1,85 |
58.231,488 |
-25,64 |
66.296,129 |
-8.064,641 |
-12,16 |
|
-10,31 |
| |
|
⇓Wertpapier |
jüngster |
⇓ ΔTag |
1.07.24 |
⇓ ΔWo |
12.02.24 |
K-Diff |
⇓ Δ20 |
|
∅-RS |
| | |
|
|
|
L |
|
Bayer |
4.499,076 |
12.08.24 |
-0,04 |
4.535,470 |
-0,80 |
4.558,965 |
-23,495 |
-0,52 |
|
-18,92 |
| Euro 50 - 50 von 50 Wertpapieren bewertet - 1.07.24 / 12.02.24 - 38 davon sind besser, Markt-Kennzahl(20) in JPY = 76,00 % |
| Börsenplatz-Währung: EUR € Euro |
Technischer Chart
Transaktionen Euro STOXX 50 in Yen * S20 - 20 ex 9 (1)
|
⇐ |
| |
| L/S | K-Datum | V-Datum | Tage | | Wertpapier | Spl | Stück | | K-Kurs | V-Kurs | S-V-Kurs | K-Diff | D % | Kapital | Rdte | |
| 2.01.06 |
17.07.06 |
196 |
|
- cash - |
| short |
17.07.06 |
24.07.06 |
7 |
|
|
|
Airbus |
100 |
3 |
|
2.970,520 |
3.179,884 |
2.761,156 |
-209,364 |
-7 |
9.372 |
-98 |
|
| 24.07.06 |
21.01.08 |
546 |
|
- cash - |
| |
21.01.08 |
18.02.08 |
28 |
|
|
|
Safran |
100 |
5 |
|
1.593,240 |
2.073,992 |
1.112,488 |
-480,752 |
-30 |
6.968 |
-99 |
|
| |
18.02.08 |
19.05.08 |
91 |
|
|
|
Infineon |
100 |
8 |
|
776,338 |
1.028,693 |
523,983 |
-252,355 |
-33 |
4.949 |
-79 |
|
| |
19.05.08 |
9.06.08 |
21 |
|
|
|
Nokia |
100 |
1 |
|
2.940,514 |
2.824,283 |
3.061,528 |
121,014 |
4 |
5.070 |
102 |
|
| 9.06.08 |
23.06.08 |
14 |
|
- cash - |
| |
23.06.08 |
30.06.08 |
7 |
|
|
|
Saint-Gobain |
100 |
0 |
|
6.705,826 |
6.660,821 |
6.751,134 |
45,308 |
1 |
5.070 |
0 |
|
| 30.06.08 |
7.07.08 |
7 |
|
- cash - |
| |
7.07.08 |
28.07.08 |
21 |
|
|
|
Saint-Gobain |
100 |
0 |
|
6.189,975 |
6.501,956 |
5.877,994 |
-311,981 |
-5 |
5.070 |
0 |
|
| 28.07.08 |
25.08.08 |
28 |
|
- cash - |
| |
25.08.08 |
1.09.08 |
7 |
|
|
|
Deutsche Börse |
100 |
0 |
|
9.871,777 |
10.200,677 |
9.542,876 |
-328,901 |
-3 |
5.070 |
0 |
|
| 1.09.08 |
8.09.08 |
7 |
|
- cash - |
| |
8.09.08 |
6.10.08 |
28 |
|
|
|
Deutsche Börse |
100 |
0 |
|
10.024,266 |
8.935,551 |
11.245,632 |
1.221,365 |
12 |
5.070 |
0 |
|
| |
6.10.08 |
24.11.08 |
49 |
|
|
|
Mercedes-Benz |
100 |
1 |
|
3.942,368 |
2.864,923 |
5.425,021 |
1.482,653 |
38 |
6.553 |
978 |
|
| |
24.11.08 |
16.03.09 |
112 |
|
|
|
ING Groep |
100 |
11 |
|
582,643 |
334,863 |
1.013,768 |
431,125 |
74 |
11.295 |
508 |
|
| 16.03.09 |
23.03.09 |
7 |
|
- cash - |
| |
23.03.09 |
6.04.09 |
14 |
|
|
|
Infineon |
100 |
122 |
|
92,357 |
135,081 |
49,633 |
-42,724 |
-46 |
6.083 |
-100 |
|
| 6.04.09 |
8.08.11 |
854 |
|
- cash - |
| |
8.08.11 |
15.08.11 |
7 |
|
|
|
Nokia |
100 |
14 |
|
420,413 |
444,932 |
395,893 |
-24,520 |
-6 |
5.740 |
-96 |
|
| 15.08.11 |
22.08.11 |
7 |
|
- cash - |
| |
22.08.11 |
31.10.11 |
70 |
|
|
|
Unicredit |
100 |
1 |
|
3.270,151 |
3.000,873 |
3.563,592 |
293,441 |
9 |
6.033 |
57 |
|
| 31.10.11 |
7.11.11 |
7 |
|
- cash - |
| |
7.11.11 |
26.12.11 |
49 |
|
|
|
Unicredit |
100 |
2 |
|
2.817,627 |
2.210,898 |
3.590,858 |
773,231 |
27 |
7.580 |
509 |
|
| 26.12.11 |
25.06.12 |
182 |
|
- cash - |
| |
25.06.12 |
2.07.12 |
7 |
|
|
|
Nokia |
100 |
43 |
|
172,847 |
165,738 |
180,260 |
7,413 |
4 |
7.898 |
793 |
|
| 2.07.12 |
13.10.14 |
833 |
|
- cash - |
| |
13.10.14 |
3.11.14 |
21 |
|
|
|
Adidas |
100 |
1 |
|
7.565,735 |
8.183,017 |
6.948,454 |
-617,282 |
-8 |
7.281 |
-77 |
|
| 3.11.14 |
24.08.15 |
294 |
|
- cash - |
| |
24.08.15 |
26.10.15 |
63 |
|
|
|
Banco Santander |
100 |
10 |
|
716,359 |
699,539 |
733,585 |
17,225 |
2 |
7.453 |
15 |
|
| 26.10.15 |
21.03.16 |
147 |
|
- cash - |
| |
21.03.16 |
25.04.16 |
35 |
|
|
|
Unicredit |
100 |
3 |
|
2.354,063 |
2.089,042 |
2.652,706 |
298,643 |
13 |
8.349 |
247 |
|
| 25.04.16 |
26.03.18 |
700 |
|
- cash - |
| |
26.03.18 |
2.04.18 |
7 |
|
|
|
Inditex |
100 |
2 |
|
3.238,633 |
3.311,851 |
3.165,415 |
-73,218 |
-2 |
8.203 |
-70 |
|
| 2.04.18 |
15.10.18 |
196 |
|
- cash - |
| |
15.10.18 |
5.11.18 |
21 |
|
|
|
Intesa Sanpaolo |
100 |
30 |
|
264,636 |
254,859 |
274,788 |
10,152 |
4 |
8.507 |
92 |
|
| 5.11.18 |
10.12.18 |
35 |
|
- cash - |
| |
10.12.18 |
21.01.19 |
42 |
|
|
|
Bayer |
100 |
1 |
|
7.817,968 |
8.219,730 |
7.416,206 |
-401,762 |
-5 |
8.106 |
-37 |
|
| 21.01.19 |
9.03.20 |
413 |
|
- cash - |
| |
9.03.20 |
8.06.20 |
91 |
|
|
|
Anheuser-Busch InBev |
100 |
1 |
|
4.999,944 |
6.199,190 |
3.800,698 |
-1.199,246 |
-24 |
6.906 |
-67 |
|
| 8.06.20 |
15.06.20 |
7 |
|
- cash - |
| |
15.06.20 |
22.06.20 |
7 |
|
|
|
Banco Santander |
100 |
26 |
|
260,271 |
256,277 |
264,327 |
4,056 |
2 |
7.012 |
124 |
|
| 22.06.20 |
29.06.20 |
7 |
|
- cash - |
| |
29.06.20 |
6.07.20 |
7 |
|
|
|
Airbus |
100 |
0 |
|
7.665,857 |
8.229,944 |
7.101,770 |
-564,087 |
-7 |
7.012 |
0 |
|
| 6.07.20 |
7.03.22 |
609 |
|
- cash - |
| |
7.03.22 |
14.03.22 |
7 |
|
|
|
Vivendi |
100 |
5 |
|
1.347,655 |
1.519,049 |
1.176,262 |
-171,394 |
-13 |
6.155 |
-100 |
|
| L/S | K-Datum | V-Datum | Tage | | Wertpapier | Spl | Stück | | K-Kurs | V-Kurs | S-V-Kurs | K-Diff | D % | Kapital | Rdte | |
| 14.03.22 |
23.05.22 |
70 |
|
- cash - |
| |
23.05.22 |
20.06.22 |
28 |
|
|
|
Prosus |
100 |
2 |
|
2.788,956 |
3.207,626 |
2.370,287 |
-418,670 |
-15 |
5.318 |
-88 |
|
| |
20.06.22 |
18.07.22 |
28 |
|
|
|
Adyen |
100 |
0 |
|
176.028,593 |
217.590,550 |
134.466,637 |
-41.561,957 |
-24 |
5.318 |
0 |
|
| |
18.07.22 |
25.07.22 |
7 |
|
|
|
Adidas |
100 |
0 |
|
23.188,134 |
24.597,035 |
21.779,232 |
-1.408,901 |
-6 |
5.318 |
0 |
|
| 25.07.22 |
5.09.22 |
42 |
|
- cash - |
| |
5.09.22 |
12.09.22 |
7 |
|
|
|
Adidas |
100 |
0 |
|
20.270,501 |
21.525,283 |
19.015,718 |
-1.254,783 |
-6 |
5.318 |
0 |
|
| 12.09.22 |
3.10.22 |
21 |
|
- cash - |
| |
3.10.22 |
10.10.22 |
7 |
|
|
|
Adidas |
100 |
0 |
|
16.860,158 |
16.140,170 |
17.612,264 |
752,106 |
4 |
5.318 |
0 |
|
| 10.10.22 |
17.10.22 |
7 |
|
- cash - |
| |
17.10.22 |
24.10.22 |
7 |
|
|
|
Adidas |
100 |
0 |
|
17.303,916 |
15.264,136 |
19.616,276 |
2.312,360 |
13 |
5.318 |
0 |
|
| 24.10.22 |
8.11.26 |
1476 |
|
- cash - |
| kum | 17.07.06 |
24.10.22 | 903 |
Tage von 7615 investiert (12%) |
-47 |
5.318 |
-23 |
|
Anteil der Einzelwerte
| Wertpapier | L/S | K-Datum | V-Datum | Tage | K-Kurs | V-Kurs | S-V-Kurs | K-Diff | D % | | | Summe |
| ING Groep | short | 24.11.08 | 16.03.09 | 112 | 582,64 | 334,86 | 1.013,77 | 431,12 | 73,99 | | | 73,99 |
| Unicredit | | 22.08.11 | 31.10.11 | 70 | 3.270,15 | 3.000,87 | 3.563,59 | 293,44 | 8,97 | | | |
| | | 7.11.11 | 26.12.11 | 49 | 2.817,63 | 2.210,90 | 3.590,86 | 773,23 | 27,44 | | | |
| | | 21.03.16 | 25.04.16 | 35 | 2.354,06 | 2.089,04 | 2.652,71 | 298,64 | 12,69 | | | 56,50 |
| Mercedes-Benz | | 6.10.08 | 24.11.08 | 49 | 3.942,37 | 2.864,92 | 5.425,02 | 1.482,65 | 37,61 | | | 37,61 |
| Deutsche Börse | | 25.08.08 | 1.09.08 | 7 | 9.871,78 | 10.200,68 | 9.542,88 | -328,90 | -3,33 | | | |
| | | 8.09.08 | 6.10.08 | 28 | 10.024,27 | 8.935,55 | 11.245,63 | 1.221,37 | 12,18 | | | 8,45 |
| Banco Santander | | 24.08.15 | 26.10.15 | 63 | 716,36 | 699,54 | 733,58 | 17,23 | 2,40 | | | |
| | | 15.06.20 | 22.06.20 | 7 | 260,27 | 256,28 | 264,33 | 4,06 | 1,56 | | | 4,00 |
| Intesa Sanpaolo | | 15.10.18 | 5.11.18 | 21 | 264,64 | 254,86 | 274,79 | 10,15 | 3,84 | | | 3,84 |
| Nokia | | 19.05.08 | 9.06.08 | 21 | 2.940,51 | 2.824,28 | 3.061,53 | 121,01 | 4,12 | | | |
| | | 8.08.11 | 15.08.11 | 7 | 420,41 | 444,93 | 395,89 | -24,52 | -5,83 | | | |
| | | 25.06.12 | 2.07.12 | 7 | 172,85 | 165,74 | 180,26 | 7,41 | 4,29 | | | 2,25 |
| Inditex | | 26.03.18 | 2.04.18 | 7 | 3.238,63 | 3.311,85 | 3.165,42 | -73,22 | -2,26 | | | -2,26 |
| Adidas | | 13.10.14 | 3.11.14 | 21 | 7.565,74 | 8.183,02 | 6.948,45 | -617,28 | -8,16 | | | |
| | | 18.07.22 | 25.07.22 | 7 | 23.188,13 | 24.597,03 | 21.779,23 | -1.408,90 | -6,08 | | | |
| | | 5.09.22 | 12.09.22 | 7 | 20.270,50 | 21.525,28 | 19.015,72 | -1.254,78 | -6,19 | | | |
| | | 3.10.22 | 10.10.22 | 7 | 16.860,16 | 16.140,17 | 17.612,26 | 752,11 | 4,46 | | | |
| | | 17.10.22 | 24.10.22 | 7 | 17.303,92 | 15.264,14 | 19.616,28 | 2.312,36 | 13,36 | | | -4,17 |
| Saint-Gobain | | 23.06.08 | 30.06.08 | 7 | 6.705,83 | 6.660,82 | 6.751,13 | 45,31 | 0,68 | | | |
| | | 7.07.08 | 28.07.08 | 21 | 6.189,98 | 6.501,96 | 5.877,99 | -311,98 | -5,04 | | | -4,40 |
| Bayer | | 10.12.18 | 21.01.19 | 42 | 7.817,97 | 8.219,73 | 7.416,21 | -401,76 | -5,14 | | | -5,14 |
| Vivendi | | 7.03.22 | 14.03.22 | 7 | 1.347,66 | 1.519,05 | 1.176,26 | -171,39 | -12,72 | | | -12,72 |
| Airbus | | 17.07.06 | 24.07.06 | 7 | 2.970,52 | 3.179,88 | 2.761,16 | -209,36 | -7,05 | | | |
| | | 29.06.20 | 6.07.20 | 7 | 7.665,86 | 8.229,94 | 7.101,77 | -564,09 | -7,36 | | | -13,89 |
| Wertpapier | L/S | K-Datum | V-Datum | Tage | K-Kurs | V-Kurs | S-V-Kurs | K-Diff | D % | | | Summe |
| Prosus | | 23.05.22 | 20.06.22 | 28 | 2.788,96 | 3.207,63 | 2.370,29 | -418,67 | -15,01 | | | -15,01 |
| Adyen | | 20.06.22 | 18.07.22 | 28 | 176.028,59 | 217.590,55 | 134.466,64 | -41.561,96 | -23,61 | | | -23,61 |
| Anheuser-Busch InBev | | 9.03.20 | 8.06.20 | 91 | 4.999,94 | 6.199,19 | 3.800,70 | -1.199,25 | -23,99 | | | -23,99 |
| Safran | | 21.01.08 | 18.02.08 | 28 | 1.593,24 | 2.073,99 | 1.112,49 | -480,75 | -30,17 | | | -30,17 |
| Infineon | | 18.02.08 | 19.05.08 | 91 | 776,34 | 1.028,69 | 523,98 | -252,35 | -32,51 | | | |
| | | 23.03.09 | 6.04.09 | 14 | 92,36 | 135,08 | 49,63 | -42,72 | -46,26 | | | -63,73 |
Anmerkungen
| 19.02.24 | Euro 50 | | | Komponenten-Aktualisierung: Ferrari, Saint-Gobain, Vivendi und Wolters Kluwer ersetzen CRH, Flutter,
Hermes und Vonovia |
| 14.09.23 | Prosus | | | Aktiensplit 1:2.1796 (zwei-komma-einssiebenneunsechs für eine) |
| 24.09.18 | Euro 50 | | | Amadeus, Kering und Linde ersetzen Deutsche Bank, E.ON und Saint-Gobain |
| 23.01.17 | Unicredit | | | Aktien-Zusammenführung 10:1 (eine für zehn) |
| 4.10.16 | AB InBev | | | Übernahme von SAB Miller abgeschlossen |
| 19.09.16 | Euro 50 | | | Adidas, Ahold Delhaize und CRH ersetzen Carrefour, Generali und Unicredit |
| 24.07.16 | Ahold Delhaize | | | Fusion |
| 21.09.15 | Euro 50 | | | Fresenius und Safran ersetzen Repsol und RWE |
| 12.09.15 | Euro 50 | | | vollständige Analyse
ex Repsol, RWE - in Fresenius, Safran |
| 22.08.15 | Euro 50 | | | vollständige Analyse - schwieriger Markt |
|
|