| | Tue, Jun 23rd, 2026, 12:03UTC |
| | |

Assessment - Financial Services in Pound sterling - 7/01/24 - RS = 19
⇐
| |
|
instrument |
freshest |
⇓ Δday |
7/01/24 |
⇓ Δwk |
2/19/24 |
prc diff |
⇓ Δ19 |
|
⇓∅-RS |
| |  |
 |
 |
|
L |
 |
SOM FinServices |
676.236 |
8/12/24 |
0.23 |
697.855 |
-3.10 |
621.244 |
76.611 |
12.33 |
|
26.47 |
| | |
|
|
|
L |
|
Abrdn |
152.950 |
8/12/24 |
2.51 |
149.300 |
2.44 |
160.650 |
-11.350 |
-7.07 |
|
-12.95 |
| | |
|
|
|
|
|
Adyen |
931.620 |
8/12/24 |
1.14 |
944.517 |
-1.37 |
1,279.340 |
-334.823 |
-26.17 |
|
0.37 |
| | |
|
|
|
|
|
AIB |
4.239 |
8/12/24 |
-0.38 |
4.251 |
-0.28 |
3.610 |
0.641 |
17.75 |
|
15.24 |
| | |
|
|
|
S |
|
ASX |
34.257 |
8/12/24 |
0.73 |
31.401 |
9.10 |
33.216 |
-1.815 |
-5.46 |
|
-1.54 |
| | |
|
|
|
|
|
Azimut |
17.733 |
8/12/24 |
1.41 |
18.989 |
-6.61 |
22.458 |
-3.469 |
-15.45 |
|
-2.47 |
| | |
|
|
|
L |
|
Bajaj Finance |
62.666 |
8/12/24 |
-0.15 |
69.007 |
-9.19 |
64.249 |
4.758 |
7.41 |
|
0.61 |
| | |
|
|
|
|
|
Bajaj Finserv |
14.784 |
8/12/24 |
-0.08 |
14.985 |
-1.34 |
15.507 |
-0.521 |
-3.36 |
|
-1.85 |
| | |
|
|
|
S |
|
Banorte |
5.926 |
8/12/24 |
0.58 |
6.300 |
-5.94 |
8.744 |
-2.444 |
-27.95 |
|
-14.25 |
| | |
|
|
|
|
|
Barclays |
220.100 |
8/12/24 |
0.85 |
213.200 |
3.24 |
149.000 |
64.200 |
43.09 |
|
28.79 |
| | |
|
|
|
S |
|
Bolsa Mexicana |
1.276 |
8/12/24 |
-0.17 |
1.343 |
-5.00 |
1.641 |
-0.298 |
-18.15 |
|
-13.74 |
| | |
|
|
|
|
|
Bolsas y Mercados |
0.249 |
8/12/24 |
|
0.304 |
-18.09 |
0.204 |
0.100 |
48.88 |
|
26.96 |
| | |
|
|
|
|
|
Caixabank |
4.225 |
8/12/24 |
0.52 |
4.280 |
-1.29 |
3.456 |
0.824 |
23.83 |
|
21.81 |
| | |
|
|
|
|
|
Capital One |
104.510 |
8/12/24 |
-1.56 |
110.506 |
-5.43 |
108.959 |
1.548 |
1.42 |
|
16.29 |
| | |
|
|
|
S |
|
Citic Secs |
2.050 |
8/12/24 |
-0.11 |
1.977 |
3.68 |
2.301 |
-0.324 |
-14.09 |
|
-12.92 |
| | |
|
|
|
|
|
Concordia Financial |
3.738 |
8/09/24 |
3.82 |
4.711 |
-20.65 |
3.871 |
0.839 |
21.69 |
|
24.17 |
| | |
|
|
|
|
|
Credit Saison |
14.428 |
8/09/24 |
1.20 |
16.254 |
-11.23 |
14.760 |
1.494 |
10.12 |
|
17.32 |
| | |
|
|
|
S |
|
creditshelf |
0.042 |
8/12/24 |
|
0.042 |
|
4.579 |
-4.536 |
-99.07 |
|
-86.34 |
| | |
|
|
|
|
|
Daiwa Securities |
4.739 |
8/09/24 |
0.70 |
6.081 |
-22.07 |
5.783 |
0.298 |
5.14 |
|
19.01 |
| | |
|
|
|
|
|
Deutsche Börse |
157.094 |
8/12/24 |
0.54 |
161.634 |
-2.81 |
160.131 |
1.502 |
0.94 |
|
7.03 |
| | |
|
|
|
L |
|
Deutsche Pfandbrief |
4.195 |
8/12/24 |
0.20 |
4.374 |
-4.09 |
3.216 |
1.158 |
35.99 |
|
-10.31 |
| | |
|
|
|
S |
|
DWS |
28.118 |
8/12/24 |
0.61 |
28.492 |
-1.31 |
31.564 |
-3.072 |
-9.73 |
|
-1.83 |
| | |
|
|
|
S |
|
Edenred |
30.452 |
8/12/24 |
-0.25 |
33.990 |
-10.41 |
47.192 |
-13.202 |
-27.98 |
|
-24.01 |
| | |
|
|
|
|
|
Euronext |
78.526 |
8/12/24 |
1.26 |
75.429 |
4.11 |
69.710 |
5.719 |
8.20 |
|
16.82 |
| | |
|
|
|
|
|
F&C Investment Trust |
1,026.000 |
8/12/24 |
|
1,004.000 |
2.19 |
990.000 |
14.000 |
1.41 |
|
8.74 |
| |
|
instrument |
freshest |
⇓ Δday |
7/01/24 |
⇓ Δwk |
2/19/24 |
prc diff |
⇓ Δ19 |
|
⇓∅-RS |
| | |
|
|
|
L |
|
flatexDEGIRO |
10.398 |
8/12/24 |
0.20 |
11.259 |
-7.65 |
8.687 |
2.572 |
29.61 |
|
31.95 |
| | |
|
|
|
L |
|
Goldman Sachs |
384.043 |
8/12/24 |
-0.97 |
366.767 |
4.71 |
305.240 |
61.527 |
20.16 |
|
26.59 |
| | |
|
|
|
S |
|
Grenke |
21.594 |
8/12/24 |
-2.12 |
17.775 |
21.48 |
20.583 |
-2.808 |
-13.64 |
|
-9.69 |
| | |
|
|
|
|
|
Gr Fin Galicia |
3.612 |
8/12/24 |
0.48 |
3.423 |
5.52 |
2.196 |
1.227 |
55.91 |
|
30.15 |
| | |
|
|
|
|
|
Hana Financial |
34.607 |
8/12/24 |
0.33 |
34.435 |
0.50 |
35.073 |
-0.638 |
-1.82 |
|
23.63 |
| | |
|
|
|
L |
|
Hargreaves Lansdown |
1,102.000 |
8/12/24 |
|
1,127.000 |
-2.22 |
816.600 |
310.400 |
38.01 |
|
38.33 |
| | |
|
|
|
L |
|
HK Exchgs & Clrg |
23.459 |
8/12/24 |
0.96 |
25.343 |
-7.43 |
25.002 |
0.341 |
1.36 |
|
-6.62 |
| | |
|
|
|
|
|
Hypoport |
219.923 |
8/12/24 |
4.68 |
256.238 |
-14.17 |
170.915 |
85.323 |
49.92 |
|
71.50 |
| | |
|
|
|
|
|
Inbursa |
1.902 |
8/12/24 |
-2.28 |
1.897 |
0.27 |
2.554 |
-0.657 |
-25.72 |
|
-4.42 |
| | |
|
|
|
|
|
ING Groep |
12.924 |
8/12/24 |
0.21 |
13.879 |
-6.88 |
10.662 |
3.217 |
30.17 |
|
20.15 |
| | |
|
|
|
|
|
Japan Exchange |
16.244 |
8/09/24 |
4.70 |
18.158 |
-10.54 |
20.467 |
-2.308 |
-11.28 |
|
9.25 |
| | |
|
|
|
L |
|
Julius Bär |
41.739 |
8/12/24 |
0.87 |
44.680 |
-6.58 |
43.880 |
0.799 |
1.82 |
|
-4.43 |
| | |
|
|
|
S |
|
KakaoPay |
14.272 |
8/12/24 |
2.67 |
15.559 |
-8.27 |
29.059 |
-13.500 |
-46.46 |
|
-37.48 |
| | |
|
|
|
S |
|
Legal & General |
225.600 |
8/12/24 |
0.53 |
228.900 |
-1.44 |
238.700 |
-9.800 |
-4.11 |
|
-3.05 |
| | |
|
|
|
L |
|
LSE Group |
9,938.000 |
8/12/24 |
1.12 |
9,304.000 |
6.81 |
8,864.000 |
440.000 |
4.96 |
|
7.86 |
| | |
|
|
|
S |
|
M&G |
203.900 |
8/12/24 |
1.09 |
204.500 |
-0.29 |
224.300 |
-19.800 |
-8.83 |
|
-2.54 |
| | |
|
|
|
|
|
Macquarie Group |
107.491 |
8/12/24 |
1.30 |
106.875 |
0.58 |
99.699 |
7.177 |
7.20 |
|
14.26 |
| | |
|
|
|
|
|
Man Group |
214.000 |
8/12/24 |
0.28 |
243.800 |
-12.22 |
238.600 |
5.200 |
2.18 |
|
7.00 |
| | |
|
|
|
|
|
Mandatum |
3.581 |
8/12/24 |
|
3.586 |
-0.17 |
3.431 |
0.155 |
4.53 |
|
-na- |
| | |
|
|
|
|
|
Mastercard |
360.462 |
8/12/24 |
-0.24 |
346.161 |
4.13 |
371.688 |
-25.527 |
-6.87 |
|
2.59 |
| | |
|
|
|
|
|
Mitsubishi UFJ |
6.905 |
8/09/24 |
1.22 |
8.563 |
-19.35 |
7.920 |
0.643 |
8.12 |
|
21.57 |
| | |
|
|
|
|
|
Mizuho |
13.608 |
8/09/24 |
2.38 |
16.685 |
-18.44 |
14.631 |
2.054 |
14.04 |
|
18.78 |
| | |
|
|
|
L |
|
MLP |
4.896 |
8/12/24 |
0.87 |
4.964 |
-1.37 |
4.673 |
0.291 |
6.22 |
|
9.06 |
| | |
|
|
|
L |
|
Morgan Stanley |
75.021 |
8/12/24 |
0.13 |
78.438 |
-4.36 |
68.680 |
9.758 |
14.21 |
|
13.97 |
| | |
|
|
|
L |
|
Multitude |
4.684 |
8/12/24 |
-0.72 |
5.142 |
-8.91 |
4.023 |
1.119 |
27.82 |
|
49.44 |
| |
|
instrument |
freshest |
⇓ Δday |
7/01/24 |
⇓ Δwk |
2/19/24 |
prc diff |
⇓ Δ19 |
|
⇓∅-RS |
| | |
|
|
|
|
|
New Zealand Exchange |
0.605 |
8/12/24 |
0.80 |
0.504 |
20.00 |
0.503 |
0.001 |
0.28 |
|
-3.97 |
| | |
|
|
|
S |
|
Nexi |
4.816 |
8/12/24 |
0.46 |
4.909 |
-1.90 |
6.090 |
-1.181 |
-19.39 |
|
-12.14 |
| | |
|
|
|
|
|
Nomura |
3.622 |
8/09/24 |
2.06 |
4.587 |
-21.05 |
4.452 |
0.135 |
3.04 |
|
24.09 |
| | |
|
|
|
|
|
Orix |
16.327 |
8/09/24 |
4.68 |
17.497 |
-6.69 |
16.421 |
1.077 |
6.56 |
|
13.50 |
| | |
|
|
|
|
|
PayPal |
50.198 |
8/12/24 |
-1.95 |
45.729 |
9.77 |
46.956 |
-1.227 |
-2.61 |
|
-6.98 |
| | |
|
|
|
|
|
permanent tsb |
1.311 |
8/12/24 |
1.31 |
1.111 |
17.94 |
1.327 |
-0.215 |
-16.21 |
|
-25.43 |
| | |
|
|
|
L |
|
Schroders |
337.200 |
8/12/24 |
-0.12 |
363.400 |
-7.21 |
404.400 |
-41.000 |
-10.14 |
|
-7.81 |
| | |
|
|
|
|
|
Shinhan |
30.946 |
8/12/24 |
0.19 |
27.371 |
13.06 |
26.826 |
0.545 |
2.03 |
|
16.87 |
| | |
|
|
|
|
|
Shizuoka Financial |
6.095 |
8/09/24 |
2.17 |
7.713 |
-20.98 |
7.668 |
0.045 |
0.59 |
|
11.76 |
| | |
|
|
|
L |
|
Singapore Exchange |
5.693 |
8/12/24 |
-0.51 |
5.472 |
4.05 |
5.529 |
-0.057 |
-1.03 |
|
-2.24 |
| | |
|
|
|
L |
|
St. James´s Place |
691.000 |
8/12/24 |
-1.22 |
549.000 |
25.87 |
656.800 |
-107.800 |
-16.41 |
|
-17.14 |
| | |
|
|
|
|
|
Sumitomo Mitsui FG |
43.905 |
8/09/24 |
3.71 |
53.045 |
-17.23 |
43.286 |
9.759 |
22.54 |
|
30.75 |
| | |
|
|
|
S |
|
Sun Life Financial |
37.957 |
8/12/24 |
-0.11 |
38.614 |
-1.70 |
42.855 |
-4.242 |
-9.90 |
|
-4.35 |
| | |
|
|
|
|
|
Supervielle |
1.537 |
8/12/24 |
1.14 |
1.497 |
2.69 |
0.922 |
0.575 |
62.38 |
|
47.11 |
| | |
|
|
|
|
|
Visa |
205.580 |
8/12/24 |
0.05 |
208.230 |
-1.27 |
221.172 |
-12.943 |
-5.85 |
|
2.09 |
| | |
|
|
|
L |
|
Verisk Analytics |
207.533 |
8/12/24 |
-0.67 |
212.082 |
-2.14 |
194.288 |
17.794 |
9.16 |
|
12.29 |
| | |
|
|
|
L |
|
Worldline |
6.625 |
8/12/24 |
-0.79 |
8.845 |
-25.10 |
10.108 |
-1.262 |
-12.49 |
|
-32.76 |
| | |
|
|
|
L |
|
W&W |
10.266 |
8/12/24 |
-0.49 |
11.200 |
-8.33 |
11.503 |
-0.303 |
-2.63 |
|
-6.23 |
| Financial Services - 67 out of 67 instruments rated - 7/01/24 / 2/19/24 - 38 did rise, Market-Ratio(19) in GBP = 56.72 % |
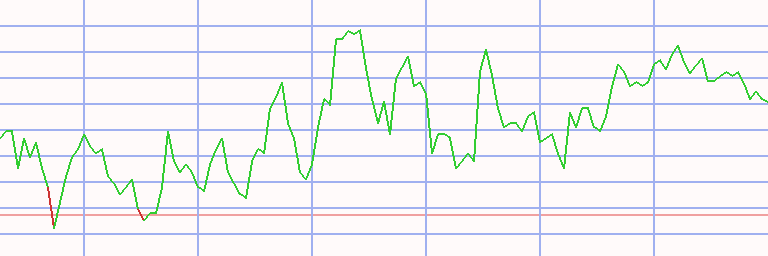
Technical Chart
| Financial Services RS = 19 - B/S = 16/16 | |
 |
| 1/03/22 |
scale up chart |
7/01/24 |
Transactions Financial Services in Pound sterling * S19 - 16 ex 6 (1)
|
⇐ |
| |
| L/S | date buy | date sell | days | | instrument | spl | pieces | | prc buy | prc sell | ps short | prc diff | d % | asset | yield | |
| 1/02/06 |
2/11/08 |
770 |
|
- cash - |
| short |
2/11/08 |
3/31/08 |
49 |
|
|
|
Orix |
100 |
144,635 |
|
0.069 |
0.067 |
0.071 |
0.002 |
3 |
10,255 |
21 |
|
| 3/31/08 |
4/14/08 |
14 |
|
- cash - |
| |
4/14/08 |
4/28/08 |
14 |
|
|
|
Bajaj Finserv |
100 |
11,564 |
|
0.887 |
0.866 |
0.908 |
0.021 |
2 |
10,502 |
86 |
|
| 4/28/08 |
8/18/08 |
112 |
|
- cash - |
| |
8/18/08 |
8/25/08 |
7 |
|
|
|
Bajaj Finserv |
100 |
166,381 |
|
0.063 |
0.065 |
0.062 |
-0.002 |
-3 |
10,232 |
-74 |
|
| 8/25/08 |
9/01/08 |
7 |
|
- cash - |
| |
9/01/08 |
1/19/09 |
140 |
|
|
|
Bajaj Finserv |
100 |
156,272 |
|
0.065 |
0.024 |
0.176 |
0.111 |
169 |
27,504 |
1,217 |
|
| |
1/19/09 |
3/02/09 |
42 |
|
|
|
Barclays |
100 |
33,834 |
|
0.813 |
0.808 |
0.818 |
0.005 |
1 |
27,660 |
5 |
|
| 3/02/09 |
8/30/10 |
546 |
|
- cash - |
| |
8/30/10 |
9/06/10 |
7 |
|
|
|
Citic Secs |
100 |
24,495 |
|
1.129 |
1.138 |
1.121 |
-0.009 |
-1 |
27,447 |
-33 |
|
| 9/06/10 |
8/08/11 |
336 |
|
- cash - |
| |
8/08/11 |
8/29/11 |
21 |
|
|
|
Barclays |
100 |
16,940 |
|
1.620 |
1.528 |
1.718 |
0.098 |
6 |
29,107 |
177 |
|
| 8/29/11 |
9/05/11 |
7 |
|
- cash - |
| |
9/05/11 |
9/19/11 |
14 |
|
|
|
Barclays |
100 |
20,440 |
|
1.424 |
1.411 |
1.438 |
0.014 |
1 |
29,383 |
28 |
|
| 9/19/11 |
9/26/11 |
7 |
|
- cash - |
| |
9/26/11 |
10/10/11 |
14 |
|
|
|
Morgan Stanley |
100 |
3,110 |
|
9.448 |
9.830 |
9.066 |
-0.382 |
-4 |
28,195 |
-66 |
|
| 10/10/11 |
11/14/11 |
35 |
|
- cash - |
| |
11/14/11 |
11/28/11 |
14 |
|
|
|
Gr Fin Galicia |
100 |
58,231 |
|
0.484 |
0.507 |
0.461 |
-0.023 |
-5 |
26,851 |
-72 |
|
| 11/28/11 |
8/24/15 |
1365 |
|
- cash - |
| |
8/24/15 |
8/31/15 |
7 |
|
|
|
Citic Secs |
100 |
16,561 |
|
1.621 |
1.540 |
1.706 |
0.085 |
5 |
28,259 |
1,338 |
|
| 8/31/15 |
10/29/18 |
1155 |
|
- cash - |
| |
10/29/18 |
11/05/18 |
7 |
|
|
|
Multitude |
100 |
2,856 |
|
9.891 |
10.190 |
9.593 |
-0.298 |
-3 |
27,407 |
-80 |
|
| 11/05/18 |
11/19/18 |
14 |
|
- cash - |
| |
11/19/18 |
12/03/18 |
14 |
|
|
|
Multitude |
100 |
3,106 |
|
8.822 |
9.200 |
8.444 |
-0.378 |
-4 |
26,233 |
-68 |
|
| 12/03/18 |
12/10/18 |
7 |
|
- cash - |
| |
12/10/18 |
1/21/19 |
42 |
|
|
|
Multitude |
100 |
3,310 |
|
7.924 |
7.993 |
7.854 |
-0.069 |
-1 |
26,004 |
-7 |
|
| 1/21/19 |
3/16/20 |
420 |
|
- cash - |
| |
3/16/20 |
4/06/20 |
21 |
|
|
|
AIB |
100 |
22,369 |
|
1.162 |
0.820 |
1.648 |
0.485 |
42 |
36,860 |
42,928 |
|
| 4/06/20 |
5/04/20 |
28 |
|
- cash - |
| |
5/04/20 |
5/11/20 |
7 |
|
|
|
AIB |
100 |
35,879 |
|
1.027 |
0.809 |
1.305 |
0.277 |
27 |
46,812 |
> 999,999 |
|
| 5/11/20 |
3/07/22 |
665 |
|
- cash - |
| |
3/07/22 |
3/14/22 |
7 |
|
|
|
PayPal |
100 |
656 |
|
71.349 |
74.361 |
68.337 |
-3.012 |
-4 |
44,836 |
-89 |
|
| 3/14/22 |
6/13/22 |
91 |
|
- cash - |
| |
6/13/22 |
7/11/22 |
28 |
|
|
|
PayPal |
100 |
740 |
|
60.541 |
59.288 |
61.821 |
1.280 |
2 |
45,783 |
31 |
|
| 7/11/22 |
6/23/26 |
1443 |
|
- cash - |
| accum | 2/11/08 |
7/11/22 | 455 |
days out of 7477 invested (6%) |
358 |
45,783 |
239 |
|
Instrument Related Contribution
| instrument | L/S | date buy | date sell | days | prc buy | prc sell | ps short | prc diff | d % | | | total |
| Bajaj Finserv | short | 4/14/08 | 4/28/08 | 14 | 0.89 | 0.87 | 0.91 | 0.02 | 2.42 | | | |
| | | 8/18/08 | 8/25/08 | 7 | 0.06 | 0.06 | 0.06 | -0.00 | -2.57 | | | |
| | | 9/01/08 | 1/19/09 | 140 | 0.07 | 0.02 | 0.18 | 0.11 | 168.79 | | | 168.21 |
| AIB | | 3/16/20 | 4/06/20 | 21 | 1.16 | 0.82 | 1.65 | 0.49 | 41.75 | | | |
| | | 5/04/20 | 5/11/20 | 7 | 1.03 | 0.81 | 1.30 | 0.28 | 27.00 | | | 80.02 |
| Barclays | | 1/19/09 | 3/02/09 | 42 | 0.81 | 0.81 | 0.82 | 0.00 | 0.57 | | | |
| | | 8/08/11 | 8/29/11 | 21 | 1.62 | 1.53 | 1.72 | 0.10 | 6.05 | | | |
| | | 9/05/11 | 9/19/11 | 14 | 1.42 | 1.41 | 1.44 | 0.01 | 0.95 | | | 7.66 |
| Citic Secs | | 8/30/10 | 9/06/10 | 7 | 1.13 | 1.14 | 1.12 | -0.01 | -0.77 | | | |
| | | 8/24/15 | 8/31/15 | 7 | 1.62 | 1.54 | 1.71 | 0.09 | 5.25 | | | 4.44 |
| Orix | | 2/11/08 | 3/31/08 | 49 | 0.07 | 0.07 | 0.07 | 0.00 | 2.55 | | | 2.55 |
| PayPal | | 3/07/22 | 3/14/22 | 7 | 71.35 | 74.36 | 68.34 | -3.01 | -4.22 | | | |
| | | 6/13/22 | 7/11/22 | 28 | 60.54 | 59.29 | 61.82 | 1.28 | 2.11 | | | -2.20 |
| Morgan Stanley | | 9/26/11 | 10/10/11 | 14 | 9.45 | 9.83 | 9.07 | -0.38 | -4.05 | | | -4.05 |
| Gr Fin Galicia | | 11/14/11 | 11/28/11 | 14 | 0.48 | 0.51 | 0.46 | -0.02 | -4.77 | | | -4.77 |
| Multitude | | 10/29/18 | 11/05/18 | 7 | 9.89 | 10.19 | 9.59 | -0.30 | -3.01 | | | |
| | | 11/19/18 | 12/03/18 | 14 | 8.82 | 9.20 | 8.44 | -0.38 | -4.29 | | | |
| | | 12/10/18 | 1/21/19 | 42 | 7.92 | 7.99 | 7.85 | -0.07 | -0.87 | | | -7.98 |
Annotations
| 9/26/22 | Schroders | | | split 1:5 (five for one) + 3 bonus shares for 17 (is equivalent to a 17:20 split) |
| 9/02/21 | flatexDEGIRO | | | stock split 1:4 (four for one) |
| 8/14/17 | Standard Life | | | merger with Aberdeen Asset Management completed |
| 7/10/17 | Grenkeleasing | | | stock split 1:3 (three for one) |
| 3/10/16 | W&W | | | recording started (SDAX) |
| 12/21/15 | Hypoport | | | entry (SDAX) |
| 9/04/15 | Deutsche Pfandbrief | | | recording started (MDAX) |
| 9/03/15 | Finanzdienste | | | complete analysis |
| 7/20/15 | PayPal | | | recording started |
| 6/21/15 | Ferratum | | | recording started |
| 3/19/15 | Visa | | | forward stock split 1:4 (four for one) |
| 3/13/15 | Financial Sevices | | | first full analysis |
|
|
