| | Tue, Jun 23rd, 2026, 11:51UTC |
| | |

Assessment - Financial Services in Pound sterling - 7/01/24 - RS = 22
⇐
| |
|
instrument |
freshest |
⇓ Δday |
7/01/24 |
⇓ Δwk |
1/29/24 |
prc diff |
⇓ Δ22 |
|
⇓∅-RS |
| |  |
 |
 |
|
L |
 |
SOM FinServices |
676.236 |
8/12/24 |
0.23 |
697.855 |
-3.10 |
549.335 |
148.520 |
27.04 |
|
26.47 |
| | |
|
|
|
L |
|
Abrdn |
152.950 |
8/12/24 |
2.51 |
149.300 |
2.44 |
168.150 |
-18.850 |
-11.21 |
|
-12.95 |
| | |
|
|
|
|
|
Adyen |
931.620 |
8/12/24 |
1.14 |
944.517 |
-1.37 |
996.708 |
-52.191 |
-5.24 |
|
0.37 |
| | |
|
|
|
|
|
AIB |
4.239 |
8/12/24 |
-0.38 |
4.251 |
-0.28 |
3.413 |
0.838 |
24.54 |
|
15.24 |
| | |
|
|
|
S |
|
ASX |
34.257 |
8/12/24 |
0.73 |
31.401 |
9.10 |
34.322 |
-2.922 |
-8.51 |
|
-1.54 |
| | |
|
|
|
|
|
Azimut |
17.733 |
8/12/24 |
1.41 |
18.989 |
-6.61 |
21.712 |
-2.724 |
-12.54 |
|
-2.47 |
| | |
|
|
|
L |
|
Bajaj Finance |
62.666 |
8/12/24 |
-0.15 |
69.007 |
-9.19 |
68.196 |
0.811 |
1.19 |
|
0.61 |
| | |
|
|
|
|
|
Bajaj Finserv |
14.784 |
8/12/24 |
-0.08 |
14.985 |
-1.34 |
15.523 |
-0.537 |
-3.46 |
|
-1.85 |
| | |
|
|
|
S |
|
Banorte |
5.926 |
8/12/24 |
0.58 |
6.300 |
-5.94 |
7.826 |
-1.526 |
-19.50 |
|
-14.25 |
| | |
|
|
|
|
|
Barclays |
220.100 |
8/12/24 |
0.85 |
213.200 |
3.24 |
147.540 |
65.660 |
44.50 |
|
28.79 |
| | |
|
|
|
S |
|
Bolsa Mexicana |
1.276 |
8/12/24 |
-0.17 |
1.343 |
-5.00 |
1.604 |
-0.261 |
-16.26 |
|
-13.74 |
| | |
|
|
|
|
|
Bolsas y Mercados |
0.249 |
8/12/24 |
|
0.304 |
-18.09 |
0.222 |
0.082 |
36.93 |
|
26.96 |
| | |
|
|
|
|
|
Caixabank |
4.225 |
8/12/24 |
0.52 |
4.280 |
-1.29 |
3.292 |
0.987 |
29.99 |
|
21.81 |
| | |
|
|
|
|
|
Capital One |
104.510 |
8/12/24 |
-1.56 |
110.506 |
-5.43 |
109.137 |
1.369 |
1.25 |
|
16.29 |
| | |
|
|
|
S |
|
Citic Secs |
2.050 |
8/12/24 |
-0.11 |
1.977 |
3.68 |
2.261 |
-0.285 |
-12.58 |
|
-12.92 |
| | |
|
|
|
|
|
Concordia Financial |
3.738 |
8/09/24 |
3.82 |
4.711 |
-20.65 |
3.751 |
0.960 |
25.59 |
|
24.17 |
| | |
|
|
|
|
|
Credit Saison |
14.428 |
8/09/24 |
1.20 |
16.254 |
-11.23 |
14.885 |
1.369 |
9.19 |
|
17.32 |
| | |
|
|
|
S |
|
creditshelf |
0.042 |
8/12/24 |
|
0.042 |
|
3.410 |
-3.367 |
-98.76 |
|
-86.34 |
| | |
|
|
|
|
|
Daiwa Securities |
4.739 |
8/09/24 |
0.70 |
6.081 |
-22.07 |
5.663 |
0.417 |
7.37 |
|
19.01 |
| | |
|
|
|
|
|
Deutsche Börse |
157.094 |
8/12/24 |
0.54 |
161.634 |
-2.81 |
156.897 |
4.736 |
3.02 |
|
7.03 |
| | |
|
|
|
L |
|
Deutsche Pfandbrief |
4.195 |
8/12/24 |
0.20 |
4.374 |
-4.09 |
4.851 |
-0.477 |
-9.83 |
|
-10.31 |
| | |
|
|
|
S |
|
DWS |
28.118 |
8/12/24 |
0.61 |
28.492 |
-1.31 |
32.155 |
-3.664 |
-11.39 |
|
-1.83 |
| | |
|
|
|
S |
|
Edenred |
30.452 |
8/12/24 |
-0.25 |
33.990 |
-10.41 |
48.045 |
-14.056 |
-29.25 |
|
-24.01 |
| | |
|
|
|
|
|
Euronext |
78.526 |
8/12/24 |
1.26 |
75.429 |
4.11 |
69.476 |
5.953 |
8.57 |
|
16.82 |
| | |
|
|
|
|
|
F&C Investment Trust |
1,026.000 |
8/12/24 |
|
1,004.000 |
2.19 |
966.000 |
38.000 |
3.93 |
|
8.74 |
| |
|
instrument |
freshest |
⇓ Δday |
7/01/24 |
⇓ Δwk |
1/29/24 |
prc diff |
⇓ Δ22 |
|
⇓∅-RS |
| | |
|
|
|
L |
|
flatexDEGIRO |
10.398 |
8/12/24 |
0.20 |
11.259 |
-7.65 |
8.687 |
2.573 |
29.61 |
|
31.95 |
| | |
|
|
|
L |
|
Goldman Sachs |
384.043 |
8/12/24 |
-0.97 |
366.767 |
4.71 |
299.921 |
66.846 |
22.29 |
|
26.59 |
| | |
|
|
|
S |
|
Grenke |
21.594 |
8/12/24 |
-2.12 |
17.775 |
21.48 |
19.394 |
-1.618 |
-8.34 |
|
-9.69 |
| | |
|
|
|
|
|
Gr Fin Galicia |
3.612 |
8/12/24 |
0.48 |
3.423 |
5.52 |
2.551 |
0.872 |
34.20 |
|
30.15 |
| | |
|
|
|
|
|
Hana Financial |
34.607 |
8/12/24 |
0.33 |
34.435 |
0.50 |
27.432 |
7.003 |
25.53 |
|
23.63 |
| | |
|
|
|
L |
|
Hargreaves Lansdown |
1,102.000 |
8/12/24 |
|
1,127.000 |
-2.22 |
758.400 |
368.600 |
48.60 |
|
38.33 |
| | |
|
|
|
L |
|
HK Exchgs & Clrg |
23.459 |
8/12/24 |
0.96 |
25.343 |
-7.43 |
24.826 |
0.517 |
2.08 |
|
-6.62 |
| | |
|
|
|
|
|
Hypoport |
219.923 |
8/12/24 |
4.68 |
256.238 |
-14.17 |
159.753 |
96.485 |
60.40 |
|
71.50 |
| | |
|
|
|
|
|
Inbursa |
1.902 |
8/12/24 |
-2.28 |
1.897 |
0.27 |
2.288 |
-0.391 |
-17.09 |
|
-4.42 |
| | |
|
|
|
|
|
ING Groep |
12.924 |
8/12/24 |
0.21 |
13.879 |
-6.88 |
11.143 |
2.736 |
24.55 |
|
20.15 |
| | |
|
|
|
|
|
Japan Exchange |
16.244 |
8/09/24 |
4.70 |
18.158 |
-10.54 |
17.003 |
1.156 |
6.80 |
|
9.25 |
| | |
|
|
|
L |
|
Julius Bär |
41.739 |
8/12/24 |
0.87 |
44.680 |
-6.58 |
43.116 |
1.564 |
3.63 |
|
-4.43 |
| | |
|
|
|
S |
|
KakaoPay |
14.272 |
8/12/24 |
2.67 |
15.559 |
-8.27 |
29.295 |
-13.736 |
-46.89 |
|
-37.48 |
| | |
|
|
|
S |
|
Legal & General |
225.600 |
8/12/24 |
0.53 |
228.900 |
-1.44 |
253.800 |
-24.900 |
-9.81 |
|
-3.05 |
| | |
|
|
|
L |
|
LSE Group |
9,938.000 |
8/12/24 |
1.12 |
9,304.000 |
6.81 |
8,914.000 |
390.000 |
4.38 |
|
7.86 |
| | |
|
|
|
S |
|
M&G |
203.900 |
8/12/24 |
1.09 |
204.500 |
-0.29 |
226.000 |
-21.500 |
-9.51 |
|
-2.54 |
| | |
|
|
|
|
|
Macquarie Group |
107.491 |
8/12/24 |
1.30 |
106.875 |
0.58 |
97.510 |
9.365 |
9.60 |
|
14.26 |
| | |
|
|
|
|
|
Man Group |
214.000 |
8/12/24 |
0.28 |
243.800 |
-12.22 |
229.400 |
14.400 |
6.28 |
|
7.00 |
| | |
|
|
|
|
|
Mandatum |
3.581 |
8/12/24 |
|
3.586 |
-0.17 |
3.614 |
-0.028 |
-0.77 |
|
-na- |
| | |
|
|
|
|
|
Mastercard |
360.462 |
8/12/24 |
-0.24 |
346.161 |
4.13 |
347.223 |
-1.063 |
-0.31 |
|
2.59 |
| | |
|
|
|
|
|
Mitsubishi UFJ |
6.905 |
8/09/24 |
1.22 |
8.563 |
-19.35 |
7.305 |
1.257 |
17.21 |
|
21.57 |
| | |
|
|
|
|
|
Mizuho |
13.608 |
8/09/24 |
2.38 |
16.685 |
-18.44 |
14.191 |
2.494 |
17.57 |
|
18.78 |
| | |
|
|
|
L |
|
MLP |
4.896 |
8/12/24 |
0.87 |
4.964 |
-1.37 |
4.569 |
0.394 |
8.63 |
|
9.06 |
| | |
|
|
|
L |
|
Morgan Stanley |
75.021 |
8/12/24 |
0.13 |
78.438 |
-4.36 |
69.054 |
9.384 |
13.59 |
|
13.97 |
| | |
|
|
|
L |
|
Multitude |
4.684 |
8/12/24 |
-0.72 |
5.142 |
-8.91 |
3.921 |
1.220 |
31.12 |
|
49.44 |
| |
|
instrument |
freshest |
⇓ Δday |
7/01/24 |
⇓ Δwk |
1/29/24 |
prc diff |
⇓ Δ22 |
|
⇓∅-RS |
| | |
|
|
|
|
|
New Zealand Exchange |
0.605 |
8/12/24 |
0.80 |
0.504 |
20.00 |
0.510 |
-0.006 |
-1.22 |
|
-3.97 |
| | |
|
|
|
S |
|
Nexi |
4.816 |
8/12/24 |
0.46 |
4.909 |
-1.90 |
6.122 |
-1.213 |
-19.82 |
|
-12.14 |
| | |
|
|
|
|
|
Nomura |
3.622 |
8/09/24 |
2.06 |
4.587 |
-21.05 |
4.090 |
0.497 |
12.15 |
|
24.09 |
| | |
|
|
|
|
|
Orix |
16.327 |
8/09/24 |
4.68 |
17.497 |
-6.69 |
15.278 |
2.220 |
14.53 |
|
13.50 |
| | |
|
|
|
|
|
PayPal |
50.198 |
8/12/24 |
-1.95 |
45.729 |
9.77 |
50.250 |
-4.520 |
-9.00 |
|
-6.98 |
| | |
|
|
|
|
|
permanent tsb |
1.311 |
8/12/24 |
1.31 |
1.111 |
17.94 |
1.466 |
-0.355 |
-24.19 |
|
-25.43 |
| | |
|
|
|
L |
|
Schroders |
337.200 |
8/12/24 |
-0.12 |
363.400 |
-7.21 |
409.200 |
-45.800 |
-11.19 |
|
-7.81 |
| | |
|
|
|
|
|
Shinhan |
30.946 |
8/12/24 |
0.19 |
27.371 |
13.06 |
23.944 |
3.427 |
14.31 |
|
16.87 |
| | |
|
|
|
|
|
Shizuoka Financial |
6.095 |
8/09/24 |
2.17 |
7.713 |
-20.98 |
7.134 |
0.579 |
8.12 |
|
11.76 |
| | |
|
|
|
L |
|
Singapore Exchange |
5.693 |
8/12/24 |
-0.51 |
5.472 |
4.05 |
5.614 |
-0.142 |
-2.53 |
|
-2.24 |
| | |
|
|
|
L |
|
St. James´s Place |
691.000 |
8/12/24 |
-1.22 |
549.000 |
25.87 |
647.000 |
-98.000 |
-15.15 |
|
-17.14 |
| | |
|
|
|
|
|
Sumitomo Mitsui FG |
43.905 |
8/09/24 |
3.71 |
53.045 |
-17.23 |
40.499 |
12.547 |
30.98 |
|
30.75 |
| | |
|
|
|
S |
|
Sun Life Financial |
37.957 |
8/12/24 |
-0.11 |
38.614 |
-1.70 |
40.666 |
-2.052 |
-5.05 |
|
-4.35 |
| | |
|
|
|
|
|
Supervielle |
1.537 |
8/12/24 |
1.14 |
1.497 |
2.69 |
1.063 |
0.434 |
40.81 |
|
47.11 |
| | |
|
|
|
|
|
Visa |
205.580 |
8/12/24 |
0.05 |
208.230 |
-1.27 |
215.673 |
-7.443 |
-3.45 |
|
2.09 |
| | |
|
|
|
L |
|
Verisk Analytics |
207.533 |
8/12/24 |
-0.67 |
212.082 |
-2.14 |
192.747 |
19.335 |
10.03 |
|
12.29 |
| | |
|
|
|
L |
|
Worldline |
6.625 |
8/12/24 |
-0.79 |
8.845 |
-25.10 |
11.044 |
-2.198 |
-19.91 |
|
-32.76 |
| | |
|
|
|
L |
|
W&W |
10.266 |
8/12/24 |
-0.49 |
11.200 |
-8.33 |
11.457 |
-0.257 |
-2.25 |
|
-6.23 |
| Financial Services - 67 out of 67 instruments rated - 7/01/24 / 1/29/24 - 37 did rise, Market-Ratio(22) in GBP = 55.22 % |
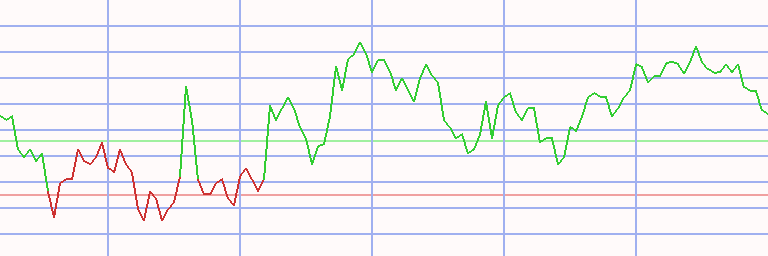
Technical Chart
| Financial Services RS = 22 - B/S = 24/45 | |
 |
| 1/03/22 |
scale up chart |
7/01/24 |
Transactions Financial Services in Pound sterling * S22 - 24/45 (1)
|
⇐ |
| |
| L/S | date buy | date sell | days | | instrument | spl | pieces | | prc buy | prc sell | ps short | prc diff | d % | asset | yield | |
| 1/02/06 |
1/28/08 |
756 |
|
- cash - |
| short |
1/28/08 |
3/30/09 |
427 |
|
|
|
Natixis |
100 |
1,864 |
|
5.362 |
1.109 |
25.915 |
20.553 |
383 |
48,311 |
284 |
|
| 3/30/09 |
2/15/10 |
322 |
|
- cash - |
| |
2/15/10 |
3/01/10 |
14 |
|
|
|
Man Group |
100 |
22,009 |
|
2.195 |
2.252 |
2.138 |
-0.057 |
-3 |
47,056 |
-50 |
|
| 3/01/10 |
8/30/10 |
182 |
|
- cash - |
| |
8/30/10 |
10/11/10 |
42 |
|
|
|
Haitong Secs |
100 |
50,843 |
|
0.926 |
0.974 |
0.877 |
-0.049 |
-5 |
44,584 |
-37 |
|
| 10/11/10 |
7/18/11 |
280 |
|
- cash - |
| |
7/18/11 |
1/09/12 |
175 |
|
|
|
Barclays |
100 |
23,243 |
|
1.918 |
1.645 |
2.236 |
0.318 |
17 |
51,981 |
38 |
|
| 1/09/12 |
8/24/15 |
1323 |
|
- cash - |
| |
8/24/15 |
6/20/16 |
301 |
|
|
|
Haitong Secs |
100 |
41,582 |
|
1.250 |
1.560 |
0.940 |
-0.310 |
-25 |
39,079 |
-29 |
|
| 6/20/16 |
7/02/18 |
742 |
|
- cash - |
| |
7/02/18 |
3/18/19 |
259 |
|
|
|
Orient Secs |
100 |
38,415 |
|
1.017 |
1.443 |
0.592 |
-0.425 |
-42 |
22,738 |
-53 |
|
| 3/18/19 |
3/16/20 |
364 |
|
- cash - |
| |
3/16/20 |
8/03/20 |
140 |
|
|
|
Natixis |
100 |
15,349 |
|
1.481 |
1.868 |
1.094 |
-0.387 |
-26 |
16,799 |
-55 |
|
| 8/03/20 |
3/07/22 |
581 |
|
- cash - |
| |
3/07/22 |
8/08/22 |
154 |
|
|
|
PayPal |
100 |
235 |
|
71.349 |
79.655 |
63.043 |
-8.306 |
-12 |
14,847 |
-25 |
|
| 8/08/22 |
8/29/22 |
21 |
|
- cash - |
| |
8/29/22 |
11/14/22 |
77 |
|
|
|
Hypoport |
100 |
92 |
|
161.134 |
127.703 |
203.318 |
42.184 |
26 |
18,728 |
201 |
|
| 11/14/22 |
6/23/26 |
1317 |
|
- cash - |
| accum | 1/28/08 |
11/14/22 | 1589 |
days out of 7477 invested (21%) |
87 |
18,728 |
16 |
|
Instrument Related Contribution
| instrument | L/S | date buy | date sell | days | prc buy | prc sell | ps short | prc diff | d % | | | total |
| Natixis | short | 1/28/08 | 3/30/09 | 427 | 5.36 | 1.11 | 25.91 | 20.55 | 383.31 | | | |
| | | 3/16/20 | 8/03/20 | 140 | 1.48 | 1.87 | 1.09 | -0.39 | -26.12 | | | 257.06 |
| Hypoport | | 8/29/22 | 11/14/22 | 77 | 161.13 | 127.70 | 203.32 | 42.18 | 26.18 | | | 26.18 |
| Barclays | | 7/18/11 | 1/09/12 | 175 | 1.92 | 1.65 | 2.24 | 0.32 | 16.59 | | | 16.59 |
| Man Group | | 2/15/10 | 3/01/10 | 14 | 2.20 | 2.25 | 2.14 | -0.06 | -2.60 | | | -2.60 |
| PayPal | | 3/07/22 | 8/08/22 | 154 | 71.35 | 79.66 | 63.04 | -8.31 | -11.64 | | | -11.64 |
| Haitong Secs | | 8/30/10 | 10/11/10 | 42 | 0.93 | 0.97 | 0.88 | -0.05 | -5.25 | | | |
| | | 8/24/15 | 6/20/16 | 301 | 1.25 | 1.56 | 0.94 | -0.31 | -24.82 | | | -28.77 |
| Orient Secs | | 7/02/18 | 3/18/19 | 259 | 1.02 | 1.44 | 0.59 | -0.43 | -41.82 | | | -41.82 |
Annotations
| 9/26/22 | Schroders | | | split 1:5 (five for one) + 3 bonus shares for 17 (is equivalent to a 17:20 split) |
| 9/02/21 | flatexDEGIRO | | | stock split 1:4 (four for one) |
| 8/14/17 | Standard Life | | | merger with Aberdeen Asset Management completed |
| 7/10/17 | Grenkeleasing | | | stock split 1:3 (three for one) |
| 3/10/16 | W&W | | | recording started (SDAX) |
| 12/21/15 | Hypoport | | | entry (SDAX) |
| 9/04/15 | Deutsche Pfandbrief | | | recording started (MDAX) |
| 9/03/15 | Finanzdienste | | | complete analysis |
| 7/20/15 | PayPal | | | recording started |
| 6/21/15 | Ferratum | | | recording started |
| 3/19/15 | Visa | | | forward stock split 1:4 (four for one) |
| 3/13/15 | Financial Sevices | | | first full analysis |
|
