Sun, 28th Jun 2026, 2:33UTC
Assessment - nx-25 - Natur-Aktienindex in Pound sterling - 1/07/24 - RS = 8
⇐
⇓ freshest
⇓ 1/07/24
⇓ 6/05/24
prc diff
⇓
∅-RS
L
SOM Price Index
743.415
12/08/24
-0.26
758.731
-2.02
757.666
1.065
0.14
12.97
L
Sprouts
76.081
12/08/24
-0.10
66.106
15.09
59.668
6.438
10.79
70.56
L
First Solar
173.417
12/08/24
3.51
176.169
-1.56
154.191
21.978
14.25
29.56
Deckers Outdoor
726.399
12/08/24
3.15
748.548
-2.96
685.669
62.879
9.17
39.34
L
L'Occitane
3.343
29/07/24
0.72
3.285
1.76
3.264
0.022
0.66
33.49
L
Eramet
61.387
12/08/24
5.24
82.896
-25.95
81.033
1.863
2.30
30.64
Interface
12.902
12/08/24
-0.79
11.525
11.94
13.071
-1.546
-11.83
25.11
L
INIT Innov. in Traff
32.242
12/08/24
-3.55
33.684
-4.28
33.013
0.671
2.03
25.67
Encompass Health
68.708
12/08/24
1.33
67.522
1.76
67.234
0.288
0.43
18.94
L
Kurita Water
27.583
9/08/24
-9.14
33.604
-17.92
32.462
1.142
3.52
12.00
L
eBay
44.147
12/08/24
-1.26
41.671
5.94
39.286
2.386
6.07
15.96
L
Shimano
132.576
9/08/24
-0.48
122.712
8.04
133.608
-10.896
-8.16
2.64
L
Geberit
457.653
12/08/24
-0.72
463.255
-1.21
452.540
10.715
2.37
5.46
MillerKnoll
21.468
12/08/24
-3.49
20.931
2.57
21.329
-0.399
-1.87
12.67
L
Ormat Technologies
56.724
12/08/24
-1.10
54.739
3.63
53.813
0.926
1.72
-1.65
Tomra Systems
11.724
12/08/24
0.13
9.753
20.21
10.225
-0.472
-4.62
2.44
L
LTC Properties
28.398
12/08/24
-0.22
27.243
4.24
26.477
0.766
2.89
5.21
Cdn Nat Railway
87.612
12/08/24
-0.01
93.057
-5.85
100.469
-7.411
-7.38
-2.47
Vestas Wind Systems
17.322
12/08/24
-7.76
18.443
-6.08
20.883
-2.440
-11.68
-9.78
L
Verbund
65.205
12/08/24
1.52
64.272
1.45
64.397
-0.126
-0.20
-0.37
Oatly
0.700
12/08/24
1.57
0.729
-4.01
1.026
-0.297
-28.95
-11.22
S
Severn Trent
2,514.000
12/08/24
-0.63
2,394.000
5.01
2,517.000
-123.000
-4.89
-5.11
L
Mayr-Melnhof
87.901
12/08/24
1.17
94.010
-6.50
96.210
-2.200
-2.29
-9.30
Tesla Motors
156.220
12/08/24
-1.26
166.005
-5.89
146.991
19.014
12.94
-1.30
L
Umweltbank
4.785
12/08/24
-1.40
5.413
-11.60
5.625
-0.212
-3.77
-19.44
⇓ freshest
⇓ 1/07/24
⇓ 6/05/24
prc diff
⇓
∅-RS
S
Intel
15.314
12/08/24
-1.78
24.395
-37.22
24.639
-0.244
-0.99
-18.28
nx-25 - 25 out of 25 instruments rated - 1/07/24 / 6/05/24 - 13 did rise, Market-Ratio(8) in GBP = 52.00 %
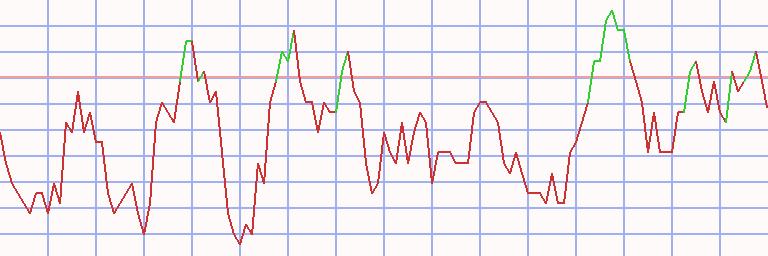
Technical Chart
Transactions nx-25 - Natur-Aktienindex in Pound sterling * L8 - 70 ex 1 (1)
⇐ L/S date buy date sell days instrument spl pieces prc buy prc sell prc diff d % asset yield long
2/01/06
23/01/06
21
INIT Innov. in Traff
100
2,122
4.711
5.065
0.354
8
10,752
253
23/01/06
3/04/06
70
Ormat Technologies
100
540
19.900
22.175
2.275
11
11,980
76
3/04/06 10/04/06 7 - cash -
10/04/06
24/04/06
14
Interface
100
1,446
8.282
7.813
-0.470
-6
11,301
-78
24/04/06 8/05/06 14 - cash -
8/05/06
15/05/06
7
Deckers Outdoor
100
1,462
7.728
6.447
-1.281
-17
9,429
-100
15/05/06 7/08/06 84 - cash -
7/08/06
28/08/06
21
Deckers Outdoor
100
1,231
7.656
7.351
-0.305
-4
9,053
-51
28/08/06 4/09/06 7 - cash -
4/09/06
18/09/06
14
Deckers Outdoor
100
1,227
7.376
8.283
0.908
12
10,166
1,960
18/09/06 2/10/06 14 - cash -
2/10/06
27/11/06
56
Deckers Outdoor
100
1,213
8.378
9.322
0.944
11
11,311
100
27/11/06
18/12/06
21
Vestas Wind Systems
100
2,962
3.818
4.252
0.434
11
12,597
550
18/12/06 5/02/07 49 - cash -
5/02/07
5/03/07
28
Vestas Wind Systems
100
2,672
4.714
4.709
-0.005
0
12,583
-1
5/03/07
12/03/07
7
Deckers Outdoor
100
1,087
11.567
12.147
0.580
5
13,213
1,182
12/03/07 19/03/07 7 - cash -
19/03/07
26/03/07
7
Vestas Wind Systems
100
2,462
5.366
5.582
0.215
4
13,743
678
26/03/07 23/04/07 28 - cash -
23/04/07
21/05/07
28
Vestas Wind Systems
100
2,064
6.659
6.865
0.206
3
14,168
49
21/05/07 28/05/07 7 - cash -
28/05/07
4/06/07
7
Vestas Wind Systems
100
2,033
6.966
7.058
0.092
1
14,355
98
4/06/07 1/10/07 119 - cash -
1/10/07
12/11/07
42
Eramet
100
78
182.614
212.444
29.830
16
16,682
272
12/11/07 7/04/08 147 - cash -
7/04/08
14/04/08
7
First Solar
100
123
134.602
145.237
10.635
8
17,990
5,174
14/04/08 28/04/08 14 - cash -
28/04/08
16/06/08
49
Eramet
100
39
458.006
467.226
9.220
2
18,349
16
16/06/08 13/04/09 301 - cash -
13/04/09
27/04/09
14
Cdn Nat Railway
100
1,304
14.066
13.778
-0.288
-2
17,974
-42
27/04/09
4/05/09
7
First Solar
100
145
123.230
128.034
4.804
4
18,671
635
4/05/09
11/05/09
7
Interface
100
4,240
4.403
4.011
-0.391
-9
17,011
-99
11/05/09
18/05/09
7
Ormat Technologies
100
631
26.925
24.624
-2.301
-9
15,559
-99
18/05/09
25/05/09
7
First Solar
100
123
126.293
119.456
-6.837
-5
14,718
-95
25/05/09
29/06/09
35
INIT Innov. in Traff
100
2,206
6.670
6.763
0.093
1
14,923
16
29/06/09 27/07/09 28 - cash -
27/07/09
10/08/09
14
eBay
100
2,674
5.579
5.674
0.095
2
15,176
55
10/08/09 17/08/09 7 - cash -
17/08/09
24/08/09
7
INIT Innov. in Traff
100
1,985
7.642
7.680
0.038
1
15,252
30
24/08/09
31/08/09
7
Encompass Health
100
1,551
9.831
9.595
-0.235
-2
14,887
-72
L/S date buy date sell days instrument spl pieces prc buy prc sell prc diff d % asset yield
31/08/09
14/09/09
14
eBay
100
2,599
5.728
6.017
0.289
5
15,638
261
14/09/09
21/09/09
7
Interface
100
3,530
4.429
4.511
0.082
2
15,929
161
21/09/09 28/09/09 7 - cash -
28/09/09
5/10/09
7
Interface
100
2,891
5.509
5.173
-0.336
-6
14,956
-96
5/10/09 12/10/09 7 - cash -
12/10/09
19/10/09
7
Interface
100
2,748
5.441
5.070
-0.371
-7
13,936
-97
19/10/09 28/12/09 70 - cash -
28/12/09
18/01/10
21
Interface
100
2,632
5.293
5.338
0.044
1
14,053
16
18/01/10 22/03/10 63 - cash -
22/03/10
19/04/10
28
Deckers Outdoor
100
459
30.575
28.871
-1.704
-6
13,271
-53
19/04/10
26/04/10
7
Interface
100
1,693
7.834
8.120
0.286
4
13,755
548
26/04/10
3/05/10
7
Deckers Outdoor
100
417
32.979
31.367
-1.612
-5
13,083
-93
3/05/10
10/05/10
7
Interface
100
1,463
8.939
8.968
0.029
0
13,126
19
10/05/10 26/07/10 77 - cash -
26/07/10
9/08/10
14
Deckers Outdoor
100
394
33.284
31.267
-2.018
-6
12,331
-80
9/08/10 11/10/10 63 - cash -
11/10/10
1/11/10
21
Interface
100
1,355
9.100
8.952
-0.148
-2
12,130
-25
1/11/10 8/11/10 7 - cash -
8/11/10
15/11/10
7
Deckers Outdoor
100
313
38.713
37.802
-0.910
-2
11,845
-71
15/11/10 22/11/10 7 - cash -
22/11/10
29/11/10
7
Deckers Outdoor
100
277
42.689
46.834
4.146
10
12,994
12,458
29/11/10 27/12/10 28 - cash -
27/12/10
3/01/11
7
Deckers Outdoor
100
236
55.045
52.046
-2.999
-5
12,286
-95
3/01/11 7/02/11 35 - cash -
7/02/11
14/02/11
7
Deckers Outdoor
100
238
51.438
54.009
2.571
5
12,898
1,172
14/02/11 9/05/11 84 - cash -
9/05/11
23/05/11
14
Deckers Outdoor
100
236
54.571
53.858
-0.714
-1
12,730
-29
23/05/11 7/11/11 168 - cash -
7/11/11
14/11/11
7
Deckers Outdoor
100
180
70.351
67.075
-3.276
-5
12,140
-92
14/11/11 30/01/12 77 - cash -
30/01/12
20/02/12
21
Intel
100
714
17.002
17.148
0.146
1
12,245
16
20/02/12
26/03/12
35
Tesla Motors
100
8,431
1.452
1.571
0.119
8
13,246
127
26/03/12 17/09/12 175 - cash -
17/09/12
24/09/12
7
eBay
100
1,011
13.098
12.788
-0.311
-2
12,932
-71
24/09/12 17/12/12 84 - cash -
17/12/12
28/01/13
42
First Solar
100
653
19.803
17.931
-1.873
-9
11,709
-58
28/01/13
4/02/13
7
eBay
100
785
14.904
14.937
0.033
0
11,735
12
4/02/13
25/02/13
21
First Solar
100
591
19.838
16.719
-3.119
-16
9,891
-95
25/02/13
4/03/13
7
Umweltbank
100
1,500
6.594
6.424
-0.169
-3
9,637
-74
4/03/13
11/03/13
7
Interface
100
795
12.116
12.321
0.205
2
9,800
140
L/S date buy date sell days instrument spl pieces prc buy prc sell prc diff d % asset yield
11/03/13 1/04/13 21 - cash -
1/04/13
8/04/13
7
Shimano
100
18,514
0.529
0.534
0.005
1
9,884
56
8/04/13
15/04/13
7
First Solar
100
408
24.201
24.832
0.631
3
10,141
283
15/04/13 13/05/13 28 - cash -
13/05/13
20/05/13
7
Tesla Motors
100
2,661
3.811
3.952
0.142
4
10,518
570
20/05/13 19/08/13 91 - cash -
19/08/13
26/08/13
7
Tesla Motors
100
1,704
6.171
7.028
0.857
14
11,978
87,903
26/08/13 23/09/13 28 - cash -
23/09/13
7/10/13
14
Tesla Motors
100
1,577
7.594
7.583
-0.011
0
11,961
-4
7/10/13 14/10/13 7 - cash -
14/10/13
11/11/13
28
Tesla Motors
100
1,594
7.500
6.033
-1.467
-20
9,623
-94
11/11/13 24/03/14 133 - cash -
24/03/14
31/03/14
7
Tesla Motors
100
1,081
8.899
8.339
-0.559
-6
9,018
-97
31/03/14
14/04/14
14
Vestas Wind Systems
100
1,870
4.822
4.831
0.009
0
9,034
5
14/04/14 23/06/14 70 - cash -
23/06/14
30/06/14
7
Vestas Wind Systems
100
1,510
5.979
5.897
-0.082
-1
8,910
-51
30/06/14 8/09/14 70 - cash -
8/09/14
15/09/14
7
Tesla Motors
100
762
11.683
10.425
-1.257
-11
7,952
-100
15/09/14 1/12/14 77 - cash -
1/12/14
5/01/15
35
Shimano
100
8,876
0.896
0.861
-0.035
-4
7,639
-34
5/01/15 12/01/15 7 - cash -
12/01/15
19/01/15
7
Shimano
100
8,780
0.870
0.863
-0.007
-1
7,581
-33
19/01/15 9/02/15 21 - cash -
9/02/15
23/03/15
42
Shimano
100
8,714
0.870
1.068
0.198
23
9,307
494
23/03/15 6/04/15 14 - cash -
6/04/15
13/04/15
7
Shimano
100
9,107
1.022
1.014
-0.008
-1
9,235
-33
13/04/15
20/04/15
7
L'Occitane
100
4,727
1.953
1.841
-0.113
-6
8,702
-95
20/04/15 19/10/15 182 - cash -
19/10/15
2/11/15
14
Vestas Wind Systems
100
1,178
7.385
7.702
0.317
4
9,076
200
2/11/15 9/11/15 7 - cash -
9/11/15
16/11/15
7
Vestas Wind Systems
100
1,134
8.002
8.050
0.047
1
9,130
36
16/11/15 14/03/16 119 - cash -
14/03/16
28/03/16
14
First Solar
100
184
49.569
47.969
-1.601
-3
8,835
-58
28/03/16 4/04/16 7 - cash -
4/04/16
11/04/16
7
First Solar
100
187
47.142
42.114
-5.028
-11
7,895
-100
11/04/16
25/04/16
14
Vestas Wind Systems
100
804
9.813
8.990
-0.823
-8
7,234
-90
25/04/16
2/05/16
7
Ormat Technologies
100
243
29.688
29.817
0.129
0
7,265
25
2/05/16 11/07/16 70 - cash -
11/07/16
18/07/16
7
LTC Properties
100
177
40.826
39.440
-1.386
-3
7,020
-83
18/07/16
25/07/16
7
Eramet
100
235
29.754
29.056
-0.699
-2
6,855
-71
25/07/16 8/08/16 14 - cash -
8/08/16
15/08/16
7
Ormat Technologies
100
185
36.869
37.188
0.319
1
6,914
57
15/08/16
22/08/16
7
Deckers Outdoor
100
129
53.220
51.638
-1.582
-3
6,710
-79
L/S date buy date sell days instrument spl pieces prc buy prc sell prc diff d % asset yield
22/08/16
12/09/16
21
Vestas Wind Systems
100
512
13.084
12.437
-0.647
-5
6,379
-59
12/09/16 16/01/17 126 - cash -
16/01/17
23/01/17
7
Eramet
100
124
51.198
46.370
-4.829
-9
5,781
-99
23/01/17 30/01/17 7 - cash -
30/01/17
6/02/17
7
Eramet
100
126
45.845
47.275
1.430
3
5,961
396
6/02/17 27/02/17 21 - cash -
27/02/17
6/03/17
7
Eramet
100
137
43.379
43.379
0.000
0
5,961
0
6/03/17 3/04/17 28 - cash -
3/04/17
10/07/17
98
Tesla Motors
100
374
15.936
16.358
0.422
3
6,119
10
10/07/17 17/07/17 7 - cash -
17/07/17
24/07/17
7
Tesla Motors
100
375
16.303
17.529
1.226
8
6,578
4,288
24/07/17 16/10/17 84 - cash -
16/10/17
30/10/17
14
Eramet
100
107
60.979
64.776
3.797
6
6,985
383
30/10/17 8/01/18 70 - cash -
8/01/18
5/02/18
28
Eramet
100
76
91.590
97.569
5.980
7
7,439
128
5/02/18 4/02/19 364 - cash -
4/02/19
25/02/19
21
Verbund
100
190
39.106
35.486
-3.620
-9
6,751
-82
25/02/19
4/03/19
7
Deckers Outdoor
100
59
113.016
109.934
-3.083
-3
6,569
-76
4/03/19
25/03/19
21
Verbund
100
179
36.515
37.121
0.606
2
6,678
33
25/03/19 8/07/19 105 - cash -
8/07/19
22/07/19
14
Deckers Outdoor
100
47
142.070
140.657
-1.412
-1
6,611
-23
22/07/19 29/07/19 7 - cash -
29/07/19
5/08/19
7
First Solar
100
122
54.005
51.040
-2.965
-5
6,250
-95
5/08/19 14/10/19 70 - cash -
14/10/19
18/11/19
35
INIT Innov. in Traff
100
339
18.392
17.520
-0.873
-5
5,954
-40
18/11/19
25/11/19
7
Tesla Motors
100
330
17.989
17.386
-0.602
-3
5,755
-83
25/11/19
16/12/19
21
INIT Innov. in Traff
100
315
18.269
19.484
1.215
7
6,138
206
16/12/19
30/12/19
14
Tesla Motors
100
321
19.077
21.087
2.010
11
6,783
1,261
30/12/19 11/05/20 133 - cash -
11/05/20
6/07/20
56
Tesla Motors
100
154
43.800
73.168
29.368
67
11,306
2,734
6/07/20 20/07/20 14 - cash -
20/07/20
27/07/20
7
Tesla Motors
100
130
86.542
79.689
-6.853
-8
10,415
-99
27/07/20 10/08/20 14 - cash -
10/08/20
17/08/20
7
Tesla Motors
100
144
72.258
93.373
21.115
29
13,456
> 999,999
17/08/20 19/10/20 63 - cash -
19/10/20
26/10/20
7
Tesla Motors
100
121
110.557
107.510
-3.047
-3
13,087
-77
26/10/20 16/11/20 21 - cash -
16/11/20
23/11/20
7
Tesla Motors
100
127
102.992
130.217
27.225
26
16,544
> 999,999
23/11/20 30/11/20 7 - cash -
30/11/20
7/12/20
7
Tesla Motors
100
116
141.630
160.419
18.789
13
18,724
66,106
7/12/20 14/12/20 7 - cash -
14/12/20
1/03/21
77
Tesla Motors
100
117
159.936
155.825
-4.111
-3
18,243
-12
1/03/21 19/04/21 49 - cash -
19/04/21
10/05/21
21
Tesla Motors
100
107
170.235
148.194
-22.041
-13
15,885
-91
L/S date buy date sell days instrument spl pieces prc buy prc sell prc diff d % asset yield
10/05/21 28/06/21 49 - cash -
28/06/21
5/07/21
7
Interface
100
1,456
10.906
11.194
0.288
3
16,304
289
5/07/21
19/07/21
14
L'Occitane
100
5,941
2.744
2.745
0.001
0
16,309
1
19/07/21 13/09/21 56 - cash -
13/09/21
20/09/21
7
Eramet
100
279
58.359
55.019
-3.340
-6
15,377
-95
20/09/21 8/08/22 322 - cash -
8/08/22
22/08/22
14
First Solar
100
174
88.328
97.237
8.909
10
16,927
1,125
22/08/22 28/11/22 98 - cash -
28/11/22
19/12/22
21
First Solar
100
122
138.526
128.675
-9.851
-7
15,725
-72
19/12/22 13/02/23 56 - cash -
13/02/23
27/02/23
14
First Solar
100
114
137.648
137.681
0.033
0
15,729
1
27/02/23 4/12/23 280 - cash -
4/12/23
25/12/23
21
Deckers Outdoor
100
28
549.493
546.518
-2.976
-1
15,646
-9
25/12/23
22/01/24
28
Intel
100
413
37.816
37.896
0.080
0
15,678
3
22/01/24 25/03/24 63 - cash -
25/03/24
8/04/24
14
Interface
100
1,151
13.613
13.120
-0.492
-4
15,112
-62
8/04/24 13/05/24 35 - cash -
13/05/24
20/05/24
7
Sprouts
100
249
60.556
62.255
1.699
3
15,535
323
20/05/24 3/06/24 14 - cash -
3/06/24
10/06/24
7
Sprouts
100
251
61.758
59.831
-1.927
-3
15,051
-81
10/06/24
17/06/24
7
First Solar
100
68
219.895
206.322
-13.574
-6
14,128
-96
17/06/24 28/06/26 741 - cash -
accum 2/01/06
17/06/24 1820
days out of 7482 invested (24%)
41
14,128
7
Instrument Related Contribution
instrument L/S date buy date sell days prc buy prc sell prc diff d % total Tesla Motors long 20/02/12 26/03/12 35 1.45 1.57 0.12 8.18 13/05/13 20/05/13 7 3.81 3.95 0.14 3.72 19/08/13 26/08/13 7 6.17 7.03 0.86 13.89 23/09/13 7/10/13 14 7.59 7.58 -0.01 -0.15 14/10/13 11/11/13 28 7.50 6.03 -1.47 -19.56 24/03/14 31/03/14 7 8.90 8.34 -0.56 -6.29 8/09/14 15/09/14 7 11.68 10.43 -1.26 -10.76 3/04/17 10/07/17 98 15.94 16.36 0.42 2.65 17/07/17 24/07/17 7 16.30 17.53 1.23 7.52 18/11/19 25/11/19 7 17.99 17.39 -0.60 -3.35 16/12/19 30/12/19 14 19.08 21.09 2.01 10.53 11/05/20 6/07/20 56 43.80 73.17 29.37 67.05 20/07/20 27/07/20 7 86.54 79.69 -6.85 -7.92 10/08/20 17/08/20 7 72.26 93.37 21.12 29.22 19/10/20 26/10/20 7 110.56 107.51 -3.05 -2.76 16/11/20 23/11/20 7 102.99 130.22 27.22 26.43 30/11/20 7/12/20 7 141.63 160.42 18.79 13.27 14/12/20 1/03/21 77 159.94 155.83 -4.11 -2.57 19/04/21 10/05/21 21 170.23 148.19 -22.04 -12.95 137.60 Shimano 1/04/13 8/04/13 7 0.53 0.53 0.00 0.86 1/12/14 5/01/15 35 0.90 0.86 -0.04 -3.93 12/01/15 19/01/15 7 0.87 0.86 -0.01 -0.77 9/02/15 23/03/15 42 0.87 1.07 0.20 22.76 6/04/15 13/04/15 7 1.02 1.01 -0.01 -0.77 17.13 Eramet 1/10/07 12/11/07 42 182.61 212.44 29.83 16.33 28/04/08 16/06/08 49 458.01 467.23 9.22 2.01 18/07/16 25/07/16 7 29.75 29.06 -0.70 -2.35 16/01/17 23/01/17 7 51.20 46.37 -4.83 -9.43 30/01/17 6/02/17 7 45.85 47.28 1.43 3.12 27/02/17 6/03/17 7 43.38 43.38 0.00 0.00 16/10/17 30/10/17 14 60.98 64.78 3.80 6.23 8/01/18 5/02/18 28 91.59 97.57 5.98 6.53 13/09/21 20/09/21 7 58.36 55.02 -3.34 -5.72 15.47 instrument L/S date buy date sell days prc buy prc sell prc diff d % total INIT Innov. in Traff 2/01/06 23/01/06 21 4.71 5.07 0.35 7.52 25/05/09 29/06/09 35 6.67 6.76 0.09 1.39 17/08/09 24/08/09 7 7.64 7.68 0.04 0.50 14/10/19 18/11/19 35 18.39 17.52 -0.87 -4.74 25/11/19 16/12/19 21 18.27 19.48 1.22 6.65 11.32 Vestas Wind Systems 27/11/06 18/12/06 21 3.82 4.25 0.43 11.37 5/02/07 5/03/07 28 4.71 4.71 -0.01 -0.11 19/03/07 26/03/07 7 5.37 5.58 0.22 4.01 23/04/07 21/05/07 28 6.66 6.86 0.21 3.09 28/05/07 4/06/07 7 6.97 7.06 0.09 1.32 31/03/14 14/04/14 14 4.82 4.83 0.01 0.18 23/06/14 30/06/14 7 5.98 5.90 -0.08 -1.37 19/10/15 2/11/15 14 7.38 7.70 0.32 4.30 9/11/15 16/11/15 7 8.00 8.05 0.05 0.59 11/04/16 25/04/16 14 9.81 8.99 -0.82 -8.39 22/08/16 12/09/16 21 13.08 12.44 -0.65 -4.94 9.11 eBay 27/07/09 10/08/09 14 5.58 5.67 0.09 1.69 31/08/09 14/09/09 14 5.73 6.02 0.29 5.04 17/09/12 24/09/12 7 13.10 12.79 -0.31 -2.37 28/01/13 4/02/13 7 14.90 14.94 0.03 0.22 4.52 Ormat Technologies 23/01/06 3/04/06 70 19.90 22.17 2.27 11.43 11/05/09 18/05/09 7 26.92 24.62 -2.30 -8.55 25/04/16 2/05/16 7 29.69 29.82 0.13 0.43 8/08/16 15/08/16 7 36.87 37.19 0.32 0.87 3.24 Intel 30/01/12 20/02/12 21 17.00 17.15 0.15 0.86 25/12/23 22/01/24 28 37.82 37.90 0.08 0.21 1.07 instrument L/S date buy date sell days prc buy prc sell prc diff d % total Sprouts 13/05/24 20/05/24 7 60.56 62.25 1.70 2.80 3/06/24 10/06/24 7 61.76 59.83 -1.93 -3.12 -0.40 Cdn Nat Railway 13/04/09 27/04/09 14 14.07 13.78 -0.29 -2.05 -2.05 Encompass Health 24/08/09 31/08/09 7 9.83 9.60 -0.24 -2.39 -2.39 Umweltbank 25/02/13 4/03/13 7 6.59 6.42 -0.17 -2.57 -2.57 LTC Properties 11/07/16 18/07/16 7 40.83 39.44 -1.39 -3.39 -3.39 L'Occitane 13/04/15 20/04/15 7 1.95 1.84 -0.11 -5.77 5/07/21 19/07/21 14 2.74 2.74 0.00 0.03 -5.74 Verbund 4/02/19 25/02/19 21 39.11 35.49 -3.62 -9.26 4/03/19 25/03/19 21 36.51 37.12 0.61 1.66 -7.75 Deckers Outdoor 8/05/06 15/05/06 7 7.73 6.45 -1.28 -16.57 7/08/06 28/08/06 21 7.66 7.35 -0.31 -3.99 4/09/06 18/09/06 14 7.38 8.28 0.91 12.30 2/10/06 27/11/06 56 8.38 9.32 0.94 11.26 5/03/07 12/03/07 7 11.57 12.15 0.58 5.01 22/03/10 19/04/10 28 30.58 28.87 -1.70 -5.57 26/04/10 3/05/10 7 32.98 31.37 -1.61 -4.89 26/07/10 9/08/10 14 33.28 31.27 -2.02 -6.06 8/11/10 15/11/10 7 38.71 37.80 -0.91 -2.35 22/11/10 29/11/10 7 42.69 46.83 4.15 9.71 27/12/10 3/01/11 7 55.04 52.05 -3.00 -5.45 7/02/11 14/02/11 7 51.44 54.01 2.57 5.00 9/05/11 23/05/11 14 54.57 53.86 -0.71 -1.31 7/11/11 14/11/11 7 70.35 67.07 -3.28 -4.66 15/08/16 22/08/16 7 53.22 51.64 -1.58 -2.97 25/02/19 4/03/19 7 113.02 109.93 -3.08 -2.73 8/07/19 22/07/19 14 142.07 140.66 -1.41 -0.99 4/12/23 25/12/23 21 549.49 546.52 -2.98 -0.54 -17.52 instrument L/S date buy date sell days prc buy prc sell prc diff d % total Interface 10/04/06 24/04/06 14 8.28 7.81 -0.47 -5.67 4/05/09 11/05/09 7 4.40 4.01 -0.39 -8.89 14/09/09 21/09/09 7 4.43 4.51 0.08 1.86 28/09/09 5/10/09 7 5.51 5.17 -0.34 -6.11 12/10/09 19/10/09 7 5.44 5.07 -0.37 -6.82 28/12/09 18/01/10 21 5.29 5.34 0.04 0.84 19/04/10 26/04/10 7 7.83 8.12 0.29 3.65 3/05/10 10/05/10 7 8.94 8.97 0.03 0.33 11/10/10 1/11/10 21 9.10 8.95 -0.15 -1.63 4/03/13 11/03/13 7 12.12 12.32 0.20 1.69 28/06/21 5/07/21 7 10.91 11.19 0.29 2.64 25/03/24 8/04/24 14 13.61 13.12 -0.49 -3.62 -20.52 First Solar 7/04/08 14/04/08 7 134.60 145.24 10.64 7.90 27/04/09 4/05/09 7 123.23 128.03 4.80 3.90 18/05/09 25/05/09 7 126.29 119.46 -6.84 -5.41 17/12/12 28/01/13 42 19.80 17.93 -1.87 -9.46 4/02/13 25/02/13 21 19.84 16.72 -3.12 -15.72 8/04/13 15/04/13 7 24.20 24.83 0.63 2.61 14/03/16 28/03/16 14 49.57 47.97 -1.60 -3.23 4/04/16 11/04/16 7 47.14 42.11 -5.03 -10.67 29/07/19 5/08/19 7 54.00 51.04 -2.96 -5.49 8/08/22 22/08/22 14 88.33 97.24 8.91 10.09 28/11/22 19/12/22 21 138.53 128.67 -9.85 -7.11 13/02/23 27/02/23 14 137.65 137.68 0.03 0.02 10/06/24 17/06/24 7 219.90 206.32 -13.57 -6.17 -34.90
Annotations
5/08/24 nx-25 Visa replaces L'Occitane 18/09/23 nx-25 Eramet replaces Boiron 25/08/22 Tesla Motors stock split 1:3 (three for one) 18/08/22 nx-25 Oatly Group replaces Beyond Meat 27/05/22 Tomra Systems stock split 1:2 (two for one) 31/05/21 nx-25 Canadian National Railway replaces Kansas City Southern due to upcoming merger 6/06/20 nx-25 Deckers Outdoor Corporation replaces Geox 7/02/20 nx-25 Beyond Meat replaces SunOpta 2/01/18 HealthSouth renames herself Encompass Health Corporation and gets new IDs and ticker 18/09/17 Umweltbank stock split 1:5 (five for one) 26/07/17 nx-25 LTC Properties and Sprouts Farmers Market replace EnerNOC (->Enel) and Whole Foods (-> Amazon) 1/06/17 nx-25 Intel replaces Ricoh due to national weight shifts in MSCI World 17/02/16 SOM Price Index The nx-25 index is published by Öko-Invest Verlag, Vienna. 25/01/16 nx-25 complete analysis nx-25 HealthSouth replaces Keurig Green Mountain (2015-12-31) HealthSouth recording started 17/08/15 nx-25 complete analysis nx-25 Gaiam replaced by eBay 20/07/15 eBay spin-off of PayPal ratio 2790 : 3839 14/03/15 nx-25 first complete analysis
write an annotation