| | |
| | |

Auswertung - STOXX Nordic 30 - 1.07.24 - RS = 22
⇐
| |
|
⇓Wertpapier |
jüngster |
⇓ ΔTag |
1.07.24 |
⇓ ΔWo |
29.01.24 |
K-Diff |
Δ22 |
Whrg |
⇓∅-RS |
| |  |
 |
 |
|
|
 |
Stoxx Nordic 30 |
13.553,700 |
12.08.24 |
-0,46 |
14.127,600 |
-4,06 |
13.465,100 |
662,500 |
4,92 |
EUR |
7,34 |
| | |
|
|
|
|
|
Novo Nordisk |
892,900 |
12.08.24 |
-2,80 |
1.004,600 |
-11,12 |
745,700 |
258,900 |
34,72 |
DKK |
37,87 |
| | |
|
|
|
L |
|
Atlas Copco A |
177,150 |
12.08.24 |
0,28 |
198,800 |
-10,89 |
165,800 |
33,000 |
19,90 |
SEK |
22,21 |
| | |
|
|
|
L |
|
Investor |
286,000 |
12.08.24 |
0,30 |
290,050 |
-1,40 |
244,700 |
45,350 |
18,53 |
SEK |
22,11 |
| | |
|
|
|
|
|
Novonesis |
429,200 |
12.08.24 |
0,12 |
422,400 |
1,61 |
361,400 |
61,000 |
16,88 |
DKK |
14,99 |
| | |
|
|
|
L |
|
Essity B |
297,100 |
12.08.24 |
-0,97 |
275,900 |
7,68 |
239,400 |
36,500 |
15,25 |
SEK |
6,28 |
| | |
|
|
|
|
|
EQT |
316,600 |
12.08.24 |
-0,13 |
314,700 |
0,60 |
279,000 |
35,700 |
12,80 |
SEK |
23,37 |
| | |
|
|
|
L |
|
Ericsson |
71,080 |
12.08.24 |
1,14 |
67,100 |
5,93 |
60,390 |
6,710 |
11,11 |
SEK |
9,98 |
| | |
|
|
|
|
|
Volvo |
255,700 |
12.08.24 |
-0,12 |
273,400 |
-6,47 |
247,150 |
26,250 |
10,62 |
SEK |
6,58 |
| | |
|
|
|
|
|
Coloplast |
884,400 |
12.08.24 |
0,25 |
832,400 |
6,25 |
775,800 |
56,600 |
7,30 |
DKK |
4,76 |
| | |
|
|
|
|
|
S.E.B |
150,700 |
12.08.24 |
-0,10 |
157,800 |
-4,50 |
149,500 |
8,300 |
5,55 |
SEK |
11,92 |
| | |
|
|
|
|
|
Assa Abloy |
305,900 |
12.08.24 |
0,13 |
300,300 |
1,86 |
286,200 |
14,100 |
4,93 |
SEK |
11,51 |
| | |
|
|
|
|
|
Swedbank |
207,100 |
12.08.24 |
-0,86 |
222,600 |
-6,96 |
213,000 |
9,600 |
4,51 |
SEK |
4,69 |
| | |
|
|
|
|
|
Hexagon |
100,700 |
12.08.24 |
-0,15 |
120,400 |
-16,36 |
115,250 |
5,150 |
4,47 |
SEK |
4,61 |
| | |
|
|
|
|
|
Sampo |
40,490 |
12.08.24 |
0,40 |
40,180 |
0,77 |
38,590 |
1,590 |
4,12 |
EUR |
-2,21 |
| | |
|
|
|
L |
|
Nokia |
3,518 |
12.08.24 |
1,05 |
3,670 |
-4,14 |
3,553 |
0,117 |
3,29 |
EUR |
1,09 |
| | |
|
|
|
|
|
Equinor |
304,000 |
12.08.24 |
3,19 |
305,500 |
-0,49 |
301,800 |
3,700 |
1,23 |
NOK |
-8,23 |
| | |
|
|
|
S |
|
DNB |
214,700 |
12.08.24 |
0,14 |
212,200 |
1,18 |
211,700 |
0,500 |
0,24 |
NOK |
-0,15 |
| | |
|
|
|
|
|
Nordea Bank |
119,800 |
12.08.24 |
-0,13 |
130,150 |
-7,95 |
130,040 |
0,110 |
0,08 |
SEK |
4,68 |
| | |
|
|
|
L |
|
Kone |
46,750 |
12.08.24 |
-0,32 |
46,200 |
1,19 |
46,610 |
-0,410 |
-0,88 |
EUR |
7,76 |
| | |
|
|
|
|
|
Sandvik |
202,600 |
12.08.24 |
-0,54 |
215,000 |
-5,77 |
217,600 |
-2,600 |
-1,19 |
SEK |
0,70 |
| | |
|
|
|
|
|
UPM-Kymmene |
29,730 |
12.08.24 |
0,17 |
32,850 |
-9,50 |
34,050 |
-1,200 |
-3,52 |
EUR |
4,14 |
| | |
|
|
|
L |
|
Ørsted |
417,500 |
12.08.24 |
0,63 |
376,000 |
11,04 |
394,400 |
-18,400 |
-4,67 |
DKK |
-4,09 |
| | |
|
|
|
L |
|
Carlsberg B |
801,600 |
12.08.24 |
|
844,000 |
-5,02 |
892,800 |
-48,800 |
-5,47 |
DKK |
0,75 |
| | |
|
|
|
L |
|
DSV |
1.215,500 |
12.08.24 |
|
1.143,500 |
6,30 |
1.237,000 |
-93,500 |
-7,56 |
DKK |
-8,60 |
| |
|
⇓Wertpapier |
jüngster |
⇓ ΔTag |
1.07.24 |
⇓ ΔWo |
29.01.24 |
K-Diff |
Δ22 |
Whrg |
⇓∅-RS |
| | |
|
|
|
S |
|
Evolution |
997,600 |
12.08.24 |
-0,88 |
1.105,500 |
-9,76 |
1.222,400 |
-116,900 |
-9,56 |
SEK |
-11,48 |
| | |
|
|
|
|
|
Genmab |
1.821,000 |
12.08.24 |
0,89 |
1.734,500 |
4,99 |
1.921,500 |
-187,000 |
-9,73 |
DKK |
-18,28 |
| | |
|
|
|
S |
|
Svenska Handelsbank |
102,150 |
12.08.24 |
0,29 |
101,800 |
0,34 |
113,300 |
-11,500 |
-10,15 |
SEK |
-1,38 |
| | |
|
|
|
|
|
Vestas Wind Systems |
152,250 |
12.08.24 |
-7,76 |
162,100 |
-6,08 |
197,080 |
-34,980 |
-17,75 |
DKK |
-1,36 |
| | |
|
|
|
|
|
NIBE Industrier |
44,580 |
12.08.24 |
0,18 |
45,150 |
-1,26 |
62,520 |
-17,370 |
-27,78 |
SEK |
-27,82 |
| | |
|
|
|
S |
|
Neste |
18,205 |
12.08.24 |
-1,54 |
16,860 |
7,98 |
32,850 |
-15,990 |
-48,68 |
EUR |
-40,24 |
| Nordic 30 - 30 von 30 Wertpapieren bewertet - 1.07.24 / 29.01.24 - 18 davon sind besser, Markt-Kennzahl(22) = 60,00 % |
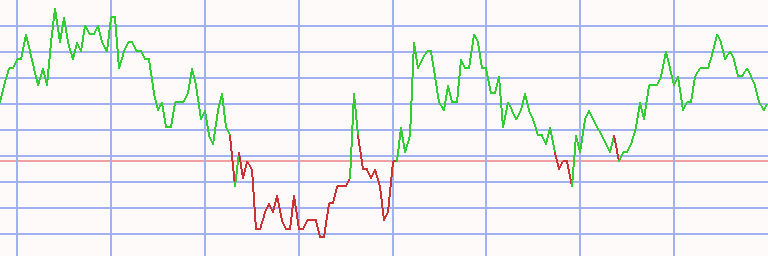
Technischer Chart
Transaktionen STOXX Nordic 30 * S22 - 37/37 (1)
|
⇐ |
| |
| L/S | K-Datum | V-Datum | Tage | | Wertpapier | Spl | Stück | Whrg | K-Kurs | V-Kurs | S-V-Kurs | K-Diff | D % | Kapital | Rdte | |
| 2.01.06 |
12.06.06 |
161 |
|
- cash - |
| short |
12.06.06 |
19.06.06 |
7 |
|
|
|
Yara International |
100 |
125 |
NOK |
79,500 |
80,500 |
78,500 |
-1,000 |
-1 |
9.875 |
-48 |
|
| 19.06.06 |
10.07.06 |
21 |
|
- cash - |
| |
10.07.06 |
25.09.06 |
77 |
|
|
|
Møller-Mærsk B |
100 |
114 |
DKK |
86,482 |
97,948 |
75,016 |
-11,466 |
-13 |
8.568 |
-49 |
|
| 25.09.06 |
3.09.07 |
343 |
|
- cash - |
| |
3.09.07 |
10.09.07 |
7 |
|
|
|
Swedbank |
100 |
40 |
SEK |
210,500 |
205,000 |
216,148 |
5,648 |
3 |
8.794 |
298 |
|
| 10.09.07 |
17.09.07 |
7 |
|
- cash - |
| |
17.09.07 |
24.09.07 |
7 |
|
|
|
Danske Bank |
100 |
47 |
DKK |
186,000 |
190,860 |
181,140 |
-4,860 |
-3 |
8.565 |
-75 |
|
| 24.09.07 |
12.11.07 |
49 |
|
- cash - |
| |
12.11.07 |
3.12.07 |
21 |
|
|
|
Ericsson |
100 |
94 |
SEK |
91,100 |
79,700 |
104,131 |
13,031 |
14 |
9.790 |
921 |
|
| 3.12.07 |
10.12.07 |
7 |
|
- cash - |
| |
10.12.07 |
12.05.08 |
154 |
|
|
|
Ericsson |
100 |
121 |
SEK |
80,400 |
81,500 |
79,300 |
-1,100 |
-1 |
9.657 |
-3 |
|
| 12.05.08 |
19.05.08 |
7 |
|
- cash - |
| |
19.05.08 |
16.06.08 |
28 |
|
|
|
Swedbank |
100 |
65 |
SEK |
146,500 |
128,000 |
167,674 |
21,174 |
14 |
11.033 |
481 |
|
| 16.06.08 |
23.06.08 |
7 |
|
- cash - |
| |
23.06.08 |
9.03.09 |
259 |
|
|
|
Swedbank |
100 |
97 |
SEK |
113,500 |
23,900 |
539,006 |
425,506 |
375 |
52.308 |
798 |
|
| 9.03.09 |
16.03.09 |
7 |
|
- cash - |
| |
16.03.09 |
23.03.09 |
7 |
|
|
|
S.E.B |
100 |
1.881 |
SEK |
27,800 |
27,000 |
28,624 |
0,824 |
3 |
53.857 |
358 |
|
| 23.03.09 |
30.03.09 |
7 |
|
- cash - |
| |
30.03.09 |
6.04.09 |
7 |
|
|
|
S.E.B |
100 |
1.662 |
SEK |
32,400 |
30,700 |
34,194 |
1,794 |
6 |
56.839 |
1.561 |
|
| 6.04.09 |
23.05.11 |
777 |
|
- cash - |
| |
23.05.11 |
30.05.11 |
7 |
|
|
|
Nokia |
100 |
9.902 |
EUR |
5,740 |
4,550 |
7,241 |
1,501 |
26 |
71.704 |
> 999.999 |
|
| 30.05.11 |
6.06.11 |
7 |
|
- cash - |
| |
6.06.11 |
27.06.11 |
21 |
|
|
|
Nokia |
100 |
16.675 |
EUR |
4,300 |
4,390 |
4,210 |
-0,090 |
-2 |
70.203 |
-31 |
|
| 27.06.11 |
11.07.11 |
14 |
|
- cash - |
| |
11.07.11 |
2.01.12 |
175 |
|
|
|
Nokia |
100 |
17.863 |
EUR |
3,930 |
4,180 |
3,680 |
-0,250 |
-6 |
65.737 |
-13 |
|
| 2.01.12 |
4.06.12 |
154 |
|
- cash - |
| |
4.06.12 |
11.06.12 |
7 |
|
|
|
Nokia |
100 |
30.862 |
EUR |
2,130 |
1,920 |
2,363 |
0,233 |
11 |
72.928 |
22.329 |
|
| 11.06.12 |
25.06.12 |
14 |
|
- cash - |
| |
25.06.12 |
2.07.12 |
7 |
|
|
|
Nokia |
100 |
42.647 |
EUR |
1,710 |
1,640 |
1,783 |
0,073 |
4 |
76.041 |
784 |
|
| 2.07.12 |
9.07.12 |
7 |
|
- cash - |
| |
9.07.12 |
16.07.12 |
7 |
|
|
|
Nokia |
100 |
52.806 |
EUR |
1,440 |
1,420 |
1,460 |
0,020 |
1 |
77.113 |
107 |
|
| 16.07.12 |
27.08.12 |
42 |
|
- cash - |
| |
27.08.12 |
3.09.12 |
7 |
|
|
|
Nokia |
100 |
31.219 |
EUR |
2,470 |
1,990 |
3,066 |
0,596 |
24 |
95.713 |
> 999.999 |
|
| 3.09.12 |
17.08.15 |
1078 |
|
- cash - |
| |
17.08.15 |
9.11.15 |
84 |
|
|
|
Fortum |
100 |
6.046 |
EUR |
15,830 |
13,740 |
18,238 |
2,408 |
15 |
110.272 |
85 |
|
| 9.11.15 |
16.11.15 |
7 |
|
- cash - |
| |
16.11.15 |
23.11.15 |
7 |
|
|
|
Fortum |
100 |
8.235 |
EUR |
13,390 |
14,030 |
12,750 |
-0,640 |
-5 |
105.001 |
-92 |
|
| 23.11.15 |
14.12.15 |
21 |
|
- cash - |
| |
14.12.15 |
25.01.16 |
42 |
|
|
|
Møller-Mærsk B |
100 |
1.147 |
DKK |
91,500 |
82,750 |
101,175 |
9,675 |
11 |
116.099 |
140 |
|
| 25.01.16 |
1.02.16 |
7 |
|
- cash - |
| |
1.02.16 |
22.02.16 |
21 |
|
|
|
SKF A |
100 |
900 |
SEK |
128,900 |
149,900 |
107,900 |
-21,000 |
-16 |
97.199 |
-95 |
|
| 22.02.16 |
14.03.16 |
21 |
|
- cash - |
| |
14.03.16 |
30.05.16 |
77 |
|
|
|
Møller-Mærsk B |
100 |
1.078 |
DKK |
90,100 |
85,800 |
94,616 |
4,515 |
5 |
102.066 |
26 |
|
| 30.05.16 |
27.06.16 |
28 |
|
- cash - |
| |
27.06.16 |
4.07.16 |
7 |
|
|
|
Yara International |
100 |
396 |
NOK |
257,100 |
265,800 |
248,400 |
-8,700 |
-3 |
98.621 |
-83 |
|
| 4.07.16 |
5.03.18 |
609 |
|
- cash - |
| |
5.03.18 |
16.04.18 |
42 |
|
|
|
Hennes & Mauritz |
100 |
735 |
SEK |
134,020 |
133,200 |
134,845 |
0,825 |
1 |
99.227 |
5 |
|
| 16.04.18 |
28.05.18 |
42 |
|
- cash - |
| |
28.05.18 |
9.07.18 |
42 |
|
|
|
Pandora |
100 |
203 |
DKK |
488,000 |
417,000 |
571,089 |
83,089 |
17 |
116.095 |
292 |
|
| L/S | K-Datum | V-Datum | Tage | | Wertpapier | Spl | Stück | Whrg | K-Kurs | V-Kurs | S-V-Kurs | K-Diff | D % | Kapital | Rdte | |
| 9.07.18 |
15.10.18 |
98 |
|
- cash - |
| |
15.10.18 |
5.11.18 |
21 |
|
|
|
Danske Bank |
100 |
831 |
DKK |
139,600 |
135,250 |
144,090 |
4,490 |
3 |
119.826 |
73 |
|
| 5.11.18 |
19.11.18 |
14 |
|
- cash - |
| |
19.11.18 |
3.12.18 |
14 |
|
|
|
Danske Bank |
100 |
884 |
DKK |
135,450 |
133,250 |
137,686 |
2,236 |
2 |
121.803 |
53 |
|
| 3.12.18 |
10.12.18 |
7 |
|
- cash - |
| |
10.12.18 |
17.12.18 |
7 |
|
|
|
Pandora |
100 |
365 |
DKK |
333,300 |
286,500 |
387,745 |
54,445 |
16 |
141.675 |
266.796 |
|
| 17.12.18 |
24.12.18 |
7 |
|
- cash - |
| |
24.12.18 |
11.03.19 |
77 |
|
|
|
Pandora |
100 |
545 |
DKK |
259,700 |
344,500 |
174,900 |
-84,800 |
-33 |
95.459 |
-85 |
|
| 11.03.19 |
9.03.20 |
364 |
|
- cash - |
| |
9.03.20 |
1.06.20 |
84 |
|
|
|
Equinor |
100 |
844 |
NOK |
113,100 |
141,150 |
85,050 |
-28,050 |
-25 |
71.785 |
-71 |
|
| 1.06.20 |
15.06.20 |
14 |
|
- cash - |
| |
15.06.20 |
6.07.20 |
21 |
|
|
|
Telia Company |
100 |
2.222 |
SEK |
32,300 |
35,160 |
29,440 |
-2,860 |
-9 |
65.430 |
-80 |
|
| 6.07.20 |
13.07.20 |
7 |
|
- cash - |
| |
13.07.20 |
3.08.20 |
21 |
|
|
|
Hennes & Mauritz |
100 |
467 |
SEK |
140,000 |
135,900 |
144,224 |
4,224 |
3 |
67.402 |
68 |
|
| 3.08.20 |
24.01.22 |
539 |
|
- cash - |
| |
24.01.22 |
31.01.22 |
7 |
|
|
|
Vestas Wind Systems |
100 |
387 |
DKK |
174,000 |
176,950 |
171,050 |
-2,950 |
-2 |
66.261 |
-59 |
|
| 31.01.22 |
7.02.22 |
7 |
|
- cash - |
| |
7.02.22 |
8.08.22 |
182 |
|
|
|
Vestas Wind Systems |
100 |
399 |
DKK |
166,000 |
186,040 |
145,960 |
-20,040 |
-12 |
58.265 |
-23 |
|
| 8.08.22 |
22.08.22 |
14 |
|
- cash - |
| |
22.08.22 |
24.10.22 |
63 |
|
|
|
EQT |
100 |
236 |
SEK |
246,000 |
207,900 |
291,082 |
45,082 |
18 |
68.904 |
165 |
|
| 24.10.22 |
17.07.23 |
266 |
|
- cash - |
| |
17.07.23 |
14.08.23 |
28 |
|
|
|
Nokia |
100 |
19.963 |
EUR |
3,452 |
3,552 |
3,352 |
-0,100 |
-3 |
66.908 |
-32 |
|
| 14.08.23 |
23.10.23 |
70 |
|
- cash - |
| |
23.10.23 |
30.10.23 |
7 |
|
|
|
Nokia |
100 |
22.191 |
EUR |
3,015 |
3,079 |
2,951 |
-0,064 |
-2 |
65.487 |
-67 |
|
| 30.10.23 |
8.07.25 |
617 |
|
- cash - |
| kum | 12.06.06 |
30.10.23 | 1659 |
Tage von 7127 investiert (23%) |
555 |
65.487 |
51 |
|
Anteil der Einzelwerte
| Wertpapier | L/S | K-Datum | V-Datum | Tage | K-Kurs | V-Kurs | S-V-Kurs | K-Diff | D % | | | Summe |
| Swedbank | short | 3.09.07 | 10.09.07 | 7 | 210,50 | 205,00 | 216,15 | 5,65 | 2,68 | | | |
| | | 19.05.08 | 16.06.08 | 28 | 146,50 | 128,00 | 167,67 | 21,17 | 14,45 | | | |
| | | 23.06.08 | 9.03.09 | 259 | 113,50 | 23,90 | 539,01 | 425,51 | 374,90 | | | 458,12 |
| Nokia | | 23.05.11 | 30.05.11 | 7 | 5,74 | 4,55 | 7,24 | 1,50 | 26,15 | | | |
| | | 6.06.11 | 27.06.11 | 21 | 4,30 | 4,39 | 4,21 | -0,09 | -2,09 | | | |
| | | 11.07.11 | 2.01.12 | 175 | 3,93 | 4,18 | 3,68 | -0,25 | -6,36 | | | |
| | | 4.06.12 | 11.06.12 | 7 | 2,13 | 1,92 | 2,36 | 0,23 | 10,94 | | | |
| | | 25.06.12 | 2.07.12 | 7 | 1,71 | 1,64 | 1,78 | 0,07 | 4,27 | | | |
| | | 9.07.12 | 16.07.12 | 7 | 1,44 | 1,42 | 1,46 | 0,02 | 1,41 | | | |
| | | 27.08.12 | 3.09.12 | 7 | 2,47 | 1,99 | 3,07 | 0,60 | 24,12 | | | |
| | | 17.07.23 | 14.08.23 | 28 | 3,45 | 3,55 | 3,35 | -0,10 | -2,90 | | | |
| | | 23.10.23 | 30.10.23 | 7 | 3,02 | 3,08 | 2,95 | -0,06 | -2,12 | | | 60,05 |
| EQT | | 22.08.22 | 24.10.22 | 63 | 246,00 | 207,90 | 291,08 | 45,08 | 18,33 | | | 18,33 |
| Ericsson | | 12.11.07 | 3.12.07 | 21 | 91,10 | 79,70 | 104,13 | 13,03 | 14,30 | | | |
| | | 10.12.07 | 12.05.08 | 154 | 80,40 | 81,50 | 79,30 | -1,10 | -1,37 | | | 12,74 |
| Fortum | | 17.08.15 | 9.11.15 | 84 | 15,83 | 13,74 | 18,24 | 2,41 | 15,21 | | | |
| | | 16.11.15 | 23.11.15 | 7 | 13,39 | 14,03 | 12,75 | -0,64 | -4,78 | | | 9,70 |
| S.E.B | | 16.03.09 | 23.03.09 | 7 | 27,80 | 27,00 | 28,62 | 0,82 | 2,96 | | | |
| | | 30.03.09 | 6.04.09 | 7 | 32,40 | 30,70 | 34,19 | 1,79 | 5,54 | | | 8,66 |
| Hennes & Mauritz | | 5.03.18 | 16.04.18 | 42 | 134,02 | 133,20 | 134,85 | 0,82 | 0,62 | | | |
| | | 13.07.20 | 3.08.20 | 21 | 140,00 | 135,90 | 144,22 | 4,22 | 3,02 | | | 3,65 |
| Danske Bank | | 17.09.07 | 24.09.07 | 7 | 186,00 | 190,86 | 181,14 | -4,86 | -2,61 | | | |
| | | 15.10.18 | 5.11.18 | 21 | 139,60 | 135,25 | 144,09 | 4,49 | 3,22 | | | |
| | | 19.11.18 | 3.12.18 | 14 | 135,45 | 133,25 | 137,69 | 2,24 | 1,65 | | | 2,18 |
| Møller-Mærsk B | | 10.07.06 | 25.09.06 | 77 | 86,48 | 97,95 | 75,02 | -11,47 | -13,26 | | | |
| | | 14.12.15 | 25.01.16 | 42 | 91,50 | 82,75 | 101,18 | 9,68 | 10,57 | | | |
| | | 14.03.16 | 30.05.16 | 77 | 90,10 | 85,80 | 94,62 | 4,52 | 5,01 | | | 0,72 |
| Wertpapier | L/S | K-Datum | V-Datum | Tage | K-Kurs | V-Kurs | S-V-Kurs | K-Diff | D % | | | Summe |
| Yara International | | 12.06.06 | 19.06.06 | 7 | 79,50 | 80,50 | 78,50 | -1,00 | -1,26 | | | |
| | | 27.06.16 | 4.07.16 | 7 | 257,10 | 265,80 | 248,40 | -8,70 | -3,38 | | | -4,60 |
| Pandora | | 28.05.18 | 9.07.18 | 42 | 488,00 | 417,00 | 571,09 | 83,09 | 17,03 | | | |
| | | 10.12.18 | 17.12.18 | 7 | 333,30 | 286,50 | 387,74 | 54,44 | 16,34 | | | |
| | | 24.12.18 | 11.03.19 | 77 | 259,70 | 344,50 | 174,90 | -84,80 | -32,65 | | | -8,31 |
| Telia Company | | 15.06.20 | 6.07.20 | 21 | 32,30 | 35,16 | 29,44 | -2,86 | -8,85 | | | -8,85 |
| Vestas Wind Systems | | 24.01.22 | 31.01.22 | 7 | 174,00 | 176,95 | 171,05 | -2,95 | -1,70 | | | |
| | | 7.02.22 | 8.08.22 | 182 | 166,00 | 186,04 | 145,96 | -20,04 | -12,07 | | | -13,56 |
| SKF A | | 1.02.16 | 22.02.16 | 21 | 128,90 | 149,90 | 107,90 | -21,00 | -16,29 | | | -16,29 |
| Equinor | | 9.03.20 | 1.06.20 | 84 | 113,10 | 141,15 | 85,05 | -28,05 | -24,80 | | | -24,80 |
Anmerkungen
| 13.09.23 | Novo Nordisk | | | Aktiensplit 1:2 (zwei für eine) |
| 13.05.22 | Atlas Copco A | | | splittet 1:4 (vier für eine) |
| 19.05.21 | Hexagon | | | Aktiensplit 1:7 (sieben für eine) |
| | Investor | | | Aktiensplit 1: 4 (vier für eine) |
| 3.04.19 | Neste Oil | | | Aktien-Split 1:3 (drei für eine) |
| 19.06.18 | Atlas Copco A | | | Abspaltung Epiroc |
| 16.05.18 | Statoil | | | heißt jetzt Equinor |
| 19.09.16 | Nordic 30 | | | Vestas Wind Systems ersetzt Yara |
| 5.09.15 | Nordic 30 | | | Pandora ersetzt Seadrill (Markt-Anpassung an den Index) |
| 3.06.15 | Assa Abloy | | | ex Split 1:3 (drei für eine) |
| 19.05.15 | Svenska Handelsbank | | | ex Split 1:3 (drei für eine) |
| 22.09.14 | Nordic 30 | | | Coloplast ersetzt Swedish Match. |
|
|