Assessment - nx-25 - Natur-Aktienindex - 7/01/24 - RS = 8
⇐
⇓ freshest
⇓ 7/01/24
⇓ 5/06/24
prc diff
⇓ Curr
∅-RS
L
SOM Price Index
939.812
8/12/24
-0.26
959.174
-2.02
952.347
6.827
0.72
USD
14.97
L
Sprouts
96.180
8/12/24
-0.10
83.570
15.09
75.000
8.570
11.43
USD
61.79
L
First Solar
219.230
8/12/24
3.51
222.710
-1.56
193.810
28.900
14.91
USD
53.49
Deckers Outdoor
918.300
8/12/24
3.15
946.300
-2.96
861.850
84.450
9.80
USD
52.40
L
L'Occitane
3.940
7/29/24
0.72
3.872
1.76
3.806
0.066
1.73
EUR
37.10
L
Eramet
72.350
8/12/24
5.24
97.700
-25.95
94.500
3.200
3.39
EUR
31.07
Interface
16.310
8/12/24
-0.79
14.570
11.94
16.430
-1.860
-11.32
USD
29.79
L
INIT Innov. in Traff
38.000
8/12/24
-3.55
39.700
-4.28
38.500
1.200
3.12
EUR
27.98
Encompass Health
86.860
8/12/24
1.33
85.360
1.76
84.510
0.850
1.01
USD
19.95
L
Kurita Water
5,634.000
8/09/24
-9.14
6,864.000
-17.92
6,277.000
587.000
9.35
JPY
19.82
L
eBay
55.810
8/12/24
-1.26
52.680
5.94
49.380
3.300
6.68
USD
17.79
L
Shimano
27,080.000
8/09/24
-0.48
25,065.000
8.04
25,835.000
-770.000
-2.98
JPY
12.58
L
Geberit
522.800
8/12/24
-0.72
529.200
-1.21
515.200
14.000
2.72
CHF
10.57
MillerKnoll
27.140
8/12/24
-3.49
26.460
2.57
26.810
-0.350
-1.31
USD
8.52
L
Ormat Technologies
71.710
8/12/24
-1.10
69.200
3.63
67.640
1.560
2.31
USD
4.32
Tomra Systems
158.200
8/12/24
0.13
131.600
20.21
139.100
-7.500
-5.39
NOK
4.08
L
LTC Properties
35.900
8/12/24
-0.22
34.440
4.24
33.280
1.160
3.49
USD
3.25
Cdn Nat Railway
152.200
8/12/24
-0.01
161.660
-5.85
172.480
-10.820
-6.27
CAD
2.10
Vestas Wind Systems
152.250
8/12/24
-7.76
162.100
-6.08
181.650
-19.550
-10.76
DKK
-1.36
L
Verbund
76.850
8/12/24
1.52
75.750
1.45
75.100
0.650
0.87
EUR
-1.50
Oatly
0.885
8/12/24
1.57
0.922
-4.01
1.290
-0.368
-28.54
USD
-3.83
S
Severn Trent
2,514.000
8/12/24
-0.63
2,394.000
5.01
2,517.000
-123.000
-4.89
GBP
-5.11
L
Mayr-Melnhof
103.600
8/12/24
1.17
110.800
-6.50
112.200
-1.400
-1.25
EUR
-7.39
Tesla Motors
197.490
8/12/24
-1.26
209.860
-5.89
184.760
25.100
13.59
USD
-12.07
L
Umweltbank
5.640
8/12/24
-1.40
6.380
-11.60
6.560
-0.180
-2.74
EUR
-15.93
⇓ freshest
⇓ 7/01/24
⇓ 5/06/24
prc diff
⇓ Curr
∅-RS
S
Intel
19.360
8/12/24
-1.78
30.840
-37.22
30.970
-0.130
-0.42
USD
-17.91
nx-25 - 25 out of 25 instruments rated - 7/01/24 / 5/06/24 - 14 did rise, Market-Ratio(8) = 56.00 %
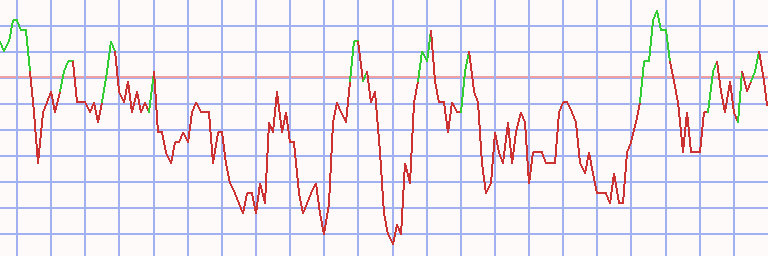
Technical Chart
Transactions nx-25 - Natur-Aktienindex * L8 - 70 ex 1 (1)
⇐ L/S date buy date sell days instrument spl pieces Curr prc buy prc sell prc diff d % asset yield long
1/02/06
1/23/06
21
INIT Innov. in Traff
100
1,459
EUR
6.850
7.390
0.540
8
10,788
274
1/23/06
4/03/06
70
Ormat Technologies
100
306
USD
35.230
38.520
3.290
9
11,795
59
4/03/06 4/10/06 7 - cash -
4/10/06
4/24/06
14
Interface
100
817
USD
14.430
13.920
-0.510
-4
11,378
-61
4/24/06 5/08/06 14 - cash -
5/08/06
5/15/06
7
Deckers Outdoor
100
791
USD
14.370
12.213
-2.157
-15
9,672
-100
5/15/06 8/07/06 84 - cash -
8/07/06
8/28/06
21
Deckers Outdoor
100
662
USD
14.610
13.870
-0.740
-5
9,182
-59
8/28/06 9/04/06 7 - cash -
9/04/06
9/18/06
14
Deckers Outdoor
100
653
USD
14.053
15.580
1.527
11
10,179
1,371
9/18/06 10/02/06 14 - cash -
10/02/06
11/27/06
56
Deckers Outdoor
100
648
USD
15.690
18.017
2.327
15
11,687
146
11/27/06
12/18/06
21
Vestas Wind Systems
100
278
DKK
42.000
47.300
5.300
13
13,160
689
12/18/06 2/05/07 49 - cash -
2/05/07
3/05/07
28
Vestas Wind Systems
100
246
DKK
53.300
51.800
-1.500
-3
12,791
-31
3/05/07
3/12/07
7
Deckers Outdoor
100
567
USD
22.527
23.473
0.947
4
13,328
755
3/12/07 3/19/07 7 - cash -
3/19/07
3/26/07
7
Vestas Wind Systems
100
228
DKK
58.300
61.400
3.100
5
14,035
1,390
3/26/07 4/23/07 28 - cash -
4/23/07
5/21/07
28
Vestas Wind Systems
100
191
DKK
73.100
74.800
1.700
2
14,359
35
5/21/07 5/28/07 7 - cash -
5/28/07
6/04/07
7
Vestas Wind Systems
100
187
DKK
76.600
77.500
0.900
1
14,528
84
6/04/07 10/01/07 119 - cash -
10/01/07
11/12/07
42
Eramet
100
55
EUR
262.000
302.540
40.540
15
16,757
249
11/12/07 4/07/08 147 - cash -
4/07/08
4/14/08
7
First Solar
100
62
USD
268.300
285.790
17.490
7
17,842
2,592
4/14/08 4/28/08 14 - cash -
4/28/08
6/16/08
49
Eramet
100
30
EUR
581.890
591.500
9.610
2
18,130
13
6/16/08 4/13/09 301 - cash -
4/13/09
4/27/09
14
Cdn Nat Railway
100
716
CAD
25.300
24.465
-0.835
-3
17,532
-58
4/27/09
5/04/09
7
First Solar
100
96
USD
180.890
191.050
10.160
6
18,508
1,628
5/04/09
5/11/09
7
Interface
100
2,816
USD
6.570
6.110
-0.460
-7
17,212
-98
5/11/09
5/18/09
7
Ormat Technologies
100
419
USD
41.010
37.380
-3.630
-9
15,691
-99
5/18/09
5/25/09
7
First Solar
100
81
USD
191.720
190.290
-1.430
-1
15,575
-32
5/25/09
6/29/09
35
INIT Innov. in Traff
100
2,052
EUR
7.590
7.950
0.360
5
16,314
62
6/29/09 7/27/09 28 - cash -
7/27/09
8/10/09
14
eBay
100
1,780
USD
9.163
9.466
0.303
3
16,853
134
8/10/09 8/17/09 7 - cash -
8/17/09
8/24/09
7
INIT Innov. in Traff
100
1,893
EUR
8.900
8.850
-0.050
-1
16,759
-25
8/24/09
8/31/09
7
Encompass Health
100
1,032
USD
16.230
15.610
-0.620
-4
16,119
-87
L/S date buy date sell days instrument spl pieces Curr prc buy prc sell prc diff d % asset yield
8/31/09
9/14/09
14
eBay
100
1,729
USD
9.318
10.025
0.707
8
17,342
573
9/14/09
9/21/09
7
Interface
100
2,349
USD
7.380
7.340
-0.040
-1
17,248
-25
9/21/09 9/28/09 7 - cash -
9/28/09
10/05/09
7
Interface
100
1,962
USD
8.790
8.250
-0.540
-6
16,188
-96
10/05/09 10/12/09 7 - cash -
10/12/09
10/19/09
7
Interface
100
1,877
USD
8.620
8.290
-0.330
-4
15,569
-87
10/19/09 12/28/09 70 - cash -
12/28/09
1/18/10
21
Interface
100
1,844
USD
8.440
8.680
0.240
3
16,011
63
1/18/10 3/22/10 63 - cash -
3/22/10
4/19/10
28
Deckers Outdoor
100
348
USD
45.903
44.333
-1.570
-3
15,465
-36
4/19/10
4/26/10
7
Interface
100
1,285
USD
12.030
12.490
0.460
4
16,056
608
4/26/10
5/03/10
7
Deckers Outdoor
100
316
USD
50.727
47.933
-2.793
-6
15,173
-95
5/03/10
5/10/10
7
Interface
100
1,110
USD
13.660
13.280
-0.380
-3
14,751
-77
5/10/10 7/26/10 77 - cash -
7/26/10
8/09/10
14
Deckers Outdoor
100
287
USD
51.330
49.850
-1.480
-3
14,327
-53
8/09/10 10/11/10 63 - cash -
10/11/10
11/01/10
21
Interface
100
986
USD
14.520
14.360
-0.160
-1
14,169
-18
11/01/10 11/08/10 7 - cash -
11/08/10
11/15/10
7
Deckers Outdoor
100
226
USD
62.650
60.920
-1.730
-3
13,778
-77
11/15/10 11/22/10 7 - cash -
11/22/10
11/29/10
7
Deckers Outdoor
100
201
USD
68.220
73.030
4.810
7
14,745
3,390
11/29/10 12/27/10 28 - cash -
12/27/10
1/03/11
7
Deckers Outdoor
100
173
USD
84.960
81.230
-3.730
-4
14,099
-90
1/03/11 2/07/11 35 - cash -
2/07/11
2/14/11
7
Deckers Outdoor
100
170
USD
82.840
86.470
3.630
4
14,717
836
2/14/11 5/09/11 84 - cash -
5/09/11
5/23/11
14
Deckers Outdoor
100
164
USD
89.320
87.400
-1.920
-2
14,402
-43
5/23/11 11/07/11 168 - cash -
11/07/11
11/14/11
7
Deckers Outdoor
100
127
USD
112.790
107.790
-5.000
-4
13,767
-91
11/14/11 1/30/12 77 - cash -
1/30/12
2/20/12
21
Intel
100
514
USD
26.740
27.160
0.420
2
13,983
31
2/20/12
3/26/12
35
Tesla Motors
100
6,079
USD
2.300
2.493
0.193
8
15,158
132
3/26/12 9/17/12 175 - cash -
9/17/12
9/24/12
7
eBay
100
713
USD
21.246
20.754
-0.492
-2
14,807
-71
9/24/12 12/17/12 84 - cash -
12/17/12
1/28/13
42
First Solar
100
462
USD
32.030
28.330
-3.700
-12
13,097
-66
1/28/13
2/04/13
7
eBay
100
556
USD
23.548
23.439
-0.109
0
13,036
-22
2/04/13
2/25/13
21
First Solar
100
418
USD
31.130
25.350
-5.780
-19
10,620
-97
2/25/13
3/04/13
7
Umweltbank
100
1,401
EUR
7.579
7.420
-0.159
-2
10,398
-67
3/04/13
3/11/13
7
Interface
100
570
USD
18.220
18.390
0.170
1
10,494
62
L/S date buy date sell days instrument spl pieces Curr prc buy prc sell prc diff d % asset yield
3/11/13 4/01/13 21 - cash -
4/01/13
4/08/13
7
Shimano
100
138
JPY
75.790
79.870
4.080
5
11,057
1,440
4/08/13
4/15/13
7
First Solar
100
297
USD
37.110
38.100
0.990
3
11,352
295
4/15/13 5/13/13 28 - cash -
5/13/13
5/20/13
7
Tesla Motors
100
1,939
USD
5.853
5.996
0.143
2
11,628
251
5/20/13 8/19/13 91 - cash -
8/19/13
8/26/13
7
Tesla Motors
100
1,203
USD
9.660
10.948
1.288
13
13,178
68,191
8/26/13 9/23/13 28 - cash -
9/23/13
10/07/13
14
Tesla Motors
100
1,091
USD
12.074
12.205
0.131
1
13,320
32
10/07/13 10/14/13 7 - cash -
10/14/13
11/11/13
28
Tesla Motors
100
1,111
USD
11.981
9.647
-2.335
-19
10,726
-94
11/11/13 3/24/14 133 - cash -
3/24/14
3/31/14
7
Tesla Motors
100
730
USD
14.678
13.897
-0.781
-5
10,156
-94
3/31/14
4/14/14
14
Vestas Wind Systems
100
233
DKK
43.560
43.660
0.100
0
10,179
6
4/14/14 6/23/14 70 - cash -
6/23/14
6/30/14
7
Vestas Wind Systems
100
182
DKK
55.800
54.940
-0.860
-2
10,023
-56
6/30/14 9/08/14 70 - cash -
9/08/14
9/15/14
7
Tesla Motors
100
532
USD
18.807
16.924
-1.883
-10
9,021
-100
9/15/14 12/01/14 77 - cash -
12/01/14
1/05/15
35
Shimano
100
54
JPY
166.730
156.600
-10.130
-6
8,474
-48
1/05/15 1/12/15 7 - cash -
1/12/15
1/19/15
7
Shimano
100
54
JPY
156.210
153.450
-2.760
-2
8,325
-61
1/19/15 2/09/15 21 - cash -
2/09/15
3/23/15
42
Shimano
100
53
JPY
156.940
191.210
34.270
22
10,141
456
3/23/15 4/06/15 14 - cash -
4/06/15
4/13/15
7
Shimano
100
55
JPY
181.800
178.730
-3.070
-2
9,972
-59
4/13/15
4/20/15
7
L'Occitane
100
3,677
EUR
2.712
2.556
-0.156
-6
9,399
-95
4/20/15 10/19/15 182 - cash -
10/19/15
11/02/15
14
Vestas Wind Systems
100
125
DKK
75.180
80.400
5.220
7
10,051
476
11/02/15 11/09/15 7 - cash -
11/09/15
11/16/15
7
Vestas Wind Systems
100
119
DKK
83.940
85.440
1.500
2
10,230
152
11/16/15 3/14/16 119 - cash -
3/14/16
3/28/16
14
First Solar
100
144
USD
70.890
68.400
-2.490
-4
9,871
-61
3/28/16 4/04/16 7 - cash -
4/04/16
4/11/16
7
First Solar
100
146
USD
67.240
59.960
-7.280
-11
8,808
-100
4/11/16
4/25/16
14
Vestas Wind Systems
100
96
DKK
91.160
86.000
-5.160
-6
8,313
-78
4/25/16
5/02/16
7
Ormat Technologies
100
193
USD
43.000
43.750
0.750
2
8,458
146
5/02/16 7/11/16 70 - cash -
7/11/16
7/18/16
7
LTC Properties
100
159
USD
53.040
52.280
-0.760
-1
8,337
-53
7/18/16
7/25/16
7
Eramet
100
234
EUR
35.600
34.710
-0.890
-3
8,128
-73
7/25/16 8/08/16 14 - cash -
8/08/16
8/15/16
7
Ormat Technologies
100
169
USD
48.080
47.900
-0.180
0
8,098
-18
8/15/16
8/22/16
7
Deckers Outdoor
100
118
USD
68.550
67.840
-0.710
-1
8,014
-42
L/S date buy date sell days instrument spl pieces Curr prc buy prc sell prc diff d % asset yield
8/22/16
9/12/16
21
Vestas Wind Systems
100
70
DKK
113.000
109.900
-3.100
-3
7,797
-38
9/12/16 1/16/17 126 - cash -
1/16/17
1/23/17
7
Eramet
100
134
EUR
58.180
54.000
-4.180
-7
7,237
-98
1/23/17 1/30/17 7 - cash -
1/30/17
2/06/17
7
Eramet
100
135
EUR
53.520
54.850
1.330
2
7,417
260
2/06/17 2/27/17 21 - cash -
2/27/17
3/06/17
7
Eramet
100
145
EUR
50.980
50.980
0.000
0
7,417
0
3/06/17 4/03/17 28 - cash -
4/03/17
7/10/17
98
Tesla Motors
100
372
USD
19.901
21.070
1.169
6
7,851
24
7/10/17 7/17/17 7 - cash -
7/17/17
7/24/17
7
Tesla Motors
100
368
USD
21.305
22.835
1.530
7
8,414
3,620
7/24/17 10/16/17 84 - cash -
10/16/17
10/30/17
14
Eramet
100
122
EUR
68.500
73.450
4.950
7
9,018
517
10/30/17 1/08/18 70 - cash -
1/08/18
2/05/18
28
Eramet
100
86
EUR
103.800
110.000
6.200
6
9,552
113
2/05/18 2/04/19 364 - cash -
2/04/19
2/25/19
21
Verbund
100
214
EUR
44.600
40.920
-3.680
-8
8,764
-78
2/25/19
3/04/19
7
Deckers Outdoor
100
59
USD
147.960
144.970
-2.990
-2
8,588
-66
3/04/19
3/25/19
21
Verbund
100
202
EUR
42.480
43.300
0.820
2
8,753
39
3/25/19 7/08/19 105 - cash -
7/08/19
7/22/19
14
Deckers Outdoor
100
49
USD
177.920
175.540
-2.380
-1
8,637
-30
7/22/19 7/29/19 7 - cash -
7/29/19
8/05/19
7
First Solar
100
130
USD
66.050
62.010
-4.040
-6
8,111
-96
8/05/19 10/14/19 70 - cash -
10/14/19
11/18/19
35
INIT Innov. in Traff
100
386
EUR
21.000
20.500
-0.500
-2
7,918
-22
11/18/19
11/25/19
7
Tesla Motors
100
339
USD
23.333
22.423
-0.910
-4
7,610
-87
11/25/19
12/16/19
21
INIT Innov. in Traff
100
355
EUR
21.400
23.300
1.900
9
8,284
339
12/16/19
12/30/19
14
Tesla Motors
100
325
USD
25.433
27.647
2.213
9
9,004
781
12/30/19 5/11/20 133 - cash -
5/11/20
7/06/20
56
Tesla Motors
100
166
USD
54.086
91.439
37.353
69
15,204
2,965
7/06/20 7/20/20 14 - cash -
7/20/20
7/27/20
7
Tesla Motors
100
138
USD
109.533
102.640
-6.893
-6
14,253
-97
7/27/20 8/10/20 14 - cash -
8/10/20
8/17/20
7
Tesla Motors
100
150
USD
94.571
122.376
27.805
29
18,424
> 999,999
8/17/20 10/19/20 63 - cash -
10/19/20
10/26/20
7
Tesla Motors
100
128
USD
143.610
140.093
-3.517
-2
17,974
-73
10/26/20 11/16/20 21 - cash -
11/16/20
11/23/20
7
Tesla Motors
100
132
USD
136.030
173.950
37.920
28
22,979
> 999,999
11/23/20 11/30/20 7 - cash -
11/30/20
12/07/20
7
Tesla Motors
100
121
USD
189.200
213.920
24.720
13
25,970
60,266
12/07/20 12/14/20 7 - cash -
12/14/20
3/01/21
77
Tesla Motors
100
121
USD
213.277
217.733
4.456
2
26,509
10
3/01/21 4/19/21 49 - cash -
4/19/21
5/10/21
21
Tesla Motors
100
111
USD
238.210
209.680
-28.530
-12
23,343
-89
L/S date buy date sell days instrument spl pieces Curr prc buy prc sell prc diff d % asset yield
5/10/21 6/28/21 49 - cash -
6/28/21
7/05/21
7
Interface
100
1,540
USD
15.150
15.520
0.370
2
23,912
252
7/05/21
7/19/21
14
L'Occitane
100
7,463
EUR
3.204
3.180
-0.024
-1
23,733
-18
7/19/21 9/13/21 56 - cash -
9/13/21
9/20/21
7
Eramet
100
346
EUR
68.400
64.050
-4.350
-6
22,228
-97
9/20/21 8/08/22 322 - cash -
8/08/22
8/22/22
14
First Solar
100
208
USD
106.740
114.480
7.740
7
23,838
520
8/22/22 11/28/22 98 - cash -
11/28/22
12/19/22
21
First Solar
100
143
USD
165.620
156.770
-8.850
-5
22,573
-61
12/19/22 2/13/23 56 - cash -
2/13/23
2/27/23
14
First Solar
100
134
USD
167.260
166.110
-1.150
-1
22,418
-16
2/27/23 12/04/23 280 - cash -
12/04/23
12/25/23
21
Deckers Outdoor
100
32
USD
693.810
693.690
-0.120
0
22,415
0
12/25/23
1/22/24
28
Intel
100
466
USD
48.000
48.220
0.220
0
22,517
6
1/22/24 3/25/24 63 - cash -
3/25/24
4/08/24
14
Interface
100
1,308
USD
17.210
16.600
-0.610
-4
21,719
-61
4/08/24 5/13/24 35 - cash -
5/13/24
5/20/24
7
Sprouts
100
285
USD
76.090
79.190
3.100
4
22,603
702
5/20/24 6/03/24 14 - cash -
6/03/24
6/10/24
7
Sprouts
100
286
USD
78.850
76.130
-2.720
-3
21,825
-84
6/10/24
6/17/24
7
First Solar
100
78
USD
279.800
261.330
-18.470
-7
20,384
-97
6/17/24 7/01/25 379 - cash -
accum 1/02/06
6/17/24 1820
days out of 7120 invested (26%)
104
20,384
15
Instrument Related Contribution
instrument L/S date buy date sell days prc buy prc sell prc diff d % total Tesla Motors long 2/20/12 3/26/12 35 2.30 2.49 0.19 8.40 5/13/13 5/20/13 7 5.85 6.00 0.14 2.44 8/19/13 8/26/13 7 9.66 10.95 1.29 13.33 9/23/13 10/07/13 14 12.07 12.20 0.13 1.08 10/14/13 11/11/13 28 11.98 9.65 -2.33 -19.49 3/24/14 3/31/14 7 14.68 13.90 -0.78 -5.32 9/08/14 9/15/14 7 18.81 16.92 -1.88 -10.01 4/03/17 7/10/17 98 19.90 21.07 1.17 5.87 7/17/17 7/24/17 7 21.30 22.83 1.53 7.18 11/18/19 11/25/19 7 23.33 22.42 -0.91 -3.90 12/16/19 12/30/19 14 25.43 27.65 2.21 8.70 5/11/20 7/06/20 56 54.09 91.44 37.35 69.06 7/20/20 7/27/20 7 109.53 102.64 -6.89 -6.29 8/10/20 8/17/20 7 94.57 122.38 27.80 29.40 10/19/20 10/26/20 7 143.61 140.09 -3.52 -2.45 11/16/20 11/23/20 7 136.03 173.95 37.92 27.88 11/30/20 12/07/20 7 189.20 213.92 24.72 13.07 12/14/20 3/01/21 77 213.28 217.73 4.46 2.09 4/19/21 5/10/21 21 238.21 209.68 -28.53 -11.98 168.77 INIT Innov. in Traff 1/02/06 1/23/06 21 6.85 7.39 0.54 7.88 5/25/09 6/29/09 35 7.59 7.95 0.36 4.74 8/17/09 8/24/09 7 8.90 8.85 -0.05 -0.56 10/14/19 11/18/19 35 21.00 20.50 -0.50 -2.38 11/25/19 12/16/19 21 21.40 23.30 1.90 8.88 19.43 Vestas Wind Systems 11/27/06 12/18/06 21 42.00 47.30 5.30 12.62 2/05/07 3/05/07 28 53.30 51.80 -1.50 -2.81 3/19/07 3/26/07 7 58.30 61.40 3.10 5.32 4/23/07 5/21/07 28 73.10 74.80 1.70 2.33 5/28/07 6/04/07 7 76.60 77.50 0.90 1.17 3/31/14 4/14/14 14 43.56 43.66 0.10 0.23 6/23/14 6/30/14 7 55.80 54.94 -0.86 -1.54 10/19/15 11/02/15 14 75.18 80.40 5.22 6.94 11/09/15 11/16/15 7 83.94 85.44 1.50 1.79 4/11/16 4/25/16 14 91.16 86.00 -5.16 -5.66 8/22/16 9/12/16 21 113.00 109.90 -3.10 -2.74 17.62 instrument L/S date buy date sell days prc buy prc sell prc diff d % total Shimano 4/01/13 4/08/13 7 75.79 79.87 4.08 5.38 12/01/14 1/05/15 35 166.73 156.60 -10.13 -6.08 1/12/15 1/19/15 7 156.21 153.45 -2.76 -1.77 2/09/15 3/23/15 42 156.94 191.21 34.27 21.84 4/06/15 4/13/15 7 181.80 178.73 -3.07 -1.69 16.46 Eramet 10/01/07 11/12/07 42 262.00 302.54 40.54 15.47 4/28/08 6/16/08 49 581.89 591.50 9.61 1.65 7/18/16 7/25/16 7 35.60 34.71 -0.89 -2.50 1/16/17 1/23/17 7 58.18 54.00 -4.18 -7.18 1/30/17 2/06/17 7 53.52 54.85 1.33 2.49 2/27/17 3/06/17 7 50.98 50.98 0.00 0.00 10/16/17 10/30/17 14 68.50 73.45 4.95 7.23 1/08/18 2/05/18 28 103.80 110.00 6.20 5.97 9/13/21 9/20/21 7 68.40 64.05 -4.35 -6.36 15.84 eBay 7/27/09 8/10/09 14 9.16 9.47 0.30 3.31 8/31/09 9/14/09 14 9.32 10.03 0.71 7.59 9/17/12 9/24/12 7 21.25 20.75 -0.49 -2.32 1/28/13 2/04/13 7 23.55 23.44 -0.11 -0.46 8.07 Intel 1/30/12 2/20/12 21 26.74 27.16 0.42 1.57 12/25/23 1/22/24 28 48.00 48.22 0.22 0.46 2.04 Ormat Technologies 1/23/06 4/03/06 70 35.23 38.52 3.29 9.34 5/11/09 5/18/09 7 41.01 37.38 -3.63 -8.85 4/25/16 5/02/16 7 43.00 43.75 0.75 1.74 8/08/16 8/15/16 7 48.08 47.90 -0.18 -0.37 1.02 Sprouts 5/13/24 5/20/24 7 76.09 79.19 3.10 4.07 6/03/24 6/10/24 7 78.85 76.13 -2.72 -3.45 0.48 instrument L/S date buy date sell days prc buy prc sell prc diff d % total LTC Properties 7/11/16 7/18/16 7 53.04 52.28 -0.76 -1.43 -1.43 Umweltbank 2/25/13 3/04/13 7 7.58 7.42 -0.16 -2.10 -2.10 Cdn Nat Railway 4/13/09 4/27/09 14 25.30 24.47 -0.84 -3.30 -3.30 Encompass Health 8/24/09 8/31/09 7 16.23 15.61 -0.62 -3.82 -3.82 L'Occitane 4/13/15 4/20/15 7 2.71 2.56 -0.16 -5.75 7/05/21 7/19/21 14 3.20 3.18 -0.02 -0.75 -6.46 Verbund 2/04/19 2/25/19 21 44.60 40.92 -3.68 -8.25 3/04/19 3/25/19 21 42.48 43.30 0.82 1.93 -6.48 Deckers Outdoor 5/08/06 5/15/06 7 14.37 12.21 -2.16 -15.01 8/07/06 8/28/06 21 14.61 13.87 -0.74 -5.07 9/04/06 9/18/06 14 14.05 15.58 1.53 10.86 10/02/06 11/27/06 56 15.69 18.02 2.33 14.83 3/05/07 3/12/07 7 22.53 23.47 0.95 4.20 3/22/10 4/19/10 28 45.90 44.33 -1.57 -3.42 4/26/10 5/03/10 7 50.73 47.93 -2.79 -5.51 7/26/10 8/09/10 14 51.33 49.85 -1.48 -2.88 11/08/10 11/15/10 7 62.65 60.92 -1.73 -2.76 11/22/10 11/29/10 7 68.22 73.03 4.81 7.05 12/27/10 1/03/11 7 84.96 81.23 -3.73 -4.39 2/07/11 2/14/11 7 82.84 86.47 3.63 4.38 5/09/11 5/23/11 14 89.32 87.40 -1.92 -2.15 11/07/11 11/14/11 7 112.79 107.79 -5.00 -4.43 8/15/16 8/22/16 7 68.55 67.84 -0.71 -1.04 2/25/19 3/04/19 7 147.96 144.97 -2.99 -2.02 7/08/19 7/22/19 14 177.92 175.54 -2.38 -1.34 12/04/23 12/25/23 21 693.81 693.69 -0.12 -0.02 -11.85 instrument L/S date buy date sell days prc buy prc sell prc diff d % total Interface 4/10/06 4/24/06 14 14.43 13.92 -0.51 -3.53 5/04/09 5/11/09 7 6.57 6.11 -0.46 -7.00 9/14/09 9/21/09 7 7.38 7.34 -0.04 -0.54 9/28/09 10/05/09 7 8.79 8.25 -0.54 -6.14 10/12/09 10/19/09 7 8.62 8.29 -0.33 -3.83 12/28/09 1/18/10 21 8.44 8.68 0.24 2.84 4/19/10 4/26/10 7 12.03 12.49 0.46 3.82 5/03/10 5/10/10 7 13.66 13.28 -0.38 -2.78 10/11/10 11/01/10 21 14.52 14.36 -0.16 -1.10 3/04/13 3/11/13 7 18.22 18.39 0.17 0.93 6/28/21 7/05/21 7 15.15 15.52 0.37 2.44 3/25/24 4/08/24 14 17.21 16.60 -0.61 -3.54 -17.54 First Solar 4/07/08 4/14/08 7 268.30 285.79 17.49 6.52 4/27/09 5/04/09 7 180.89 191.05 10.16 5.62 5/18/09 5/25/09 7 191.72 190.29 -1.43 -0.75 12/17/12 1/28/13 42 32.03 28.33 -3.70 -11.55 2/04/13 2/25/13 21 31.13 25.35 -5.78 -18.57 4/08/13 4/15/13 7 37.11 38.10 0.99 2.67 3/14/16 3/28/16 14 70.89 68.40 -2.49 -3.51 4/04/16 4/11/16 7 67.24 59.96 -7.28 -10.83 7/29/19 8/05/19 7 66.05 62.01 -4.04 -6.12 8/08/22 8/22/22 14 106.74 114.48 7.74 7.25 11/28/22 12/19/22 21 165.62 156.77 -8.85 -5.34 2/13/23 2/27/23 14 167.26 166.11 -1.15 -0.69 6/10/24 6/17/24 7 279.80 261.33 -18.47 -6.60 -37.19
Annotations
8/05/24 nx-25 Visa replaces L'Occitane 9/18/23 nx-25 Eramet replaces Boiron 8/25/22 Tesla Motors stock split 1:3 (three for one) 8/18/22 nx-25 Oatly Group replaces Beyond Meat 5/27/22 Tomra Systems stock split 1:2 (two for one) 5/31/21 nx-25 Canadian National Railway replaces Kansas City Southern due to upcoming merger 6/06/20 nx-25 Deckers Outdoor Corporation replaces Geox 2/07/20 nx-25 Beyond Meat replaces SunOpta 1/02/18 HealthSouth renames herself Encompass Health Corporation and gets new IDs and ticker 9/18/17 Umweltbank stock split 1:5 (five for one) 7/26/17 nx-25 LTC Properties and Sprouts Farmers Market replace EnerNOC (->Enel) and Whole Foods (-> Amazon) 6/01/17 nx-25 Intel replaces Ricoh due to national weight shifts in MSCI World 2/17/16 SOM Price Index The nx-25 index is published by Öko-Invest Verlag, Vienna. 1/25/16 nx-25 complete analysis nx-25 HealthSouth replaces Keurig Green Mountain (2015-12-31) HealthSouth recording started 8/17/15 nx-25 complete analysis nx-25 Gaiam replaced by eBay 7/20/15 eBay spin-off of PayPal ratio 2790 : 3839 3/14/15 nx-25 first complete analysis
write an annotation