| | |
| | |

Assessment - Noble Metals - 7/01/24 - RS = 48
⇐
| |
|
⇓instrument |
freshest |
⇓ Δday |
7/01/24 |
⇓ Δwk |
7/31/23 |
prc diff |
⇓ Δ48 |
Curr |
∅-RS |
| |  |
 |
 |
|
|
 |
SOM Noble Metals |
635.030 |
8/12/24 |
2.84 |
606.787 |
4.65 |
522.402 |
84.385 |
16.15 |
USD |
11.80 |
| | |
|
|
|
L |
|
Kinross Gold |
12.250 |
8/12/24 |
5.15 |
11.390 |
7.55 |
6.570 |
4.820 |
73.36 |
CAD |
36.35 |
| | |
|
|
|
|
|
Eldorado Gold |
23.270 |
8/12/24 |
4.82 |
20.210 |
15.14 |
12.930 |
7.280 |
56.30 |
CAD |
28.71 |
| | |
|
|
|
|
|
Zijin Mining |
15.360 |
8/12/24 |
0.13 |
18.040 |
-14.86 |
13.010 |
5.030 |
38.66 |
CNY |
28.15 |
| | |
|
|
|
|
|
Agnico-Eagle Mines |
105.450 |
8/12/24 |
3.52 |
89.480 |
17.85 |
69.130 |
20.350 |
29.44 |
CAD |
24.41 |
| | |
|
|
|
L |
|
Wheaton Precious |
78.610 |
8/12/24 |
2.56 |
71.730 |
9.59 |
59.130 |
12.600 |
21.31 |
CAD |
16.24 |
| | |
|
|
|
|
|
Northern Star |
14.060 |
8/12/24 |
0.64 |
12.900 |
8.99 |
11.510 |
1.390 |
12.08 |
AUD |
5.57 |
| | |
|
|
|
|
|
Peñoles |
241.670 |
8/12/24 |
-0.26 |
238.510 |
1.32 |
239.430 |
-0.920 |
-0.38 |
MXN |
2.13 |
| | |
|
|
|
|
|
Barrick Gold |
26.150 |
8/12/24 |
9.37 |
22.820 |
14.59 |
22.780 |
0.040 |
0.18 |
CAD |
0.22 |
| | |
|
|
|
|
|
Endeavour Mining |
1,567.000 |
8/12/24 |
1.89 |
1,722.000 |
-9.00 |
1,880.000 |
-158.000 |
-8.40 |
GBP |
-0.44 |
| | |
|
|
|
|
|
Fresnillo |
540.000 |
8/12/24 |
0.93 |
562.500 |
-4.00 |
618.200 |
-55.700 |
-9.01 |
GBP |
-1.21 |
| | |
|
|
|
|
|
Franco-Nevada |
170.330 |
8/12/24 |
2.47 |
162.200 |
5.01 |
192.420 |
-30.220 |
-15.71 |
CAD |
-4.55 |
| Noble Metals - 11 out of 11 instruments rated - 7/01/24 / 7/31/23 - 7 did rise, Market-Ratio(48) = 63.64 % |
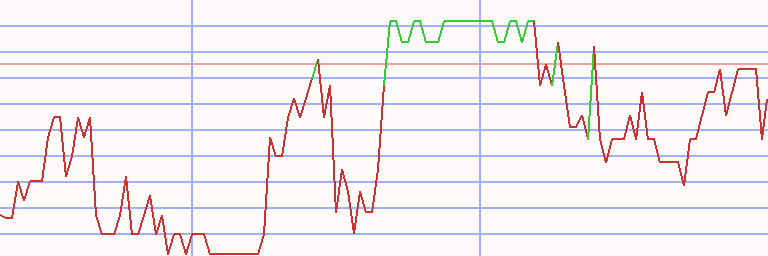
Technical Chart
Transactions Noble Metals * L48 - 75 ex 6 (1)
|
⇐ |
| |
| L/S | date buy | date sell | days | | instrument | spl | pieces | Curr | prc buy | prc sell | | prc diff | d % | asset | yield | | | long |
1/02/06 |
10/23/06 |
294 |
|
|
|
Eldorado Gold |
100 |
318 |
CAD |
31.400 |
23.550 |
|
-7.850 |
-25 |
7,504 |
-30 |
|
| 10/23/06 |
10/30/06 |
7 |
|
- cash - |
| |
10/30/06 |
12/11/06 |
42 |
|
|
|
Agnico-Eagle Mines |
100 |
175 |
CAD |
42.710 |
46.760 |
|
4.050 |
9 |
8,212 |
120 |
|
| 12/11/06 |
12/18/06 |
7 |
|
- cash - |
| |
12/18/06 |
3/05/07 |
77 |
|
|
|
Agnico-Eagle Mines |
100 |
179 |
CAD |
45.870 |
42.960 |
|
-2.910 |
-6 |
7,692 |
-27 |
|
| 3/05/07 |
4/30/07 |
56 |
|
- cash - |
| |
4/30/07 |
5/21/07 |
21 |
|
|
|
Eldorado Gold |
100 |
225 |
CAD |
34.050 |
30.350 |
|
-3.700 |
-11 |
6,859 |
-86 |
|
| 5/21/07 |
6/04/07 |
14 |
|
- cash - |
| |
6/04/07 |
6/25/07 |
21 |
|
|
|
Northern Star |
100 |
54,350 |
AUD |
0.126 |
0.103 |
|
-0.024 |
-19 |
5,571 |
-97 |
|
| 6/25/07 |
7/16/07 |
21 |
|
- cash - |
| |
7/16/07 |
7/23/07 |
7 |
|
|
|
Wheaton Precious |
100 |
363 |
CAD |
15.310 |
14.180 |
|
-1.130 |
-7 |
5,161 |
-98 |
|
| 7/23/07 |
9/03/07 |
42 |
|
- cash - |
| |
9/03/07 |
11/19/07 |
77 |
|
|
|
Agnico-Eagle Mines |
100 |
100 |
CAD |
51.580 |
50.680 |
|
-0.900 |
-2 |
5,071 |
-8 |
|
| 11/19/07 |
12/10/07 |
21 |
|
- cash - |
| |
12/10/07 |
12/24/07 |
14 |
|
|
|
Kinross Gold |
100 |
292 |
CAD |
17.350 |
18.300 |
|
0.950 |
5 |
5,348 |
301 |
|
| 12/24/07 |
1/07/08 |
14 |
|
- cash - |
| |
1/07/08 |
1/14/08 |
7 |
|
|
|
Kinross Gold |
100 |
229 |
CAD |
23.260 |
20.760 |
|
-2.500 |
-11 |
4,776 |
-100 |
|
| 1/14/08 |
2/25/08 |
42 |
|
- cash - |
| |
2/25/08 |
3/17/08 |
21 |
|
|
|
Kinross Gold |
100 |
197 |
CAD |
24.130 |
22.210 |
|
-1.920 |
-8 |
4,397 |
-76 |
|
| 3/17/08 |
3/24/08 |
7 |
|
- cash - |
| |
3/24/08 |
6/09/08 |
77 |
|
|
|
Agnico-Eagle Mines |
100 |
62 |
CAD |
70.430 |
64.850 |
|
-5.580 |
-8 |
4,051 |
-32 |
|
| 6/09/08 |
6/23/08 |
14 |
|
- cash - |
| |
6/23/08 |
8/04/08 |
42 |
|
|
|
Eldorado Gold |
100 |
93 |
CAD |
43.400 |
38.600 |
|
-4.800 |
-11 |
3,605 |
-64 |
|
| 8/04/08 |
7/13/09 |
343 |
|
- cash - |
| |
7/13/09 |
12/14/09 |
154 |
|
|
|
Zijin Mining |
100 |
514 |
CNY |
7.010 |
6.970 |
|
-0.040 |
-1 |
3,585 |
-1 |
|
| 12/14/09 |
3/08/10 |
84 |
|
- cash - |
| |
3/08/10 |
3/22/10 |
14 |
|
|
|
Fresnillo |
100 |
422 |
GBP |
8.480 |
8.300 |
|
-0.180 |
-2 |
3,509 |
-43 |
|
| 3/22/10 |
3/29/10 |
7 |
|
- cash - |
| |
3/29/10 |
4/19/10 |
21 |
|
|
|
Wheaton Precious |
100 |
214 |
CAD |
16.320 |
18.000 |
|
1.680 |
10 |
3,868 |
449 |
|
| 4/19/10 |
5/17/10 |
28 |
|
- cash - |
| |
5/17/10 |
5/24/10 |
7 |
|
|
|
Northern Star |
100 |
61,398 |
AUD |
0.063 |
0.078 |
|
0.015 |
24 |
4,789 |
> 999,999 |
|
| 5/24/10 |
5/31/10 |
7 |
|
- cash - |
| |
5/31/10 |
7/05/10 |
35 |
|
|
|
Northern Star |
100 |
79,817 |
AUD |
0.060 |
0.049 |
|
-0.011 |
-18 |
3,911 |
-88 |
|
| 7/05/10 |
8/30/10 |
56 |
|
- cash - |
| |
8/30/10 |
9/06/10 |
7 |
|
|
|
Northern Star |
100 |
42,054 |
AUD |
0.093 |
0.100 |
|
0.007 |
8 |
4,205 |
4,299 |
|
| 9/06/10 |
9/27/10 |
21 |
|
- cash - |
| |
9/27/10 |
10/18/10 |
21 |
|
|
|
Northern Star |
100 |
22,133 |
AUD |
0.190 |
0.220 |
|
0.030 |
16 |
4,869 |
1,178 |
|
| 10/18/10 |
10/25/10 |
7 |
|
- cash - |
| |
10/25/10 |
3/28/11 |
154 |
|
|
|
Northern Star |
100 |
23,753 |
AUD |
0.205 |
0.340 |
|
0.135 |
66 |
8,076 |
232 |
|
| 3/28/11 |
4/25/11 |
28 |
|
- cash - |
| |
4/25/11 |
5/02/11 |
7 |
|
|
|
Northern Star |
100 |
19,697 |
AUD |
0.410 |
0.395 |
|
-0.015 |
-4 |
7,781 |
-86 |
|
| 5/02/11 |
6/27/11 |
56 |
|
- cash - |
| |
6/27/11 |
7/25/11 |
28 |
|
|
|
Northern Star |
100 |
19,211 |
AUD |
0.405 |
0.495 |
|
0.090 |
22 |
9,510 |
1,268 |
|
| 7/25/11 |
8/22/11 |
28 |
|
- cash - |
| |
8/22/11 |
9/12/11 |
21 |
|
|
|
Northern Star |
100 |
17,290 |
AUD |
0.550 |
0.595 |
|
0.045 |
8 |
10,288 |
292 |
|
| 9/12/11 |
5/02/16 |
1694 |
|
- cash - |
| |
5/02/16 |
12/19/16 |
231 |
|
|
|
Kinross Gold |
100 |
1,455 |
CAD |
7.070 |
4.040 |
|
-3.030 |
-43 |
5,879 |
-59 |
|
| |
12/19/16 |
3/13/17 |
84 |
|
|
|
Peñoles |
100 |
15 |
MXN |
389.310 |
442.670 |
|
53.360 |
14 |
6,679 |
75 |
|
| L/S | date buy | date sell | days | | instrument | spl | pieces | Curr | prc buy | prc sell | | prc diff | d % | asset | yield | |
| 3/13/17 |
3/27/17 |
14 |
|
- cash - |
| |
3/27/17 |
4/03/17 |
7 |
|
|
|
Peñoles |
100 |
13 |
MXN |
492.310 |
479.990 |
|
-12.320 |
-3 |
6,519 |
-73 |
|
| 4/03/17 |
4/10/17 |
7 |
|
- cash - |
| |
4/10/17 |
5/08/17 |
28 |
|
|
|
Peñoles |
100 |
13 |
MXN |
471.930 |
405.010 |
|
-66.920 |
-14 |
5,649 |
-86 |
|
| 5/08/17 |
11/20/17 |
196 |
|
- cash - |
| |
11/20/17 |
12/04/17 |
14 |
|
|
|
Northern Star |
100 |
982 |
AUD |
5.750 |
5.860 |
|
0.110 |
2 |
5,757 |
64 |
|
| 12/04/17 |
8/12/19 |
616 |
|
- cash - |
| |
8/12/19 |
9/16/19 |
35 |
|
|
|
Eldorado Gold |
100 |
535 |
CAD |
10.750 |
11.220 |
|
0.470 |
4 |
6,009 |
56 |
|
| 9/16/19 |
10/28/19 |
42 |
|
- cash - |
| |
10/28/19 |
2/17/20 |
112 |
|
|
|
Eldorado Gold |
100 |
583 |
CAD |
10.300 |
8.830 |
|
-1.470 |
-14 |
5,152 |
-39 |
|
| |
2/17/20 |
3/16/20 |
28 |
|
|
|
Northern Star |
100 |
371 |
AUD |
13.880 |
9.190 |
|
-4.690 |
-34 |
3,412 |
-100 |
|
| 3/16/20 |
3/30/20 |
14 |
|
- cash - |
| |
3/30/20 |
8/03/20 |
126 |
|
|
|
Barrick Gold |
100 |
125 |
CAD |
27.290 |
38.710 |
|
11.420 |
42 |
4,839 |
175 |
|
| |
8/03/20 |
1/25/21 |
175 |
|
|
|
Fresnillo |
100 |
379 |
GBP |
12.750 |
10.820 |
|
-1.930 |
-15 |
4,108 |
-29 |
|
| 1/25/21 |
2/01/21 |
7 |
|
- cash - |
| |
2/01/21 |
3/01/21 |
28 |
|
|
|
Zijin Mining |
100 |
393 |
CNY |
10.440 |
12.320 |
|
1.880 |
18 |
4,847 |
766 |
|
| 3/01/21 |
1/02/23 |
672 |
|
- cash - |
| |
1/02/23 |
1/16/23 |
14 |
|
|
|
Northern Star |
100 |
444 |
AUD |
10.910 |
12.430 |
|
1.520 |
14 |
5,522 |
2,898 |
|
| 1/16/23 |
4/10/23 |
84 |
|
- cash - |
| |
4/10/23 |
10/02/23 |
175 |
|
|
|
Eldorado Gold |
100 |
377 |
CAD |
14.610 |
11.500 |
|
-3.110 |
-21 |
4,349 |
-39 |
|
| 10/02/23 |
10/23/23 |
21 |
|
- cash - |
| |
10/23/23 |
10/30/23 |
7 |
|
|
|
Kinross Gold |
100 |
591 |
CAD |
7.350 |
7.300 |
|
-0.050 |
-1 |
4,319 |
-30 |
|
| 10/30/23 |
12/04/23 |
35 |
|
- cash - |
| |
12/04/23 |
12/11/23 |
7 |
|
|
|
Eldorado Gold |
100 |
244 |
CAD |
17.680 |
16.680 |
|
-1.000 |
-6 |
4,075 |
-95 |
|
| 12/11/23 |
6/25/26 |
927 |
|
- cash - |
| accum | 1/02/06 |
12/11/23 | 2240 |
days out of 7479 invested (30%) |
-59 |
4,075 |
-14 |
|
Instrument Related Contribution
| instrument | L/S | date buy | date sell | days | prc buy | prc sell | | prc diff | d % | | | total |
| Northern Star | long | 6/04/07 | 6/25/07 | 21 | 0.13 | 0.10 | | -0.02 | -18.78 | | | |
| | | 5/17/10 | 5/24/10 | 7 | 0.06 | 0.08 | | 0.02 | 23.81 | | | |
| | | 5/31/10 | 7/05/10 | 35 | 0.06 | 0.05 | | -0.01 | -18.33 | | | |
| | | 8/30/10 | 9/06/10 | 7 | 0.09 | 0.10 | | 0.01 | 7.53 | | | |
| | | 9/27/10 | 10/18/10 | 21 | 0.19 | 0.22 | | 0.03 | 15.79 | | | |
| | | 10/25/10 | 3/28/11 | 154 | 0.21 | 0.34 | | 0.14 | 65.85 | | | |
| | | 4/25/11 | 5/02/11 | 7 | 0.41 | 0.40 | | -0.02 | -3.66 | | | |
| | | 6/27/11 | 7/25/11 | 28 | 0.41 | 0.50 | | 0.09 | 22.22 | | | |
| | | 8/22/11 | 9/12/11 | 21 | 0.55 | 0.60 | | 0.04 | 8.18 | | | |
| | | 11/20/17 | 12/04/17 | 14 | 5.75 | 5.86 | | 0.11 | 1.91 | | | |
| | | 2/17/20 | 3/16/20 | 28 | 13.88 | 9.19 | | -4.69 | -33.79 | | | |
| | | 1/02/23 | 1/16/23 | 14 | 10.91 | 12.43 | | 1.52 | 13.93 | | | 66.07 |
| Barrick Gold | | 3/30/20 | 8/03/20 | 126 | 27.29 | 38.71 | | 11.42 | 41.85 | | | 41.85 |
| Zijin Mining | | 7/13/09 | 12/14/09 | 154 | 7.01 | 6.97 | | -0.04 | -0.57 | | | |
| | | 2/01/21 | 3/01/21 | 28 | 10.44 | 12.32 | | 1.88 | 18.01 | | | 17.33 |
| Wheaton Precious | | 7/16/07 | 7/23/07 | 7 | 15.31 | 14.18 | | -1.13 | -7.38 | | | |
| | | 3/29/10 | 4/19/10 | 21 | 16.32 | 18.00 | | 1.68 | 10.29 | | | 2.15 |
| Peñoles | | 12/19/16 | 3/13/17 | 84 | 389.31 | 442.67 | | 53.36 | 13.71 | | | |
| | | 3/27/17 | 4/03/17 | 7 | 492.31 | 479.99 | | -12.32 | -2.50 | | | |
| | | 4/10/17 | 5/08/17 | 28 | 471.93 | 405.01 | | -66.92 | -14.18 | | | -4.86 |
| Agnico-Eagle Mines | | 10/30/06 | 12/11/06 | 42 | 42.71 | 46.76 | | 4.05 | 9.48 | | | |
| | | 12/18/06 | 3/05/07 | 77 | 45.87 | 42.96 | | -2.91 | -6.34 | | | |
| | | 9/03/07 | 11/19/07 | 77 | 51.58 | 50.68 | | -0.90 | -1.74 | | | |
| | | 3/24/08 | 6/09/08 | 77 | 70.43 | 64.85 | | -5.58 | -7.92 | | | -7.23 |
| Fresnillo | | 3/08/10 | 3/22/10 | 14 | 8.48 | 8.30 | | -0.18 | -2.12 | | | |
| | | 8/03/20 | 1/25/21 | 175 | 12.75 | 10.82 | | -1.93 | -15.14 | | | -16.94 |
| instrument | L/S | date buy | date sell | days | prc buy | prc sell | | prc diff | d % | | | total |
| Kinross Gold | | 12/10/07 | 12/24/07 | 14 | 17.35 | 18.30 | | 0.95 | 5.48 | | | |
| | | 1/07/08 | 1/14/08 | 7 | 23.26 | 20.76 | | -2.50 | -10.75 | | | |
| | | 2/25/08 | 3/17/08 | 21 | 24.13 | 22.21 | | -1.92 | -7.96 | | | |
| | | 5/02/16 | 12/19/16 | 231 | 7.07 | 4.04 | | -3.03 | -42.86 | | | |
| | | 10/23/23 | 10/30/23 | 7 | 7.35 | 7.30 | | -0.05 | -0.68 | | | -50.82 |
| Eldorado Gold | | 1/02/06 | 10/23/06 | 294 | 31.40 | 23.55 | | -7.85 | -25.00 | | | |
| | | 4/30/07 | 5/21/07 | 21 | 34.05 | 30.35 | | -3.70 | -10.87 | | | |
| | | 6/23/08 | 8/04/08 | 42 | 43.40 | 38.60 | | -4.80 | -11.06 | | | |
| | | 8/12/19 | 9/16/19 | 35 | 10.75 | 11.22 | | 0.47 | 4.37 | | | |
| | | 10/28/19 | 2/17/20 | 112 | 10.30 | 8.83 | | -1.47 | -14.27 | | | |
| | | 4/10/23 | 10/02/23 | 175 | 14.61 | 11.50 | | -3.11 | -21.29 | | | |
| | | 12/04/23 | 12/11/23 | 7 | 17.68 | 16.68 | | -1.00 | -5.66 | | | -60.49 |
Annotations
| 1/01/19 | Eldorado Gold | | | reverse stock split 5:1 (five become one) |
| 5/22/17 | Silver Wheaton | | | is now called Wheaton Precious Metals |
| 9/02/15 | Noble Metals | | | complete analysis |
| 5/11/15 | Franco-Nevada | | | registered |
| 3/15/15 | Noble Metals | | | first complete analysis |
|
|