| | Fri, 19th Jun 2026, 3:38UTC |
| | |

Assessment - NAI - Der Natur-Index in Pound sterling - 1/07/24 - RS = 34
⇐
| |
|
instrument |
freshest |
⇓ Δday |
1/07/24 |
⇓ Δwk |
6/11/23 |
prc diff |
⇓ Δ34 |
|
⇓∅-RS |
| |  |
 |
 |
|
L |
 |
NAI 30 |
13,170.545 |
12/08/24 |
-0.97 |
13,351.609 |
-1.36 |
12,222.747 |
1,128.862 |
9.24 |
|
2.18 |
| | |
|
|
|
|
|
Aixtron |
15.561 |
12/08/24 |
-2.19 |
15.239 |
2.12 |
24.280 |
-9.041 |
-37.24 |
|
-38.97 |
| | |
|
|
|
|
|
Aspen Pharmacare |
9.927 |
12/08/24 |
0.86 |
10.012 |
-0.85 |
7.810 |
2.202 |
28.20 |
|
24.41 |
| | |
|
|
|
|
|
BioNTech |
63.772 |
12/08/24 |
-0.22 |
62.357 |
2.27 |
80.580 |
-18.223 |
-22.62 |
|
-21.14 |
| | |
|
|
|
S |
|
EJR |
12.592 |
9/08/24 |
-0.87 |
12.763 |
-1.34 |
14.513 |
-1.750 |
-12.06 |
|
-13.68 |
| | |
|
|
|
L |
|
First Solar |
173.417 |
12/08/24 |
3.51 |
176.169 |
-1.56 |
118.773 |
57.397 |
48.32 |
|
29.56 |
| | |
|
|
|
L |
|
Geberit |
457.653 |
12/08/24 |
-0.72 |
463.255 |
-1.21 |
414.964 |
48.291 |
11.64 |
|
5.46 |
| | |
|
|
|
L |
|
Hannon Armstrong SIC |
23.897 |
12/08/24 |
-1.63 |
22.726 |
5.15 |
16.446 |
6.280 |
38.19 |
|
18.03 |
| | |
|
|
|
|
|
Interface |
12.902 |
12/08/24 |
-0.79 |
11.525 |
11.94 |
7.677 |
3.848 |
50.12 |
|
25.11 |
| | |
|
|
|
|
|
Kadant |
229.635 |
12/08/24 |
-1.48 |
229.666 |
-0.01 |
198.561 |
31.106 |
15.67 |
|
12.66 |
| | |
|
|
|
|
|
Kingfisher |
271.400 |
12/08/24 |
0.18 |
251.400 |
7.96 |
218.800 |
32.600 |
14.90 |
|
6.04 |
| | |
|
|
|
L |
|
Kurita Water |
27.583 |
9/08/24 |
-9.14 |
33.604 |
-17.92 |
26.215 |
7.390 |
28.19 |
|
12.00 |
| | |
|
|
|
L |
|
Mayr-Melnhof |
87.901 |
12/08/24 |
1.17 |
94.010 |
-6.50 |
99.445 |
-5.435 |
-5.47 |
|
-9.30 |
| | |
|
|
|
S |
|
Molina Healthcare |
267.106 |
12/08/24 |
-0.15 |
231.106 |
15.58 |
281.662 |
-50.556 |
-17.95 |
|
-15.71 |
| | |
|
|
|
S |
|
Natura Cosmeticos |
2.323 |
12/08/24 |
-0.91 |
2.205 |
5.34 |
2.161 |
0.044 |
2.05 |
|
-13.38 |
| | |
|
|
|
L |
|
NVidia |
86.238 |
12/08/24 |
4.08 |
98.324 |
-12.29 |
36.973 |
61.351 |
165.93 |
|
116.72 |
| | |
|
|
|
L |
|
Ormat Technologies |
56.724 |
12/08/24 |
-1.10 |
54.739 |
3.63 |
52.230 |
2.509 |
4.80 |
|
-1.65 |
| | |
|
|
|
|
|
Pearson |
1,034.500 |
12/08/24 |
-0.72 |
983.600 |
5.17 |
954.000 |
29.600 |
3.10 |
|
2.82 |
| | |
|
|
|
S |
|
Potlatch |
32.321 |
12/08/24 |
-1.99 |
29.885 |
8.15 |
37.215 |
-7.330 |
-19.70 |
|
-18.34 |
| | |
|
|
|
|
|
Ricoh |
6.142 |
9/08/24 |
2.12 |
6.874 |
-10.65 |
6.772 |
0.101 |
1.50 |
|
3.23 |
| | |
|
|
|
L |
|
Scatec |
6.269 |
12/08/24 |
-1.46 |
6.366 |
-1.51 |
4.850 |
1.516 |
31.27 |
|
20.18 |
| | |
|
|
|
|
|
Signify |
17.733 |
12/08/24 |
-0.76 |
20.024 |
-11.44 |
22.267 |
-2.243 |
-10.07 |
|
-12.02 |
| | |
|
|
|
S |
|
Sims Metal Managemt |
5.098 |
12/08/24 |
-2.71 |
5.366 |
-5.00 |
6.659 |
-1.293 |
-19.42 |
|
-22.13 |
| | |
|
|
|
|
|
Smith and Nephew |
1,156.000 |
12/08/24 |
-0.86 |
975.600 |
18.49 |
983.600 |
-8.000 |
-0.81 |
|
-6.12 |
| | |
|
|
|
|
|
Steelcase |
9.722 |
12/08/24 |
-1.76 |
10.252 |
-5.17 |
9.019 |
1.233 |
13.67 |
|
17.26 |
| |
|
instrument |
freshest |
⇓ Δday |
1/07/24 |
⇓ Δwk |
6/11/23 |
prc diff |
⇓ Δ34 |
|
⇓∅-RS |
| | |
|
|
|
L |
|
Steico |
22.781 |
12/08/24 |
0.56 |
24.606 |
-7.41 |
25.816 |
-1.210 |
-4.69 |
|
-3.69 |
| | |
|
|
|
|
|
Svenska Cellulosa B |
10.195 |
12/08/24 |
0.81 |
11.609 |
-12.18 |
11.677 |
-0.069 |
-0.59 |
|
4.19 |
| | |
|
|
|
|
|
Tesla Motors |
156.220 |
12/08/24 |
-1.26 |
166.005 |
-5.89 |
177.202 |
-11.197 |
-6.32 |
|
-1.30 |
| | |
|
|
|
|
|
Tomra Systems |
11.724 |
12/08/24 |
0.13 |
9.753 |
20.21 |
6.741 |
3.011 |
44.67 |
|
2.44 |
| | |
|
|
|
L |
|
United Natural Foods |
9.745 |
12/08/24 |
-1.28 |
10.117 |
-3.67 |
12.470 |
-2.352 |
-18.87 |
|
-12.37 |
| | |
|
|
|
|
|
Vestas Wind Systems |
17.322 |
12/08/24 |
-7.76 |
18.443 |
-6.08 |
18.942 |
-0.499 |
-2.64 |
|
-9.78 |
| NAI 30 - 30 out of 30 instruments rated - 1/07/24 / 6/11/23 - 16 did rise, Market-Ratio(34) in GBP = 53.33 % |
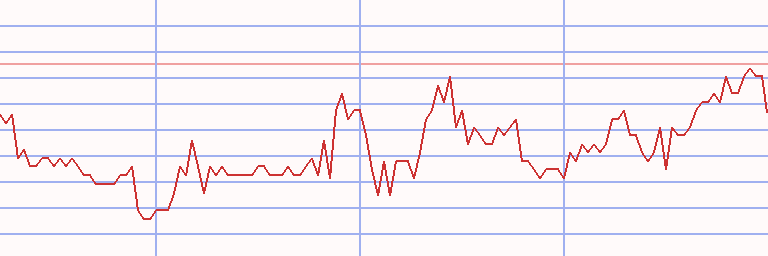
Technical Chart
Transactions NAI - Der Natur-Index in Pound sterling * L34 - 75 ex 2 (1)
|
⇐ |
| |
| L/S | date buy | date sell | days | | instrument | spl | pieces | | prc buy | prc sell | | prc diff | d % | asset | yield | | | long |
2/01/06 |
10/04/06 |
98 |
|
|
|
Ormat Technologies |
100 |
615 |
|
16.236 |
20.175 |
|
3.939 |
24 |
12,422 |
125 |
|
| |
10/04/06 |
22/05/06 |
42 |
|
|
|
NVidia |
100 |
43,285 |
|
0.287 |
0.213 |
|
-0.074 |
-26 |
9,212 |
-93 |
|
| |
22/05/06 |
19/06/06 |
28 |
|
|
|
Ormat Technologies |
100 |
494 |
|
18.627 |
17.838 |
|
-0.789 |
-4 |
8,822 |
-43 |
|
| |
19/06/06 |
3/07/06 |
14 |
|
|
|
Molina Healthcare |
100 |
451 |
|
19.523 |
20.182 |
|
0.659 |
3 |
9,120 |
138 |
|
| |
3/07/06 |
17/07/06 |
14 |
|
|
|
Ormat Technologies |
100 |
439 |
|
20.734 |
18.440 |
|
-2.294 |
-11 |
8,112 |
-95 |
|
| 17/07/06 |
24/07/06 |
7 |
|
- cash - |
| |
24/07/06 |
14/08/06 |
21 |
|
|
|
Ormat Technologies |
100 |
429 |
|
18.903 |
18.311 |
|
-0.592 |
-3 |
7,858 |
-42 |
|
| 14/08/06 |
21/08/06 |
7 |
|
- cash - |
| |
21/08/06 |
28/08/06 |
7 |
|
|
|
Geberit |
100 |
123 |
|
63.744 |
62.199 |
|
-1.544 |
-2 |
7,668 |
-72 |
|
| 28/08/06 |
4/09/06 |
7 |
|
- cash - |
| |
4/09/06 |
18/09/06 |
14 |
|
|
|
NVidia |
100 |
30,758 |
|
0.249 |
0.272 |
|
0.023 |
9 |
8,362 |
856 |
|
| 18/09/06 |
2/10/06 |
14 |
|
- cash - |
| |
2/10/06 |
9/10/06 |
7 |
|
|
|
NVidia |
100 |
32,578 |
|
0.257 |
0.293 |
|
0.037 |
14 |
9,555 |
104,656 |
|
| 9/10/06 |
16/10/06 |
7 |
|
- cash - |
| |
16/10/06 |
23/10/06 |
7 |
|
|
|
NVidia |
100 |
31,557 |
|
0.303 |
0.279 |
|
-0.023 |
-8 |
8,819 |
-98 |
|
| 23/10/06 |
18/12/06 |
56 |
|
- cash - |
| |
18/12/06 |
25/12/06 |
7 |
|
|
|
Vestas Wind Systems |
100 |
2,074 |
|
4.252 |
4.119 |
|
-0.133 |
-3 |
8,544 |
-81 |
|
| 25/12/06 |
1/01/07 |
7 |
|
- cash - |
| |
1/01/07 |
8/01/07 |
7 |
|
|
|
Vestas Wind Systems |
100 |
1,980 |
|
4.315 |
4.223 |
|
-0.091 |
-2 |
8,363 |
-67 |
|
| 8/01/07 |
15/01/07 |
7 |
|
- cash - |
| |
15/01/07 |
11/06/07 |
147 |
|
|
|
Vestas Wind Systems |
100 |
1,976 |
|
4.231 |
6.774 |
|
2.543 |
60 |
13,388 |
222 |
|
| 11/06/07 |
2/07/07 |
21 |
|
- cash - |
| |
2/07/07 |
30/07/07 |
28 |
|
|
|
Aixtron |
100 |
3,022 |
|
4.429 |
4.238 |
|
-0.191 |
-4 |
12,810 |
-44 |
|
| 30/07/07 |
22/06/09 |
693 |
|
- cash - |
| |
22/06/09 |
29/06/09 |
7 |
|
|
|
Steico |
100 |
3,897 |
|
3.287 |
3.352 |
|
0.065 |
2 |
13,064 |
178 |
|
| 29/06/09 |
13/07/09 |
14 |
|
- cash - |
| |
13/07/09 |
1/02/10 |
203 |
|
|
|
Aixtron |
100 |
1,491 |
|
8.759 |
19.109 |
|
10.350 |
118 |
28,495 |
307 |
|
| 1/02/10 |
22/02/10 |
21 |
|
- cash - |
| |
22/02/10 |
3/05/10 |
70 |
|
|
|
Steico |
100 |
3,814 |
|
7.470 |
6.953 |
|
-0.517 |
-7 |
26,522 |
-31 |
|
| |
3/05/10 |
10/05/10 |
7 |
|
|
|
Interface |
100 |
2,966 |
|
8.939 |
8.968 |
|
0.029 |
0 |
26,609 |
19 |
|
| 10/05/10 |
3/01/11 |
238 |
|
- cash - |
| |
3/01/11 |
10/01/11 |
7 |
|
|
|
Steelcase |
100 |
3,852 |
|
6.907 |
6.857 |
|
-0.050 |
-1 |
26,417 |
-31 |
|
| |
10/01/11 |
21/03/11 |
70 |
|
|
|
NVidia |
100 |
79,622 |
|
0.332 |
0.273 |
|
-0.058 |
-18 |
21,773 |
-64 |
|
| 21/03/11 |
25/04/11 |
35 |
|
- cash - |
| |
25/04/11 |
2/05/11 |
7 |
|
|
|
Kadant |
100 |
1,165 |
|
18.685 |
18.542 |
|
-0.143 |
-1 |
21,606 |
-33 |
|
| 2/05/11 |
16/04/12 |
350 |
|
- cash - |
| |
16/04/12 |
23/04/12 |
7 |
|
|
|
Aspen Pharmacare |
100 |
2,342 |
|
9.225 |
10.017 |
|
0.792 |
9 |
23,461 |
7,238 |
|
| 23/04/12 |
13/08/12 |
112 |
|
- cash - |
| |
13/08/12 |
20/08/12 |
7 |
|
|
|
Aspen Pharmacare |
100 |
2,218 |
|
10.577 |
10.451 |
|
-0.126 |
-1 |
23,181 |
-46 |
|
| 20/08/12 |
31/12/12 |
133 |
|
- cash - |
| |
31/12/12 |
14/01/13 |
14 |
|
|
|
First Solar |
100 |
1,115 |
|
20.786 |
18.649 |
|
-2.137 |
-10 |
20,798 |
-94 |
|
| |
14/01/13 |
21/01/13 |
7 |
|
|
|
Steelcase |
100 |
2,477 |
|
8.395 |
8.551 |
|
0.156 |
2 |
21,185 |
161 |
|
| L/S | date buy | date sell | days | | instrument | spl | pieces | | prc buy | prc sell | | prc diff | d % | asset | yield | | | |
21/01/13 |
18/02/13 |
28 |
|
|
|
Ricoh |
100 |
280,408 |
|
0.076 |
0.066 |
|
-0.009 |
-12 |
18,630 |
-81 |
|
| |
18/02/13 |
25/02/13 |
7 |
|
|
|
First Solar |
100 |
800 |
|
23.283 |
16.719 |
|
-6.563 |
-28 |
13,379 |
-100 |
|
| 25/02/13 |
4/03/13 |
7 |
|
- cash - |
| |
4/03/13 |
1/04/13 |
28 |
|
|
|
Steelcase |
100 |
1,328 |
|
10.068 |
8.566 |
|
-1.502 |
-15 |
11,385 |
-88 |
|
| |
1/04/13 |
8/04/13 |
7 |
|
|
|
Tesla Motors |
100 |
5,908 |
|
1.927 |
1.819 |
|
-0.108 |
-6 |
10,746 |
-95 |
|
| |
8/04/13 |
15/04/13 |
7 |
|
|
|
First Solar |
100 |
444 |
|
24.201 |
24.832 |
|
0.631 |
3 |
11,026 |
283 |
|
| 15/04/13 |
22/04/13 |
7 |
|
- cash - |
| |
22/04/13 |
27/05/13 |
35 |
|
|
|
First Solar |
100 |
372 |
|
29.616 |
34.225 |
|
4.609 |
16 |
12,740 |
352 |
|
| |
27/05/13 |
4/11/13 |
161 |
|
|
|
Tesla Motors |
100 |
2,619 |
|
4.864 |
7.314 |
|
2.450 |
50 |
19,158 |
152 |
|
| 4/11/13 |
25/11/13 |
21 |
|
- cash - |
| |
25/11/13 |
13/01/14 |
49 |
|
|
|
Vestas Wind Systems |
100 |
5,508 |
|
3.478 |
4.394 |
|
0.916 |
26 |
24,202 |
470 |
|
| 13/01/14 |
20/01/14 |
7 |
|
- cash - |
| |
20/01/14 |
3/02/14 |
14 |
|
|
|
Vestas Wind Systems |
100 |
5,702 |
|
4.244 |
3.972 |
|
-0.272 |
-6 |
22,651 |
-82 |
|
| 3/02/14 |
10/02/14 |
7 |
|
- cash - |
| |
10/02/14 |
24/02/14 |
14 |
|
|
|
Vestas Wind Systems |
100 |
5,334 |
|
4.246 |
4.340 |
|
0.094 |
2 |
23,154 |
77 |
|
| 24/02/14 |
31/03/14 |
35 |
|
- cash - |
| |
31/03/14 |
14/04/14 |
14 |
|
|
|
Vestas Wind Systems |
100 |
4,801 |
|
4.822 |
4.831 |
|
0.009 |
0 |
23,196 |
5 |
|
| 14/04/14 |
28/04/14 |
14 |
|
- cash - |
| |
28/04/14 |
12/05/14 |
14 |
|
|
|
Vestas Wind Systems |
100 |
4,568 |
|
5.078 |
5.977 |
|
0.899 |
18 |
27,303 |
6,916 |
|
| 12/05/14 |
9/03/15 |
301 |
|
- cash - |
| |
9/03/15 |
16/03/15 |
7 |
|
|
|
Aspen Pharmacare |
100 |
1,165 |
|
23.421 |
20.908 |
|
-2.513 |
-11 |
24,375 |
-100 |
|
| |
16/03/15 |
6/04/15 |
21 |
|
|
|
Molina Healthcare |
100 |
572 |
|
42.605 |
45.335 |
|
2.731 |
6 |
25,937 |
194 |
|
| 6/04/15 |
13/04/15 |
7 |
|
- cash - |
| |
13/04/15 |
20/04/15 |
7 |
|
|
|
Molina Healthcare |
100 |
572 |
|
45.301 |
42.205 |
|
-3.096 |
-7 |
24,166 |
-98 |
|
| 20/04/15 |
25/05/15 |
35 |
|
- cash - |
| |
25/05/15 |
29/06/15 |
35 |
|
|
|
Molina Healthcare |
100 |
526 |
|
45.904 |
44.542 |
|
-1.362 |
-3 |
23,450 |
-27 |
|
| 29/06/15 |
10/08/15 |
42 |
|
- cash - |
| |
10/08/15 |
17/08/15 |
7 |
|
|
|
Vestas Wind Systems |
100 |
3,235 |
|
7.246 |
7.191 |
|
-0.055 |
-1 |
23,271 |
-33 |
|
| 17/08/15 |
12/09/16 |
392 |
|
- cash - |
| |
12/09/16 |
26/09/16 |
14 |
|
|
|
NVidia |
100 |
20,435 |
|
1.139 |
1.240 |
|
0.101 |
9 |
25,334 |
816 |
|
| 26/09/16 |
3/10/16 |
7 |
|
- cash - |
| |
3/10/16 |
17/10/16 |
14 |
|
|
|
NVidia |
100 |
19,005 |
|
1.333 |
1.346 |
|
0.013 |
1 |
25,576 |
28 |
|
| 17/10/16 |
2/01/17 |
77 |
|
- cash - |
| |
2/01/17 |
23/01/17 |
21 |
|
|
|
NVidia |
100 |
11,770 |
|
2.173 |
2.096 |
|
-0.077 |
-4 |
24,667 |
-47 |
|
| 23/01/17 |
13/02/17 |
21 |
|
- cash - |
| |
13/02/17 |
27/02/17 |
14 |
|
|
|
NVidia |
100 |
11,401 |
|
2.163 |
2.098 |
|
-0.066 |
-3 |
23,918 |
-55 |
|
| 27/02/17 |
15/05/17 |
77 |
|
- cash - |
| |
15/05/17 |
4/12/17 |
203 |
|
|
|
NVidia |
100 |
9,187 |
|
2.603 |
3.464 |
|
0.861 |
33 |
31,826 |
67 |
|
| |
4/12/17 |
8/01/18 |
35 |
|
|
|
Aixtron |
100 |
3,043 |
|
10.457 |
11.360 |
|
0.903 |
9 |
34,575 |
137 |
|
| 8/01/18 |
15/01/18 |
7 |
|
- cash - |
| |
15/01/18 |
29/01/18 |
14 |
|
|
|
Aixtron |
100 |
3,192 |
|
10.831 |
11.368 |
|
0.536 |
5 |
36,287 |
253 |
|
| 29/01/18 |
26/02/18 |
28 |
|
- cash - |
| |
26/02/18 |
5/03/18 |
7 |
|
|
|
Aixtron |
100 |
2,788 |
|
13.012 |
14.381 |
|
1.369 |
11 |
40,103 |
18,300 |
|
| L/S | date buy | date sell | days | | instrument | spl | pieces | | prc buy | prc sell | | prc diff | d % | asset | yield | |
| 5/03/18 |
23/04/18 |
49 |
|
- cash - |
| |
23/04/18 |
30/04/18 |
7 |
|
|
|
Aixtron |
100 |
2,907 |
|
13.795 |
10.414 |
|
-3.380 |
-25 |
30,277 |
-100 |
|
| 30/04/18 |
18/11/19 |
567 |
|
- cash - |
| |
18/11/19 |
2/12/19 |
14 |
|
|
|
Tesla Motors |
100 |
1,683 |
|
17.989 |
17.251 |
|
-0.737 |
-4 |
29,036 |
-66 |
|
| 2/12/19 |
9/12/19 |
7 |
|
- cash - |
| |
9/12/19 |
2/03/20 |
84 |
|
|
|
Tesla Motors |
100 |
1,687 |
|
17.202 |
38.783 |
|
21.582 |
125 |
65,444 |
3,321 |
|
| 2/03/20 |
2/11/20 |
245 |
|
- cash - |
| |
2/11/20 |
3/05/21 |
182 |
|
|
|
Tesla Motors |
100 |
632 |
|
103.421 |
164.071 |
|
60.650 |
59 |
103,774 |
152 |
|
| |
3/05/21 |
13/09/21 |
133 |
|
|
|
BioNTech |
100 |
691 |
|
150.129 |
236.273 |
|
86.144 |
57 |
163,300 |
247 |
|
| 13/09/21 |
19/06/26 |
1740 |
|
- cash - |
| accum | 2/01/06 |
13/09/21 | 2044 |
days out of 7473 invested (27%) |
1,533 |
163,300 |
65 |
|
Instrument Related Contribution
| instrument | L/S | date buy | date sell | days | prc buy | prc sell | | prc diff | d % | | | total |
| Tesla Motors | long | 1/04/13 | 8/04/13 | 7 | 1.93 | 1.82 | | -0.11 | -5.62 | | | |
| | | 27/05/13 | 4/11/13 | 161 | 4.86 | 7.31 | | 2.45 | 50.38 | | | |
| | | 18/11/19 | 2/12/19 | 14 | 17.99 | 17.25 | | -0.74 | -4.10 | | | |
| | | 9/12/19 | 2/03/20 | 84 | 17.20 | 38.78 | | 21.58 | 125.46 | | | |
| | | 2/11/20 | 3/05/21 | 182 | 103.42 | 164.07 | | 60.65 | 58.64 | | | 386.85 |
| Vestas Wind Systems | | 18/12/06 | 25/12/06 | 7 | 4.25 | 4.12 | | -0.13 | -3.12 | | | |
| | | 1/01/07 | 8/01/07 | 7 | 4.31 | 4.22 | | -0.09 | -2.12 | | | |
| | | 15/01/07 | 11/06/07 | 147 | 4.23 | 6.77 | | 2.54 | 60.10 | | | |
| | | 25/11/13 | 13/01/14 | 49 | 3.48 | 4.39 | | 0.92 | 26.33 | | | |
| | | 20/01/14 | 3/02/14 | 14 | 4.24 | 3.97 | | -0.27 | -6.41 | | | |
| | | 10/02/14 | 24/02/14 | 14 | 4.25 | 4.34 | | 0.09 | 2.22 | | | |
| | | 31/03/14 | 14/04/14 | 14 | 4.82 | 4.83 | | 0.01 | 0.18 | | | |
| | | 28/04/14 | 12/05/14 | 14 | 5.08 | 5.98 | | 0.90 | 17.71 | | | |
| | | 10/08/15 | 17/08/15 | 7 | 7.25 | 7.19 | | -0.06 | -0.76 | | | 114.73 |
| Aixtron | | 2/07/07 | 30/07/07 | 28 | 4.43 | 4.24 | | -0.19 | -4.32 | | | |
| | | 13/07/09 | 1/02/10 | 203 | 8.76 | 19.11 | | 10.35 | 118.16 | | | |
| | | 4/12/17 | 8/01/18 | 35 | 10.46 | 11.36 | | 0.90 | 8.64 | | | |
| | | 15/01/18 | 29/01/18 | 14 | 10.83 | 11.37 | | 0.54 | 4.95 | | | |
| | | 26/02/18 | 5/03/18 | 7 | 13.01 | 14.38 | | 1.37 | 10.52 | | | |
| | | 23/04/18 | 30/04/18 | 7 | 13.79 | 10.41 | | -3.38 | -24.50 | | | 98.58 |
| BioNTech | | 3/05/21 | 13/09/21 | 133 | 150.13 | 236.27 | | 86.14 | 57.38 | | | 57.38 |
| Ormat Technologies | | 2/01/06 | 10/04/06 | 98 | 16.24 | 20.17 | | 3.94 | 24.26 | | | |
| | | 22/05/06 | 19/06/06 | 28 | 18.63 | 17.84 | | -0.79 | -4.24 | | | |
| | | 3/07/06 | 17/07/06 | 14 | 20.73 | 18.44 | | -2.29 | -11.07 | | | |
| | | 24/07/06 | 14/08/06 | 21 | 18.90 | 18.31 | | -0.59 | -3.13 | | | 2.51 |
| instrument | L/S | date buy | date sell | days | prc buy | prc sell | | prc diff | d % | | | total |
| Interface | | 3/05/10 | 10/05/10 | 7 | 8.94 | 8.97 | | 0.03 | 0.33 | | | 0.33 |
| Molina Healthcare | | 19/06/06 | 3/07/06 | 14 | 19.52 | 20.18 | | 0.66 | 3.38 | | | |
| | | 16/03/15 | 6/04/15 | 21 | 42.60 | 45.34 | | 2.73 | 6.41 | | | |
| | | 13/04/15 | 20/04/15 | 7 | 45.30 | 42.20 | | -3.10 | -6.83 | | | |
| | | 25/05/15 | 29/06/15 | 35 | 45.90 | 44.54 | | -1.36 | -2.97 | | | -0.56 |
| Kadant | | 25/04/11 | 2/05/11 | 7 | 18.69 | 18.54 | | -0.14 | -0.77 | | | -0.77 |
| Geberit | | 21/08/06 | 28/08/06 | 7 | 63.74 | 62.20 | | -1.54 | -2.42 | | | -2.42 |
| NVidia | | 10/04/06 | 22/05/06 | 42 | 0.29 | 0.21 | | -0.07 | -25.84 | | | |
| | | 4/09/06 | 18/09/06 | 14 | 0.25 | 0.27 | | 0.02 | 9.05 | | | |
| | | 2/10/06 | 9/10/06 | 7 | 0.26 | 0.29 | | 0.04 | 14.27 | | | |
| | | 16/10/06 | 23/10/06 | 7 | 0.30 | 0.28 | | -0.02 | -7.70 | | | |
| | | 10/01/11 | 21/03/11 | 70 | 0.33 | 0.27 | | -0.06 | -17.58 | | | |
| | | 12/09/16 | 26/09/16 | 14 | 1.14 | 1.24 | | 0.10 | 8.86 | | | |
| | | 3/10/16 | 17/10/16 | 14 | 1.33 | 1.35 | | 0.01 | 0.96 | | | |
| | | 2/01/17 | 23/01/17 | 21 | 2.17 | 2.10 | | -0.08 | -3.55 | | | |
| | | 13/02/17 | 27/02/17 | 14 | 2.16 | 2.10 | | -0.07 | -3.04 | | | |
| | | 15/05/17 | 4/12/17 | 203 | 2.60 | 3.46 | | 0.86 | 33.07 | | | -3.86 |
| Aspen Pharmacare | | 16/04/12 | 23/04/12 | 7 | 9.22 | 10.02 | | 0.79 | 8.59 | | | |
| | | 13/08/12 | 20/08/12 | 7 | 10.58 | 10.45 | | -0.13 | -1.19 | | | |
| | | 9/03/15 | 16/03/15 | 7 | 23.42 | 20.91 | | -2.51 | -10.73 | | | -4.22 |
| Steico | | 22/06/09 | 29/06/09 | 7 | 3.29 | 3.35 | | 0.07 | 1.98 | | | |
| | | 22/02/10 | 3/05/10 | 70 | 7.47 | 6.95 | | -0.52 | -6.93 | | | -5.08 |
| Ricoh | | 21/01/13 | 18/02/13 | 28 | 0.08 | 0.07 | | -0.01 | -12.06 | | | -12.06 |
| Steelcase | | 3/01/11 | 10/01/11 | 7 | 6.91 | 6.86 | | -0.05 | -0.72 | | | |
| | | 14/01/13 | 21/01/13 | 7 | 8.39 | 8.55 | | 0.16 | 1.86 | | | |
| | | 4/03/13 | 1/04/13 | 28 | 10.07 | 8.57 | | -1.50 | -14.91 | | | -13.96 |
| instrument | L/S | date buy | date sell | days | prc buy | prc sell | | prc diff | d % | | | total |
| First Solar | | 31/12/12 | 14/01/13 | 14 | 20.79 | 18.65 | | -2.14 | -10.28 | | | |
| | | 18/02/13 | 25/02/13 | 7 | 23.28 | 16.72 | | -6.56 | -28.19 | | | |
| | | 8/04/13 | 15/04/13 | 7 | 24.20 | 24.83 | | 0.63 | 2.61 | | | |
| | | 22/04/13 | 27/05/13 | 35 | 29.62 | 34.23 | | 4.61 | 15.56 | | | -23.60 |
Annotations
| 10/06/24 | NVidia | | | stock split 1:10 (ten for one) |
| 28/03/24 | EJR | | | stock split 1:3 (three for one) |
| 29/02/24 | NAI 30 | | | Component update: Geberit and Hannon Armstrong replace Li-Cycle and Umweltbank |
| 1/03/23 | NAI 30 | | | First Solar und Signify replace Acciona and Shimano |
| 25/08/22 | Tesla Motors | | | stock split 1:3 (three for one) |
| 27/05/22 | Tomra Systems | | | stock split 1:2 (two for one) |
| 20/07/21 | NVidia | | | stock split 1:4 (four for one) |
| 9/02/16 | NAI 30 | | | Smith & Nephew and Tesla Motors replace Keurig Green Mountain and SolarWorld |
| 17/08/15 | NAI 30 | | | complete analysis |
| 1/07/15 | Scatec Solar | | | monitoring started |
| 14/03/15 | NAI 30 | | | first complete analysis |
|
|