| | Tue, Jun 23rd, 2026, 22:51UTC |
| | |

Assessment - STOXX Nordic 30 in Pound sterling - 7/01/24 - RS = 12
⇐
| |
|
⇓instrument |
freshest |
⇓ Δday |
7/01/24 |
⇓ Δwk |
4/08/24 |
prc diff |
⇓ Δ12 |
|
∅-RS |
| |  |
 |
 |
|
|
 |
Stoxx Nordic 30 |
11,499.908 |
8/12/24 |
-0.46 |
11,986.845 |
-4.06 |
11,964.251 |
22.593 |
0.19 |
|
6.97 |
| | |
|
|
|
|
|
Novo Nordisk |
101.590 |
8/12/24 |
-2.80 |
114.299 |
-11.12 |
100.240 |
14.059 |
14.03 |
|
37.83 |
| | |
|
|
|
|
|
EQT |
23.552 |
8/12/24 |
-0.13 |
23.411 |
0.60 |
25.058 |
-1.648 |
-6.58 |
|
22.55 |
| | |
|
|
|
L |
|
Atlas Copco A |
13.178 |
8/12/24 |
0.28 |
14.789 |
-10.89 |
13.696 |
1.093 |
7.98 |
|
20.46 |
| | |
|
|
|
L |
|
Investor |
21.276 |
8/12/24 |
0.30 |
21.577 |
-1.40 |
19.674 |
1.903 |
9.67 |
|
23.97 |
| | |
|
|
|
|
|
Novonesis |
48.832 |
8/12/24 |
0.12 |
48.059 |
1.61 |
44.703 |
3.356 |
7.51 |
|
19.01 |
| | |
|
|
|
|
|
S.E.B |
11.211 |
8/12/24 |
-0.10 |
11.739 |
-4.50 |
11.157 |
0.582 |
5.21 |
|
15.38 |
| | |
|
|
|
|
|
Assa Abloy |
22.756 |
8/12/24 |
0.13 |
22.339 |
1.86 |
22.860 |
-0.520 |
-2.28 |
|
10.34 |
| | |
|
|
|
L |
|
Ericsson |
5.288 |
8/12/24 |
1.14 |
4.992 |
5.93 |
4.119 |
0.873 |
21.19 |
|
18.68 |
| | |
|
|
|
L |
|
Kone |
39.666 |
8/12/24 |
-0.32 |
39.199 |
1.19 |
37.066 |
2.134 |
5.76 |
|
4.29 |
| | |
|
|
|
|
|
Volvo |
19.022 |
8/12/24 |
-0.12 |
20.338 |
-6.47 |
21.962 |
-1.624 |
-7.40 |
|
9.65 |
| | |
|
|
|
L |
|
Essity B |
22.101 |
8/12/24 |
-0.97 |
20.524 |
7.68 |
19.158 |
1.366 |
7.13 |
|
7.47 |
| | |
|
|
|
|
|
Coloplast |
100.623 |
8/12/24 |
0.25 |
94.707 |
6.25 |
105.254 |
-10.548 |
-10.02 |
|
0.92 |
| | |
|
|
|
|
|
Swedbank |
15.406 |
8/12/24 |
-0.86 |
16.559 |
-6.96 |
16.623 |
-0.064 |
-0.39 |
|
9.37 |
| | |
|
|
|
|
|
Nordea Bank |
8.912 |
8/12/24 |
-0.13 |
9.682 |
-7.95 |
9.243 |
0.439 |
4.75 |
|
5.91 |
| | |
|
|
|
|
|
Hexagon |
7.491 |
8/12/24 |
-0.15 |
8.957 |
-16.36 |
9.280 |
-0.323 |
-3.49 |
|
8.42 |
| | |
|
|
|
|
|
UPM-Kymmene |
25.225 |
8/12/24 |
0.17 |
27.872 |
-9.50 |
27.089 |
0.783 |
2.89 |
|
2.90 |
| | |
|
|
|
L |
|
Nokia |
2.984 |
8/12/24 |
1.05 |
3.113 |
-4.14 |
2.759 |
0.355 |
12.86 |
|
7.45 |
| | |
|
|
|
L |
|
Carlsberg B |
91.202 |
8/12/24 |
|
96.026 |
-5.02 |
107.439 |
-11.413 |
-10.62 |
|
-10.00 |
| | |
|
|
|
|
|
Sandvik |
15.071 |
8/12/24 |
-0.54 |
15.994 |
-5.77 |
18.224 |
-2.230 |
-12.24 |
|
0.18 |
| | |
|
|
|
S |
|
DNB |
15.911 |
8/12/24 |
0.14 |
15.726 |
1.18 |
16.003 |
-0.278 |
-1.74 |
|
1.04 |
| | |
|
|
|
|
|
Vestas Wind Systems |
17.322 |
8/12/24 |
-7.76 |
18.443 |
-6.08 |
21.144 |
-2.701 |
-12.77 |
|
-9.78 |
| | |
|
|
|
S |
|
Svenska Handelsbank |
7.599 |
8/12/24 |
0.29 |
7.573 |
0.34 |
8.278 |
-0.705 |
-8.52 |
|
0.12 |
| | |
|
|
|
|
|
Sampo |
34.355 |
8/12/24 |
0.40 |
34.092 |
0.77 |
34.012 |
0.080 |
0.23 |
|
0.16 |
| | |
|
|
|
L |
|
Ørsted |
47.501 |
8/12/24 |
0.63 |
42.780 |
11.04 |
44.623 |
-1.843 |
-4.13 |
|
-6.45 |
| |
|
⇓instrument |
freshest |
⇓ Δday |
7/01/24 |
⇓ Δwk |
4/08/24 |
prc diff |
⇓ Δ12 |
|
∅-RS |
| | |
|
|
|
|
|
Equinor |
22.529 |
8/12/24 |
3.19 |
22.640 |
-0.49 |
21.877 |
0.763 |
3.49 |
|
-3.30 |
| | |
|
|
|
L |
|
DSV |
138.294 |
8/12/24 |
|
130.102 |
6.30 |
131.510 |
-1.408 |
-1.07 |
|
-3.61 |
| | |
|
|
|
S |
|
Evolution |
74.211 |
8/12/24 |
-0.88 |
82.238 |
-9.76 |
97.586 |
-15.348 |
-15.73 |
|
-8.02 |
| | |
|
|
|
|
|
Genmab |
207.185 |
8/12/24 |
0.89 |
197.343 |
4.99 |
235.879 |
-38.535 |
-16.34 |
|
-21.61 |
| | |
|
|
|
|
|
NIBE Industrier |
3.316 |
8/12/24 |
0.18 |
3.359 |
-1.26 |
3.683 |
-0.324 |
-8.80 |
|
-30.42 |
| | |
|
|
|
S |
|
Neste |
15.446 |
8/12/24 |
-1.54 |
14.305 |
7.98 |
23.409 |
-9.104 |
-38.89 |
|
-41.85 |
| Nordic 30 - 30 out of 30 instruments rated - 7/01/24 / 4/08/24 - 13 did rise, Market-Ratio(12) in GBP = 43.33 % |
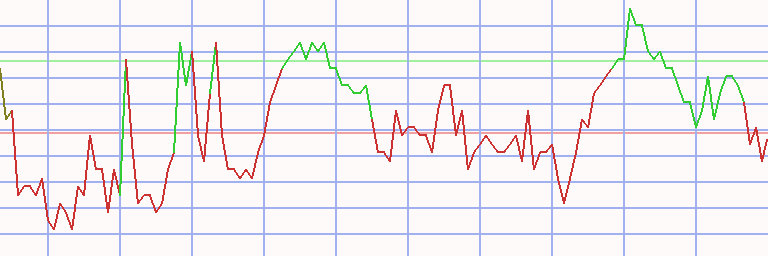
Technical Chart
Transactions STOXX Nordic 30 in Pound sterling * L12 - 76/48 (1)
|
⇐ |
| |
| L/S | date buy | date sell | days | | instrument | spl | pieces | | prc buy | prc sell | | prc diff | d % | asset | yield | |
| 1/02/06 |
8/28/06 |
238 |
|
- cash - |
| long |
8/28/06 |
5/07/07 |
252 |
|
|
|
Carlsberg A |
100 |
266 |
|
37.461 |
56.409 |
|
18.948 |
51 |
15,040 |
81 |
|
| 5/07/07 |
5/21/07 |
14 |
|
- cash - |
| |
5/21/07 |
7/09/07 |
49 |
|
|
|
Volvo |
100 |
1,442 |
|
10.425 |
11.131 |
|
0.705 |
7 |
16,057 |
63 |
|
| 7/09/07 |
4/28/08 |
294 |
|
- cash - |
| |
4/28/08 |
6/16/08 |
49 |
|
|
|
Yara International |
100 |
439 |
|
36.556 |
44.145 |
|
7.589 |
21 |
19,389 |
308 |
|
| 6/16/08 |
5/04/09 |
322 |
|
- cash - |
| |
5/04/09 |
2/01/10 |
273 |
|
|
|
DNB |
100 |
3,834 |
|
5.056 |
6.738 |
|
1.682 |
33 |
25,836 |
47 |
|
| 2/01/10 |
3/08/10 |
35 |
|
- cash - |
| |
3/08/10 |
5/24/10 |
77 |
|
|
|
Coloplast |
100 |
1,672 |
|
15.447 |
14.328 |
|
-1.119 |
-7 |
23,965 |
-30 |
|
| 5/24/10 |
7/26/10 |
63 |
|
- cash - |
| |
7/26/10 |
2/21/11 |
210 |
|
|
|
Novo Nordisk |
100 |
4,330 |
|
5.535 |
7.618 |
|
2.083 |
38 |
32,985 |
74 |
|
| 2/21/11 |
10/24/11 |
245 |
|
- cash - |
| |
10/24/11 |
11/21/11 |
28 |
|
|
|
Equinor |
100 |
2,074 |
|
15.904 |
15.396 |
|
-0.508 |
-3 |
31,932 |
-35 |
|
| 11/21/11 |
11/28/11 |
7 |
|
- cash - |
| |
11/28/11 |
4/16/12 |
140 |
|
|
|
Equinor |
100 |
2,040 |
|
15.652 |
16.084 |
|
0.432 |
3 |
32,812 |
7 |
|
| 4/16/12 |
8/06/12 |
112 |
|
- cash - |
| |
8/06/12 |
6/03/13 |
301 |
|
|
|
Pandora |
100 |
3,997 |
|
8.209 |
22.461 |
|
14.252 |
174 |
89,777 |
239 |
|
| 6/03/13 |
8/19/13 |
77 |
|
- cash - |
| |
8/19/13 |
2/03/14 |
168 |
|
|
|
Pandora |
100 |
3,818 |
|
23.508 |
34.820 |
|
11.312 |
48 |
132,966 |
135 |
|
| 2/03/14 |
4/28/14 |
84 |
|
- cash - |
| |
4/28/14 |
5/19/14 |
21 |
|
|
|
Pandora |
100 |
3,488 |
|
38.115 |
42.270 |
|
4.154 |
11 |
147,456 |
504 |
|
| 5/19/14 |
5/26/14 |
7 |
|
- cash - |
| |
5/26/14 |
9/01/14 |
98 |
|
|
|
Pandora |
100 |
3,364 |
|
43.822 |
45.613 |
|
1.791 |
4 |
153,481 |
16 |
|
| 9/01/14 |
11/03/14 |
63 |
|
- cash - |
| |
11/03/14 |
12/15/14 |
42 |
|
|
|
Pandora |
100 |
2,944 |
|
52.123 |
53.881 |
|
1.758 |
3 |
158,656 |
33 |
|
| 12/15/14 |
1/05/15 |
21 |
|
- cash - |
| |
1/05/15 |
5/11/15 |
126 |
|
|
|
Pandora |
100 |
2,979 |
|
53.249 |
67.605 |
|
14.356 |
27 |
201,422 |
100 |
|
| 5/11/15 |
5/02/16 |
357 |
|
- cash - |
| |
5/02/16 |
5/16/16 |
14 |
|
|
|
Equinor |
100 |
16,950 |
|
11.883 |
11.503 |
|
-0.379 |
-3 |
194,990 |
-57 |
|
| 5/16/16 |
9/05/16 |
112 |
|
- cash - |
| |
9/05/16 |
10/17/16 |
42 |
|
|
|
Atlas Copco A |
100 |
11,808 |
|
16.513 |
18.260 |
|
1.747 |
11 |
215,621 |
140 |
|
| 10/17/16 |
1/23/17 |
98 |
|
- cash - |
| |
1/23/17 |
7/24/17 |
182 |
|
|
|
UPM-Kymmene |
100 |
10,506 |
|
20.523 |
22.700 |
|
2.177 |
11 |
238,493 |
22 |
|
| 7/24/17 |
9/17/18 |
420 |
|
- cash - |
| |
9/17/18 |
10/15/18 |
28 |
|
|
|
Ericsson |
100 |
36,322 |
|
6.566 |
6.273 |
|
-0.293 |
-4 |
227,856 |
-45 |
|
| 10/15/18 |
2/11/19 |
119 |
|
- cash - |
| |
2/11/19 |
5/27/19 |
105 |
|
|
|
Vestas Wind Systems |
100 |
17,540 |
|
12.990 |
13.098 |
|
0.107 |
1 |
229,736 |
3 |
|
| 5/27/19 |
10/28/19 |
154 |
|
- cash - |
| |
10/28/19 |
3/02/20 |
126 |
|
|
|
Hennes & Mauritz |
100 |
13,824 |
|
16.618 |
14.355 |
|
-2.264 |
-14 |
198,444 |
-35 |
|
| 3/02/20 |
6/08/20 |
98 |
|
- cash - |
| |
6/08/20 |
11/02/20 |
147 |
|
|
|
Pandora |
100 |
4,690 |
|
42.312 |
61.833 |
|
19.521 |
46 |
289,995 |
156 |
|
| 11/02/20 |
11/09/20 |
7 |
|
- cash - |
| |
11/09/20 |
9/20/21 |
315 |
|
|
|
Pandora |
100 |
4,161 |
|
69.690 |
93.526 |
|
23.836 |
34 |
389,177 |
41 |
|
| 9/20/21 |
5/30/22 |
252 |
|
- cash - |
| |
5/30/22 |
6/06/22 |
7 |
|
|
|
Equinor |
100 |
13,151 |
|
29.592 |
29.448 |
|
-0.144 |
0 |
387,285 |
-22 |
|
| 6/06/22 |
8/01/22 |
56 |
|
- cash - |
| |
8/01/22 |
8/22/22 |
21 |
|
|
|
Equinor |
100 |
12,753 |
|
30.368 |
33.325 |
|
2.956 |
10 |
424,988 |
403 |
|
| 8/22/22 |
9/12/22 |
21 |
|
- cash - |
| |
9/12/22 |
9/19/22 |
7 |
|
|
|
Equinor |
100 |
13,594 |
|
31.261 |
30.265 |
|
-0.996 |
-3 |
411,448 |
-82 |
|
| L/S | date buy | date sell | days | | instrument | spl | pieces | | prc buy | prc sell | | prc diff | d % | asset | yield | |
| 9/19/22 |
12/05/22 |
77 |
|
- cash - |
| |
12/05/22 |
3/27/23 |
112 |
|
|
|
Genmab |
100 |
1,087 |
|
378.314 |
307.076 |
|
-71.238 |
-19 |
334,012 |
-49 |
|
| 3/27/23 |
1/01/24 |
280 |
|
- cash - |
| |
1/01/24 |
6/03/24 |
154 |
|
|
|
Novo Nordisk |
100 |
4,101 |
|
81.435 |
105.470 |
|
24.035 |
30 |
432,579 |
85 |
|
| 6/03/24 |
6/23/26 |
750 |
|
- cash - |
| accum | 8/28/06 |
6/03/24 | 3094 |
days out of 7477 invested (41%) |
4,226 |
432,579 |
56 |
|
Instrument Related Contribution
| instrument | L/S | date buy | date sell | days | prc buy | prc sell | | prc diff | d % | | | total |
| Pandora | long | 8/06/12 | 6/03/13 | 301 | 8.21 | 22.46 | | 14.25 | 173.61 | | | |
| | | 8/19/13 | 2/03/14 | 168 | 23.51 | 34.82 | | 11.31 | 48.12 | | | |
| | | 4/28/14 | 5/19/14 | 21 | 38.12 | 42.27 | | 4.15 | 10.90 | | | |
| | | 5/26/14 | 9/01/14 | 98 | 43.82 | 45.61 | | 1.79 | 4.09 | | | |
| | | 11/03/14 | 12/15/14 | 42 | 52.12 | 53.88 | | 1.76 | 3.37 | | | |
| | | 1/05/15 | 5/11/15 | 126 | 53.25 | 67.60 | | 14.36 | 26.96 | | | |
| | | 6/08/20 | 11/02/20 | 147 | 42.31 | 61.83 | | 19.52 | 46.13 | | | |
| | | 11/09/20 | 9/20/21 | 315 | 69.69 | 93.53 | | 23.84 | 34.20 | | | 1,104.08 |
| Novo Nordisk | | 7/26/10 | 2/21/11 | 210 | 5.53 | 7.62 | | 2.08 | 37.64 | | | |
| | | 1/01/24 | 6/03/24 | 154 | 81.44 | 105.47 | | 24.03 | 29.51 | | | 78.26 |
| Carlsberg A | | 8/28/06 | 5/07/07 | 252 | 37.46 | 56.41 | | 18.95 | 50.58 | | | 50.58 |
| DNB | | 5/04/09 | 2/01/10 | 273 | 5.06 | 6.74 | | 1.68 | 33.26 | | | 33.26 |
| Yara International | | 4/28/08 | 6/16/08 | 49 | 36.56 | 44.15 | | 7.59 | 20.76 | | | 20.76 |
| UPM-Kymmene | | 1/23/17 | 7/24/17 | 182 | 20.52 | 22.70 | | 2.18 | 10.61 | | | 10.61 |
| Atlas Copco A | | 9/05/16 | 10/17/16 | 42 | 16.51 | 18.26 | | 1.75 | 10.58 | | | 10.58 |
| Volvo | | 5/21/07 | 7/09/07 | 49 | 10.43 | 11.13 | | 0.71 | 6.77 | | | 6.77 |
| Equinor | | 10/24/11 | 11/21/11 | 28 | 15.90 | 15.40 | | -0.51 | -3.19 | | | |
| | | 11/28/11 | 4/16/12 | 140 | 15.65 | 16.08 | | 0.43 | 2.76 | | | |
| | | 5/02/16 | 5/16/16 | 14 | 11.88 | 11.50 | | -0.38 | -3.19 | | | |
| | | 5/30/22 | 6/06/22 | 7 | 29.59 | 29.45 | | -0.14 | -0.49 | | | |
| | | 8/01/22 | 8/22/22 | 21 | 30.37 | 33.32 | | 2.96 | 9.74 | | | |
| | | 9/12/22 | 9/19/22 | 7 | 31.26 | 30.26 | | -1.00 | -3.19 | | | 1.81 |
| Vestas Wind Systems | | 2/11/19 | 5/27/19 | 105 | 12.99 | 13.10 | | 0.11 | 0.83 | | | 0.83 |
| Ericsson | | 9/17/18 | 10/15/18 | 28 | 6.57 | 6.27 | | -0.29 | -4.46 | | | -4.46 |
| Coloplast | | 3/08/10 | 5/24/10 | 77 | 15.45 | 14.33 | | -1.12 | -7.24 | | | -7.24 |
| instrument | L/S | date buy | date sell | days | prc buy | prc sell | | prc diff | d % | | | total |
| Hennes & Mauritz | | 10/28/19 | 3/02/20 | 126 | 16.62 | 14.35 | | -2.26 | -13.62 | | | -13.62 |
| Genmab | | 12/05/22 | 3/27/23 | 112 | 378.31 | 307.08 | | -71.24 | -18.83 | | | -18.83 |
Annotations
| 9/13/23 | Novo Nordisk | | | stock split 1:2 (two for one) |
| 5/13/22 | Atlas Copco A | | | splits 1:4 (four for one) |
| 5/19/21 | Hexagon | | | stock split 1:7 (seven for one) |
| | Investor | | | stock split 1:4 (four for one) |
| 4/03/19 | Neste Oil | | | stock split 1:3 (three for one) |
| 6/19/18 | Atlas Copco A | | | spin-off Epiroc |
| 5/16/18 | Statoil | | | is now called Equinor |
| 9/19/16 | Nordic 30 | | | Vestas Wind Systems replaces Yara |
| 9/05/15 | Nordic 30 | | | Pandora replaces Seadrill (market adjustment to index) |
| 6/03/15 | Assa Abloy | | | ex split 1:3 (three for one) |
| 5/19/15 | Svenska Handelsbank | | | ex Split 1:3 (three for one) |
| 9/22/14 | Nordic 30 | | | Coloplast replaces Swedish Match. |
|
|