| | Sonntag, 8. November 2026, 16:19UTC |
| | |

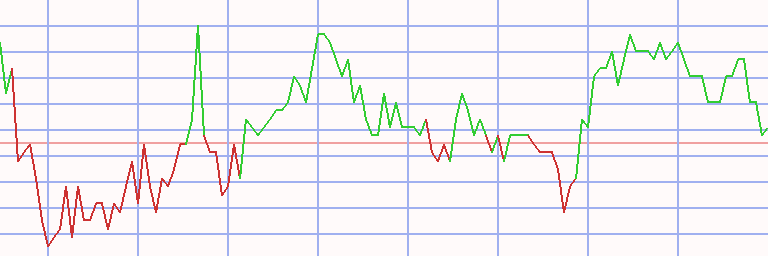
Auswertung - STOXX Nordic 30 in Yen - 1.07.24 - RS = 15
⇐
| |
|
⇓Wertpapier |
jüngster |
⇓ ΔTag |
1.07.24 |
⇓ ΔWo |
18.03.24 |
K-Diff |
⇓ Δ15 |
|
∅-RS |
| |  |
 |
 |
|
|
 |
Stoxx Nordic 30 |
2.348.964,640 |
12.08.24 |
-0,46 |
2.448.426,101 |
-4,06 |
2.275.027,490 |
173.398,611 |
7,62 |
|
16,86 |
| | |
|
|
|
|
|
Novo Nordisk |
20.750,704 |
12.08.24 |
-2,80 |
23.346,575 |
-11,12 |
19.869,846 |
3.476,729 |
17,50 |
|
51,02 |
| | |
|
|
|
|
|
EQT |
4.810,692 |
12.08.24 |
-0,13 |
4.781,822 |
0,60 |
4.766,672 |
15,150 |
0,32 |
|
34,25 |
| | |
|
|
|
L |
|
Atlas Copco A |
2.691,769 |
12.08.24 |
0,28 |
3.020,738 |
-10,89 |
2.597,408 |
423,330 |
16,30 |
|
31,80 |
| | |
|
|
|
L |
|
Investor |
4.345,730 |
12.08.24 |
0,30 |
4.407,269 |
-1,40 |
3.755,538 |
651,731 |
17,35 |
|
35,67 |
| | |
|
|
|
|
|
Novonesis |
9.974,468 |
12.08.24 |
0,12 |
9.816,438 |
1,61 |
8.843,842 |
972,596 |
11,00 |
|
30,20 |
| | |
|
|
|
|
|
S.E.B |
2.289,865 |
12.08.24 |
-0,10 |
2.397,749 |
-4,50 |
2.192,812 |
204,937 |
9,35 |
|
26,12 |
| | |
|
|
|
|
|
Assa Abloy |
4.648,107 |
12.08.24 |
0,13 |
4.563,016 |
1,86 |
4.291,432 |
271,584 |
6,33 |
|
20,67 |
| | |
|
|
|
L |
|
Ericsson |
1.080,051 |
12.08.24 |
1,14 |
1.019,575 |
5,93 |
801,201 |
218,375 |
27,26 |
|
29,62 |
| | |
|
|
|
L |
|
Kone |
8.102,149 |
12.08.24 |
-0,32 |
8.006,830 |
1,19 |
6.926,188 |
1.080,642 |
15,60 |
|
13,90 |
| | |
|
|
|
|
|
Volvo |
3.885,325 |
12.08.24 |
-0,12 |
4.154,274 |
-6,47 |
4.363,503 |
-209,228 |
-4,79 |
|
19,93 |
| | |
|
|
|
L |
|
Essity B |
4.514,393 |
12.08.24 |
-0,97 |
4.192,262 |
7,68 |
3.536,471 |
655,791 |
18,54 |
|
17,34 |
| | |
|
|
|
|
|
Coloplast |
20.553,167 |
12.08.24 |
0,25 |
19.344,704 |
6,25 |
20.226,295 |
-881,591 |
-4,36 |
|
10,25 |
| | |
|
|
|
|
|
Swedbank |
3.146,855 |
12.08.24 |
-0,86 |
3.382,376 |
-6,96 |
3.211,081 |
171,294 |
5,33 |
|
19,50 |
| | |
|
|
|
|
|
Nordea Bank |
1.820,344 |
12.08.24 |
-0,13 |
1.977,611 |
-7,95 |
1.772,802 |
204,808 |
11,55 |
|
15,65 |
| | |
|
|
|
|
|
Hexagon |
1.530,122 |
12.08.24 |
-0,15 |
1.829,461 |
-16,36 |
1.776,085 |
53,376 |
3,01 |
|
18,48 |
| | |
|
|
|
|
|
UPM-Kymmene |
5.152,447 |
12.08.24 |
0,17 |
5.693,168 |
-9,50 |
4.731,977 |
961,191 |
20,31 |
|
12,35 |
| | |
|
|
|
L |
|
Nokia |
609,611 |
12.08.24 |
1,05 |
635,954 |
-4,14 |
522,948 |
113,005 |
21,61 |
|
17,25 |
| | |
|
|
|
L |
|
Carlsberg B |
18.628,922 |
12.08.24 |
|
19.614,284 |
-5,02 |
19.982,866 |
-368,582 |
-1,84 |
|
-1,78 |
| | |
|
|
|
|
|
Sandvik |
3.078,478 |
12.08.24 |
-0,54 |
3.266,895 |
-5,77 |
3.430,862 |
-163,967 |
-4,78 |
|
9,46 |
| | |
|
|
|
S |
|
DNB |
3.249,941 |
12.08.24 |
0,14 |
3.212,099 |
1,18 |
2.953,151 |
258,947 |
8,77 |
|
10,23 |
| | |
|
|
|
|
|
Vestas Wind Systems |
3.538,240 |
12.08.24 |
-7,76 |
3.767,151 |
-6,08 |
4.159,149 |
-391,998 |
-9,42 |
|
-1,45 |
| | |
|
|
|
S |
|
Svenska Handelsbank |
1.552,155 |
12.08.24 |
0,29 |
1.546,837 |
0,34 |
1.717,572 |
-170,735 |
-9,94 |
|
9,32 |
| | |
|
|
|
|
|
Sampo |
7.017,241 |
12.08.24 |
0,40 |
6.963,515 |
0,77 |
6.582,633 |
380,882 |
5,79 |
|
9,30 |
| | |
|
|
|
L |
|
Ørsted |
9.702,563 |
12.08.24 |
0,63 |
8.738,117 |
11,04 |
7.709,292 |
1.028,825 |
13,35 |
|
2,01 |
| |
|
⇓Wertpapier |
jüngster |
⇓ ΔTag |
1.07.24 |
⇓ ΔWo |
18.03.24 |
K-Diff |
⇓ Δ15 |
|
∅-RS |
| | |
|
|
|
|
|
Equinor |
4.601,687 |
12.08.24 |
3,19 |
4.624,393 |
-0,49 |
3.921,214 |
703,178 |
17,93 |
|
5,35 |
| | |
|
|
|
L |
|
DSV |
28.247,822 |
12.08.24 |
|
26.574,566 |
6,30 |
22.593,202 |
3.981,364 |
17,62 |
|
4,96 |
| | |
|
|
|
S |
|
Evolution |
15.158,391 |
12.08.24 |
-0,88 |
16.797,917 |
-9,76 |
19.489,124 |
-2.691,207 |
-13,81 |
|
0,38 |
| | |
|
|
|
|
|
Genmab |
42.319,444 |
12.08.24 |
0,89 |
40.309,213 |
4,99 |
44.403,955 |
-4.094,742 |
-9,22 |
|
-14,67 |
| | |
|
|
|
|
|
NIBE Industrier |
677,387 |
12.08.24 |
0,18 |
686,048 |
-1,26 |
784,931 |
-98,883 |
-12,60 |
|
-24,42 |
| | |
|
|
|
S |
|
Neste |
3.155,072 |
12.08.24 |
-1,54 |
2.921,973 |
7,98 |
4.035,145 |
-1.113,172 |
-27,59 |
|
-36,93 |
| Nordic 30 - 30 von 30 Wertpapieren bewertet - 1.07.24 / 18.03.24 - 20 davon sind besser, Markt-Kennzahl(15) in JPY = 66,67 % |
Technischer Chart
Transaktionen STOXX Nordic 30 in Yen * S15 - 44 ex 19 (1)
|
⇐ |
| |
| L/S | K-Datum | V-Datum | Tage | | Wertpapier | Spl | Stück | | K-Kurs | V-Kurs | S-V-Kurs | K-Diff | D % | Kapital | Rdte | |
| 2.01.06 |
5.06.06 |
154 |
|
- cash - |
| short |
5.06.06 |
28.08.06 |
84 |
|
|
|
Ericsson |
100 |
5 |
|
1.722,281 |
1.942,531 |
1.502,031 |
-220,250 |
-13 |
8.899 |
-45 |
|
| 28.08.06 |
23.07.07 |
329 |
|
- cash - |
| |
23.07.07 |
1.10.07 |
70 |
|
|
|
Essity B |
100 |
5 |
|
1.702,973 |
1.700,234 |
1.705,716 |
2,743 |
0 |
8.912 |
1 |
|
| 1.10.07 |
15.10.07 |
14 |
|
- cash - |
| |
15.10.07 |
7.04.08 |
175 |
|
|
|
Essity B |
100 |
5 |
|
1.684,262 |
1.583,948 |
1.790,930 |
106,668 |
6 |
9.446 |
14 |
|
| |
7.04.08 |
28.04.08 |
21 |
|
|
|
Ericsson |
100 |
9 |
|
1.020,005 |
1.269,527 |
770,483 |
-249,522 |
-24 |
7.200 |
-99 |
|
| 28.04.08 |
9.06.08 |
42 |
|
- cash - |
| |
9.06.08 |
6.10.08 |
119 |
|
|
|
NIBE Industrier |
100 |
143 |
|
50,235 |
37,845 |
66,679 |
16,445 |
33 |
9.552 |
138 |
|
| |
6.10.08 |
2.02.09 |
119 |
|
|
|
DNB |
100 |
17 |
|
541,786 |
344,782 |
851,357 |
309,571 |
57 |
14.814 |
300 |
|
| 2.02.09 |
16.02.09 |
14 |
|
- cash - |
| |
16.02.09 |
16.03.09 |
28 |
|
|
|
Swedbank |
100 |
50 |
|
292,992 |
304,428 |
281,556 |
-11,436 |
-4 |
14.243 |
-40 |
|
| 16.03.09 |
23.03.09 |
7 |
|
- cash - |
| |
23.03.09 |
30.03.09 |
7 |
|
|
|
S.E.B |
100 |
44 |
|
317,278 |
386,447 |
248,109 |
-69,169 |
-22 |
11.199 |
-100 |
|
| 30.03.09 |
8.02.10 |
315 |
|
- cash - |
| |
8.02.10 |
15.02.10 |
7 |
|
|
|
Genmab |
100 |
7 |
|
1.488,628 |
1.558,663 |
1.418,594 |
-70,035 |
-5 |
10.709 |
-92 |
|
| 15.02.10 |
23.05.11 |
462 |
|
- cash - |
| |
23.05.11 |
27.06.11 |
35 |
|
|
|
Vestas Wind Systems |
100 |
21 |
|
495,193 |
344,898 |
710,982 |
215,789 |
44 |
15.240 |
4.247 |
|
| 27.06.11 |
4.07.11 |
7 |
|
- cash - |
| |
4.07.11 |
28.11.11 |
147 |
|
|
|
Nokia |
100 |
29 |
|
510,777 |
427,243 |
610,644 |
99,867 |
20 |
18.137 |
56 |
|
| 28.11.11 |
14.05.12 |
168 |
|
- cash - |
| |
14.05.12 |
23.07.12 |
70 |
|
|
|
Vestas Wind Systems |
100 |
154 |
|
117,014 |
64,649 |
211,796 |
94,781 |
81 |
32.733 |
2.106 |
|
| 23.07.12 |
17.06.13 |
329 |
|
- cash - |
| |
17.06.13 |
8.07.13 |
21 |
|
|
|
Equinor |
100 |
15 |
|
2.104,977 |
2.070,215 |
2.140,323 |
35,346 |
2 |
33.263 |
34 |
|
| 8.07.13 |
2.09.13 |
56 |
|
- cash - |
| |
2.09.13 |
9.09.13 |
7 |
|
|
|
Sandvik |
100 |
24 |
|
1.372,688 |
1.362,904 |
1.382,542 |
9,854 |
1 |
33.500 |
45 |
|
| 9.09.13 |
15.09.14 |
371 |
|
- cash - |
| |
15.09.14 |
22.09.14 |
7 |
|
|
|
Volvo |
100 |
27 |
|
1.219,239 |
1.235,858 |
1.202,620 |
-16,619 |
-1 |
33.051 |
-51 |
|
| 22.09.14 |
13.10.14 |
21 |
|
- cash - |
| |
13.10.14 |
27.10.14 |
14 |
|
|
|
Volvo |
100 |
29 |
|
1.107,424 |
1.214,143 |
1.000,705 |
-106,719 |
-10 |
29.956 |
-93 |
|
| 27.10.14 |
15.06.15 |
231 |
|
- cash - |
| |
15.06.15 |
22.06.15 |
7 |
|
|
|
Equinor |
100 |
13 |
|
2.244,973 |
2.273,810 |
2.216,137 |
-28,836 |
-1 |
29.581 |
-49 |
|
| 22.06.15 |
29.06.15 |
7 |
|
- cash - |
| |
29.06.15 |
13.07.15 |
14 |
|
|
|
Coloplast |
100 |
3 |
|
8.185,913 |
8.468,270 |
7.903,557 |
-282,356 |
-3 |
28.734 |
-60 |
|
| 13.07.15 |
27.07.15 |
14 |
|
- cash - |
| |
27.07.15 |
3.08.15 |
7 |
|
|
|
Equinor |
100 |
14 |
|
1.968,987 |
2.043,829 |
1.894,146 |
-74,842 |
-4 |
27.686 |
-87 |
|
| 3.08.15 |
10.08.15 |
7 |
|
- cash - |
| |
10.08.15 |
17.08.15 |
7 |
|
|
|
Equinor |
100 |
13 |
|
2.075,676 |
1.993,040 |
2.161,737 |
86,062 |
4 |
28.805 |
732 |
|
| 17.08.15 |
24.08.15 |
7 |
|
- cash - |
| |
24.08.15 |
19.10.15 |
56 |
|
|
|
Equinor |
100 |
17 |
|
1.661,417 |
2.068,286 |
1.254,547 |
-406,870 |
-24 |
21.888 |
-84 |
|
| 19.10.15 |
26.10.15 |
7 |
|
- cash - |
| |
26.10.15 |
9.11.15 |
14 |
|
|
|
DNB |
100 |
13 |
|
1.592,840 |
1.628,708 |
1.556,973 |
-35,867 |
-2 |
21.422 |
-45 |
|
| 9.11.15 |
16.11.15 |
7 |
|
- cash - |
| |
16.11.15 |
23.11.15 |
7 |
|
|
|
Ericsson |
100 |
18 |
|
1.158,642 |
1.166,183 |
1.151,100 |
-7,542 |
-1 |
21.286 |
-29 |
|
| 23.11.15 |
18.01.16 |
56 |
|
- cash - |
| |
18.01.16 |
25.01.16 |
7 |
|
|
|
Equinor |
100 |
15 |
|
1.352,567 |
1.439,722 |
1.265,413 |
-87,155 |
-6 |
19.979 |
-97 |
|
| 25.01.16 |
8.02.16 |
14 |
|
- cash - |
| |
8.02.16 |
28.03.16 |
49 |
|
|
|
Atlas Copco A |
100 |
43 |
|
458,037 |
510,566 |
405,508 |
-52,529 |
-11 |
17.720 |
-60 |
|
| L/S | K-Datum | V-Datum | Tage | | Wertpapier | Spl | Stück | | K-Kurs | V-Kurs | S-V-Kurs | K-Diff | D % | Kapital | Rdte | |
| 28.03.16 |
4.04.16 |
7 |
|
- cash - |
| |
4.04.16 |
25.04.16 |
21 |
|
|
|
Nordea Bank |
100 |
16 |
|
1.054,030 |
1.084,505 |
1.023,555 |
-30,475 |
-3 |
17.233 |
-40 |
|
| 25.04.16 |
27.06.16 |
63 |
|
- cash - |
| |
27.06.16 |
4.07.16 |
7 |
|
|
|
Nordea Bank |
100 |
21 |
|
810,792 |
852,706 |
768,878 |
-41,914 |
-5 |
16.352 |
-94 |
|
| 4.07.16 |
21.08.17 |
413 |
|
- cash - |
| |
21.08.17 |
4.09.17 |
14 |
|
|
|
Ericsson |
100 |
25 |
|
651,738 |
637,607 |
666,182 |
14,444 |
2 |
16.714 |
77 |
|
| 4.09.17 |
5.02.18 |
154 |
|
- cash - |
| |
5.02.18 |
26.02.18 |
21 |
|
|
|
Vestas Wind Systems |
100 |
11 |
|
1.469,867 |
1.585,111 |
1.354,623 |
-115,244 |
-8 |
15.446 |
-76 |
|
| 26.02.18 |
5.03.18 |
7 |
|
- cash - |
| |
5.03.18 |
12.03.18 |
7 |
|
|
|
Vestas Wind Systems |
100 |
10 |
|
1.516,333 |
1.525,535 |
1.507,132 |
-9,201 |
-1 |
15.354 |
-27 |
|
| 12.03.18 |
26.03.18 |
14 |
|
- cash - |
| |
26.03.18 |
16.04.18 |
21 |
|
|
|
Svenska Handelsbank |
100 |
11 |
|
1.281,481 |
1.261,779 |
1.301,490 |
20,009 |
2 |
15.574 |
31 |
|
| 16.04.18 |
30.04.18 |
14 |
|
- cash - |
| |
30.04.18 |
14.05.18 |
14 |
|
|
|
Vestas Wind Systems |
100 |
10 |
|
1.418,191 |
1.537,006 |
1.299,377 |
-118,814 |
-8 |
14.386 |
-90 |
|
| 14.05.18 |
22.10.18 |
161 |
|
- cash - |
| |
22.10.18 |
28.01.19 |
98 |
|
|
|
Atlas Copco A |
100 |
21 |
|
670,333 |
706,566 |
634,099 |
-36,233 |
-5 |
13.625 |
-19 |
|
| 28.01.19 |
5.08.19 |
189 |
|
- cash - |
| |
5.08.19 |
26.08.19 |
21 |
|
|
|
Swedbank |
100 |
9 |
|
1.405,186 |
1.358,601 |
1.453,369 |
48,183 |
3 |
14.059 |
80 |
|
| 26.08.19 |
9.03.20 |
196 |
|
- cash - |
| |
9.03.20 |
8.06.20 |
91 |
|
|
|
Equinor |
100 |
11 |
|
1.213,447 |
1.825,478 |
601,416 |
-612,031 |
-50 |
7.326 |
-94 |
|
| 8.06.20 |
2.11.20 |
147 |
|
- cash - |
| |
2.11.20 |
9.11.20 |
7 |
|
|
|
Nokia |
100 |
21 |
|
343,908 |
385,141 |
302,676 |
-41,233 |
-12 |
6.460 |
-100 |
|
| 9.11.20 |
29.11.21 |
385 |
|
- cash - |
| |
29.11.21 |
13.12.21 |
14 |
|
|
|
Neste |
100 |
1 |
|
5.509,176 |
5.440,060 |
5.579,171 |
69,994 |
1 |
6.530 |
39 |
|
| 13.12.21 |
20.12.21 |
7 |
|
- cash - |
| |
20.12.21 |
27.12.21 |
7 |
|
|
|
Vestas Wind Systems |
100 |
1 |
|
3.275,146 |
3.465,497 |
3.084,795 |
-190,351 |
-6 |
6.340 |
-96 |
|
| 27.12.21 |
24.01.22 |
28 |
|
- cash - |
| |
24.01.22 |
28.02.22 |
35 |
|
|
|
Vestas Wind Systems |
100 |
2 |
|
3.011,934 |
3.772,040 |
2.251,828 |
-760,106 |
-25 |
4.820 |
-95 |
|
| |
28.02.22 |
30.05.22 |
91 |
|
|
|
Neste |
100 |
1 |
|
4.537,516 |
5.972,103 |
3.102,930 |
-1.434,586 |
-32 |
3.385 |
-78 |
|
| |
30.05.22 |
15.08.22 |
77 |
|
|
|
EQT |
100 |
0 |
|
3.816,587 |
3.500,726 |
4.160,947 |
344,360 |
9 |
3.385 |
0 |
|
| 15.08.22 |
5.09.22 |
21 |
|
- cash - |
| |
5.09.22 |
3.10.22 |
28 |
|
|
|
EQT |
100 |
1 |
|
3.072,410 |
2.870,737 |
3.288,251 |
215,841 |
7 |
3.601 |
142 |
|
| 3.10.22 |
10.10.22 |
7 |
|
- cash - |
| |
10.10.22 |
17.10.22 |
7 |
|
|
|
EQT |
100 |
1 |
|
2.702,085 |
2.843,107 |
2.561,063 |
-141,022 |
-5 |
3.460 |
-94 |
|
| 17.10.22 |
20.03.23 |
154 |
|
- cash - |
| |
20.03.23 |
3.04.23 |
14 |
|
|
|
Ericsson |
100 |
4 |
|
709,958 |
768,985 |
650,931 |
-59,027 |
-8 |
3.224 |
-90 |
|
| 3.04.23 |
1.05.23 |
28 |
|
- cash - |
| |
1.05.23 |
8.05.23 |
7 |
|
|
|
Ericsson |
100 |
4 |
|
750,471 |
738,318 |
762,823 |
12,352 |
2 |
3.273 |
134 |
|
| 8.05.23 |
22.05.23 |
14 |
|
- cash - |
| |
22.05.23 |
26.06.23 |
35 |
|
|
|
Neste |
100 |
0 |
|
5.592,789 |
5.445,780 |
5.743,767 |
150,978 |
3 |
3.273 |
0 |
|
| 26.06.23 |
17.07.23 |
21 |
|
- cash - |
| |
17.07.23 |
24.07.23 |
7 |
|
|
|
Nokia |
100 |
6 |
|
538,165 |
561,503 |
514,827 |
-23,338 |
-4 |
3.133 |
-90 |
|
| 24.07.23 |
31.07.23 |
7 |
|
- cash - |
| |
31.07.23 |
20.11.23 |
112 |
|
|
|
Neste |
100 |
0 |
|
5.232,609 |
5.633,945 |
4.831,272 |
-401,336 |
-8 |
3.133 |
0 |
|
| 20.11.23 |
27.11.23 |
7 |
|
- cash - |
| |
27.11.23 |
4.12.23 |
7 |
|
|
|
Ørsted |
100 |
0 |
|
6.803,000 |
7.098,633 |
6.507,367 |
-295,633 |
-4 |
3.133 |
0 |
|
| 4.12.23 |
8.11.26 |
1070 |
|
- cash - |
| kum | 5.06.06 |
4.12.23 | 1862 |
Tage von 7615 investiert (24%) |
-69 |
3.133 |
-20 |
|
Anteil der Einzelwerte
| Wertpapier | L/S | K-Datum | V-Datum | Tage | K-Kurs | V-Kurs | S-V-Kurs | K-Diff | D % | | | Summe |
| DNB | short | 6.10.08 | 2.02.09 | 119 | 541,79 | 344,78 | 851,36 | 309,57 | 57,14 | | | |
| | | 26.10.15 | 9.11.15 | 14 | 1.592,84 | 1.628,71 | 1.556,97 | -35,87 | -2,25 | | | 53,60 |
| Vestas Wind Systems | | 23.05.11 | 27.06.11 | 35 | 495,19 | 344,90 | 710,98 | 215,79 | 43,58 | | | |
| | | 14.05.12 | 23.07.12 | 70 | 117,01 | 64,65 | 211,80 | 94,78 | 81,00 | | | |
| | | 5.02.18 | 26.02.18 | 21 | 1.469,87 | 1.585,11 | 1.354,62 | -115,24 | -7,84 | | | |
| | | 5.03.18 | 12.03.18 | 7 | 1.516,33 | 1.525,53 | 1.507,13 | -9,20 | -0,61 | | | |
| | | 30.04.18 | 14.05.18 | 14 | 1.418,19 | 1.537,01 | 1.299,38 | -118,81 | -8,38 | | | |
| | | 20.12.21 | 27.12.21 | 7 | 3.275,15 | 3.465,50 | 3.084,79 | -190,35 | -5,81 | | | |
| | | 24.01.22 | 28.02.22 | 35 | 3.011,93 | 3.772,04 | 2.251,83 | -760,11 | -25,24 | | | 53,58 |
| NIBE Industrier | | 9.06.08 | 6.10.08 | 119 | 50,23 | 37,85 | 66,68 | 16,44 | 32,74 | | | 32,74 |
| EQT | | 30.05.22 | 15.08.22 | 77 | 3.816,59 | 3.500,73 | 4.160,95 | 344,36 | 9,02 | | | |
| | | 5.09.22 | 3.10.22 | 28 | 3.072,41 | 2.870,74 | 3.288,25 | 215,84 | 7,03 | | | |
| | | 10.10.22 | 17.10.22 | 7 | 2.702,08 | 2.843,11 | 2.561,06 | -141,02 | -5,22 | | | 10,59 |
| Essity B | | 23.07.07 | 1.10.07 | 70 | 1.702,97 | 1.700,23 | 1.705,72 | 2,74 | 0,16 | | | |
| | | 15.10.07 | 7.04.08 | 175 | 1.684,26 | 1.583,95 | 1.790,93 | 106,67 | 6,33 | | | 6,50 |
| Svenska Handelsbank | | 26.03.18 | 16.04.18 | 21 | 1.281,48 | 1.261,78 | 1.301,49 | 20,01 | 1,56 | | | 1,56 |
| Sandvik | | 2.09.13 | 9.09.13 | 7 | 1.372,69 | 1.362,90 | 1.382,54 | 9,85 | 0,72 | | | 0,72 |
| Nokia | | 4.07.11 | 28.11.11 | 147 | 510,78 | 427,24 | 610,64 | 99,87 | 19,55 | | | |
| | | 2.11.20 | 9.11.20 | 7 | 343,91 | 385,14 | 302,68 | -41,23 | -11,99 | | | |
| | | 17.07.23 | 24.07.23 | 7 | 538,16 | 561,50 | 514,83 | -23,34 | -4,34 | | | 0,66 |
| Swedbank | | 16.02.09 | 16.03.09 | 28 | 292,99 | 304,43 | 281,56 | -11,44 | -3,90 | | | |
| | | 5.08.19 | 26.08.19 | 21 | 1.405,19 | 1.358,60 | 1.453,37 | 48,18 | 3,43 | | | -0,61 |
| Coloplast | | 29.06.15 | 13.07.15 | 14 | 8.185,91 | 8.468,27 | 7.903,56 | -282,36 | -3,45 | | | -3,45 |
| Ørsted | | 27.11.23 | 4.12.23 | 7 | 6.803,00 | 7.098,63 | 6.507,37 | -295,63 | -4,35 | | | -4,35 |
| Genmab | | 8.02.10 | 15.02.10 | 7 | 1.488,63 | 1.558,66 | 1.418,59 | -70,03 | -4,70 | | | -4,70 |
| Wertpapier | L/S | K-Datum | V-Datum | Tage | K-Kurs | V-Kurs | S-V-Kurs | K-Diff | D % | | | Summe |
| Nordea Bank | | 4.04.16 | 25.04.16 | 21 | 1.054,03 | 1.084,50 | 1.023,56 | -30,47 | -2,89 | | | |
| | | 27.06.16 | 4.07.16 | 7 | 810,79 | 852,71 | 768,88 | -41,91 | -5,17 | | | -7,91 |
| Volvo | | 15.09.14 | 22.09.14 | 7 | 1.219,24 | 1.235,86 | 1.202,62 | -16,62 | -1,36 | | | |
| | | 13.10.14 | 27.10.14 | 14 | 1.107,42 | 1.214,14 | 1.000,70 | -106,72 | -9,64 | | | -10,87 |
| Atlas Copco A | | 8.02.16 | 28.03.16 | 49 | 458,04 | 510,57 | 405,51 | -52,53 | -11,47 | | | |
| | | 22.10.18 | 28.01.19 | 98 | 670,33 | 706,57 | 634,10 | -36,23 | -5,41 | | | -16,25 |
| S.E.B | | 23.03.09 | 30.03.09 | 7 | 317,28 | 386,45 | 248,11 | -69,17 | -21,80 | | | -21,80 |
| Neste | | 29.11.21 | 13.12.21 | 14 | 5.509,18 | 5.440,06 | 5.579,17 | 69,99 | 1,27 | | | |
| | | 28.02.22 | 30.05.22 | 91 | 4.537,52 | 5.972,10 | 3.102,93 | -1.434,59 | -31,62 | | | |
| | | 22.05.23 | 26.06.23 | 35 | 5.592,79 | 5.445,78 | 5.743,77 | 150,98 | 2,70 | | | |
| | | 31.07.23 | 20.11.23 | 112 | 5.232,61 | 5.633,94 | 4.831,27 | -401,34 | -7,67 | | | -34,33 |
| Ericsson | | 5.06.06 | 28.08.06 | 84 | 1.722,28 | 1.942,53 | 1.502,03 | -220,25 | -12,79 | | | |
| | | 7.04.08 | 28.04.08 | 21 | 1.020,00 | 1.269,53 | 770,48 | -249,52 | -24,46 | | | |
| | | 16.11.15 | 23.11.15 | 7 | 1.158,64 | 1.166,18 | 1.151,10 | -7,54 | -0,65 | | | |
| | | 21.08.17 | 4.09.17 | 14 | 651,74 | 637,61 | 666,18 | 14,44 | 2,22 | | | |
| | | 20.03.23 | 3.04.23 | 14 | 709,96 | 768,99 | 650,93 | -59,03 | -8,31 | | | |
| | | 1.05.23 | 8.05.23 | 7 | 750,47 | 738,32 | 762,82 | 12,35 | 1,65 | | | -37,65 |
| Equinor | | 17.06.13 | 8.07.13 | 21 | 2.104,98 | 2.070,21 | 2.140,32 | 35,35 | 1,68 | | | |
| | | 15.06.15 | 22.06.15 | 7 | 2.244,97 | 2.273,81 | 2.216,14 | -28,84 | -1,28 | | | |
| | | 27.07.15 | 3.08.15 | 7 | 1.968,99 | 2.043,83 | 1.894,15 | -74,84 | -3,80 | | | |
| | | 10.08.15 | 17.08.15 | 7 | 2.075,68 | 1.993,04 | 2.161,74 | 86,06 | 4,15 | | | |
| | | 24.08.15 | 19.10.15 | 56 | 1.661,42 | 2.068,29 | 1.254,55 | -406,87 | -24,49 | | | |
| | | 18.01.16 | 25.01.16 | 7 | 1.352,57 | 1.439,72 | 1.265,41 | -87,15 | -6,44 | | | |
| | | 9.03.20 | 8.06.20 | 91 | 1.213,45 | 1.825,48 | 601,42 | -612,03 | -50,44 | | | -64,79 |
Anmerkungen
| 13.09.23 | Novo Nordisk | | | Aktiensplit 1:2 (zwei für eine) |
| 13.05.22 | Atlas Copco A | | | splittet 1:4 (vier für eine) |
| 19.05.21 | Hexagon | | | Aktiensplit 1:7 (sieben für eine) |
| | Investor | | | Aktiensplit 1: 4 (vier für eine) |
| 3.04.19 | Neste Oil | | | Aktien-Split 1:3 (drei für eine) |
| 19.06.18 | Atlas Copco A | | | Abspaltung Epiroc |
| 16.05.18 | Statoil | | | heißt jetzt Equinor |
| 19.09.16 | Nordic 30 | | | Vestas Wind Systems ersetzt Yara |
| 5.09.15 | Nordic 30 | | | Pandora ersetzt Seadrill (Markt-Anpassung an den Index) |
| 3.06.15 | Assa Abloy | | | ex Split 1:3 (drei für eine) |
| 19.05.15 | Svenska Handelsbank | | | ex Split 1:3 (drei für eine) |
| 22.09.14 | Nordic 30 | | | Coloplast ersetzt Swedish Match. |
|
|