| | |
| | |

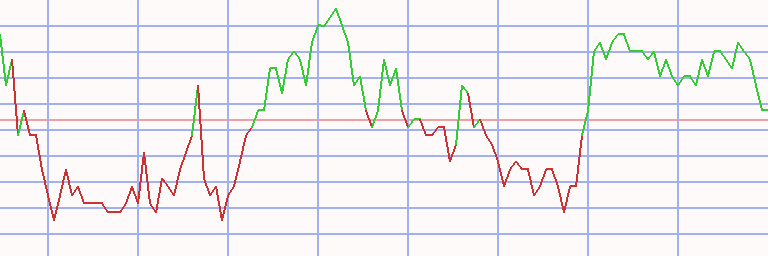
Assessment - OMX Stockholm 30 in Euro - 7/01/24 - RS = 15
⇐
| |
|
⇓instrument |
freshest |
⇓ Δday |
7/01/24 |
⇓ Δwk |
3/18/24 |
prc diff |
⇓ Δ15 |
|
∅-RS |
| |  |
 |
 |
|
|
 |
OMXS30 |
215.761 |
8/12/24 |
0.09 |
226.626 |
-4.79 |
220.588 |
6.038 |
2.74 |
|
12.13 |
| | |
|
|
|
L |
|
SBB |
0.545 |
8/12/24 |
-2.81 |
0.510 |
6.87 |
0.312 |
0.198 |
63.58 |
|
45.10 |
| | |
|
|
|
L |
|
ABB |
48.485 |
8/12/24 |
0.47 |
51.956 |
-6.68 |
43.927 |
8.029 |
18.28 |
|
34.26 |
| | |
|
|
|
L |
|
Atlas Copco A |
15.532 |
8/12/24 |
0.28 |
17.430 |
-10.89 |
16.028 |
1.402 |
8.75 |
|
22.02 |
| | |
|
|
|
L |
|
Investor |
25.075 |
8/12/24 |
0.30 |
25.430 |
-1.40 |
23.175 |
2.256 |
9.73 |
|
25.59 |
| | |
|
|
|
L |
|
Atlas Copco B |
13.629 |
8/12/24 |
|
14.988 |
-9.07 |
14.069 |
0.920 |
6.54 |
|
21.03 |
| | |
|
|
|
L |
|
Tele2 |
9.631 |
8/12/24 |
0.69 |
9.346 |
3.05 |
7.628 |
1.718 |
22.52 |
|
24.22 |
| | |
|
|
|
L |
|
Alfa Laval |
39.235 |
8/12/24 |
0.61 |
41.199 |
-4.77 |
36.944 |
4.255 |
11.52 |
|
19.69 |
| | |
|
|
|
L |
|
Hennes & Mauritz |
13.835 |
8/12/24 |
-0.22 |
14.681 |
-5.76 |
12.837 |
1.845 |
14.37 |
|
3.02 |
| | |
|
|
|
L |
|
AstraZeneca |
151.152 |
8/12/24 |
0.88 |
145.497 |
3.89 |
121.575 |
23.922 |
19.68 |
|
15.54 |
| | |
|
|
|
|
|
S.E.B |
13.213 |
8/12/24 |
-0.10 |
13.835 |
-4.50 |
13.531 |
0.304 |
2.25 |
|
16.86 |
| | |
|
|
|
|
|
Assa Abloy |
26.820 |
8/12/24 |
0.13 |
26.329 |
1.86 |
26.481 |
-0.153 |
-0.58 |
|
11.77 |
| | |
|
|
|
|
|
Boliden |
26.741 |
8/12/24 |
1.33 |
29.810 |
-10.29 |
25.050 |
4.759 |
19.00 |
|
13.12 |
| | |
|
|
|
L |
|
Ericsson |
6.232 |
8/12/24 |
1.14 |
5.883 |
5.93 |
4.944 |
0.939 |
18.99 |
|
20.19 |
| | |
|
|
|
L |
|
Telia Company |
2.710 |
8/12/24 |
0.19 |
2.531 |
7.07 |
2.278 |
0.253 |
11.10 |
|
18.22 |
| | |
|
|
|
|
|
Volvo |
22.419 |
8/12/24 |
-0.12 |
23.970 |
-6.47 |
26.926 |
-2.956 |
-10.98 |
|
11.06 |
| | |
|
|
|
L |
|
Essity B |
26.048 |
8/12/24 |
-0.97 |
24.190 |
7.68 |
21.823 |
2.367 |
10.85 |
|
8.83 |
| | |
|
|
|
|
|
Autoliv |
87.974 |
8/12/24 |
0.10 |
99.932 |
-11.97 |
109.730 |
-9.798 |
-8.93 |
|
3.15 |
| | |
|
|
|
|
|
SKF B |
16.343 |
8/12/24 |
|
18.771 |
-12.94 |
20.431 |
-1.660 |
-8.12 |
|
7.84 |
| | |
|
|
|
|
|
Swedbank |
18.158 |
8/12/24 |
-0.86 |
19.517 |
-6.96 |
19.815 |
-0.298 |
-1.51 |
|
10.77 |
| | |
|
|
|
|
|
Nordea Bank |
10.504 |
8/12/24 |
-0.13 |
11.411 |
-7.95 |
10.940 |
0.471 |
4.31 |
|
7.25 |
| | |
|
|
|
|
|
Hexagon |
8.829 |
8/12/24 |
-0.15 |
10.556 |
-16.36 |
10.960 |
-0.404 |
-3.68 |
|
9.83 |
| | |
|
|
|
|
|
Svenska Cellulosa B |
12.016 |
8/12/24 |
0.81 |
13.682 |
-12.18 |
13.382 |
0.300 |
2.24 |
|
5.49 |
| | |
|
|
|
|
|
Sandvik |
17.763 |
8/12/24 |
-0.54 |
18.850 |
-5.77 |
21.171 |
-2.321 |
-10.96 |
|
1.46 |
| | |
|
|
|
S |
|
Svenska Handelsbank |
8.956 |
8/12/24 |
0.29 |
8.925 |
0.34 |
10.599 |
-1.673 |
-15.79 |
|
1.38 |
| |
|
⇓instrument |
freshest |
⇓ Δday |
7/01/24 |
⇓ Δwk |
3/18/24 |
prc diff |
⇓ Δ15 |
|
∅-RS |
| | |
|
|
|
S |
|
Sinch |
2.275 |
8/12/24 |
-2.15 |
2.336 |
-2.59 |
2.136 |
0.199 |
9.32 |
|
8.49 |
| | |
|
|
|
L |
|
Electrolux |
7.524 |
8/12/24 |
-0.26 |
7.673 |
-1.94 |
7.956 |
-0.283 |
-3.55 |
|
-15.57 |
| | |
|
|
|
S |
|
Evolution |
87.465 |
8/12/24 |
-0.88 |
96.925 |
-9.76 |
120.263 |
-23.338 |
-19.41 |
|
-6.85 |
| | |
|
|
|
S |
|
Getinge |
17.364 |
8/12/24 |
-0.10 |
15.909 |
9.15 |
18.379 |
-2.471 |
-13.44 |
|
-9.98 |
| | |
|
|
|
|
|
Kinnevik |
6.964 |
8/12/24 |
-0.36 |
7.786 |
-10.55 |
9.441 |
-1.655 |
-17.53 |
|
-20.53 |
| | |
|
|
|
|
|
NIBE Industrier |
3.909 |
8/12/24 |
0.18 |
3.959 |
-1.26 |
4.844 |
-0.885 |
-18.27 |
|
-29.59 |
| OMXS 30 - 30 out of 30 instruments rated - 7/01/24 / 3/18/24 - 17 did rise, Market-Ratio(15) in EUR = 56.67 % |
| Stock Exchange Currency: SEK kr Swedish krona |
Technical Chart
Transactions OMX Stockholm 30 in Euro * S15 - 53 ex 3 (1)
|
⇐ |
| |
| L/S | date buy | date sell | days | | instrument | spl | pieces | | prc buy | prc sell | ps short | prc diff | d % | asset | yield | |
| 1/02/06 |
6/05/06 |
154 |
|
- cash - |
| short |
6/05/06 |
8/28/06 |
84 |
|
|
|
Ericsson |
100 |
838 |
|
11.930 |
12.987 |
10.874 |
-1.057 |
-9 |
9,114 |
-33 |
|
| 8/28/06 |
6/04/07 |
280 |
|
- cash - |
| |
6/04/07 |
6/11/07 |
7 |
|
|
|
Essity B |
100 |
887 |
|
10.272 |
9.975 |
10.578 |
0.306 |
3 |
9,385 |
362 |
|
| 6/11/07 |
7/02/07 |
21 |
|
- cash - |
| |
7/02/07 |
7/09/07 |
7 |
|
|
|
Svenska Cellulosa B |
100 |
3,735 |
|
2.512 |
2.598 |
2.427 |
-0.086 |
-3 |
9,065 |
-84 |
|
| 7/09/07 |
7/23/07 |
14 |
|
- cash - |
| |
7/23/07 |
11/19/07 |
119 |
|
|
|
Svenska Cellulosa B |
100 |
3,484 |
|
2.602 |
2.408 |
2.811 |
0.210 |
8 |
9,796 |
27 |
|
| |
11/19/07 |
12/24/07 |
35 |
|
|
|
NIBE Industrier |
100 |
25,671 |
|
0.382 |
0.493 |
0.271 |
-0.111 |
-29 |
6,949 |
-97 |
|
| |
12/24/07 |
4/28/08 |
126 |
|
|
|
Boliden |
100 |
809 |
|
8.580 |
7.031 |
10.470 |
1.890 |
22 |
8,478 |
78 |
|
| 4/28/08 |
6/02/08 |
35 |
|
- cash - |
| |
6/02/08 |
6/23/08 |
21 |
|
|
|
NIBE Industrier |
100 |
28,141 |
|
0.301 |
0.296 |
0.306 |
0.005 |
2 |
8,620 |
33 |
|
| |
6/23/08 |
1/05/09 |
196 |
|
|
|
Boliden |
100 |
1,669 |
|
5.163 |
1.922 |
13.866 |
8.703 |
169 |
23,146 |
530 |
|
| |
1/05/09 |
2/02/09 |
28 |
|
|
|
Swedbank |
100 |
5,663 |
|
4.087 |
2.823 |
5.916 |
1.829 |
45 |
33,503 |
12,309 |
|
| 2/02/09 |
2/16/09 |
14 |
|
- cash - |
| |
2/16/09 |
3/02/09 |
14 |
|
|
|
Swedbank |
100 |
13,495 |
|
2.483 |
1.611 |
3.826 |
1.344 |
54 |
51,638 |
> 999,999 |
|
| 3/02/09 |
3/23/09 |
21 |
|
- cash - |
| |
3/23/09 |
3/30/09 |
7 |
|
|
|
S.E.B |
100 |
21,206 |
|
2.435 |
2.972 |
1.898 |
-0.537 |
-22 |
40,259 |
-100 |
|
| 3/30/09 |
2/01/10 |
308 |
|
- cash - |
| |
2/01/10 |
2/15/10 |
14 |
|
|
|
Ericsson |
100 |
5,731 |
|
7.024 |
7.368 |
6.680 |
-0.344 |
-5 |
38,289 |
-73 |
|
| 2/15/10 |
2/22/10 |
7 |
|
- cash - |
| |
2/22/10 |
3/01/10 |
7 |
|
|
|
AstraZeneca |
100 |
1,199 |
|
31.924 |
33.297 |
30.551 |
-1.373 |
-4 |
36,643 |
-90 |
|
| 3/01/10 |
5/03/10 |
63 |
|
- cash - |
| |
5/03/10 |
5/10/10 |
7 |
|
|
|
Nordea Bank |
100 |
5,858 |
|
6.255 |
6.864 |
5.646 |
-0.609 |
-10 |
33,074 |
-100 |
|
| 5/10/10 |
6/21/10 |
42 |
|
- cash - |
| |
6/21/10 |
7/19/10 |
28 |
|
|
|
NIBE Industrier |
100 |
78,135 |
|
0.423 |
0.405 |
0.442 |
0.019 |
4 |
34,536 |
76 |
|
| 7/19/10 |
7/26/10 |
7 |
|
- cash - |
| |
7/26/10 |
8/02/10 |
7 |
|
|
|
NIBE Industrier |
100 |
79,805 |
|
0.433 |
0.431 |
0.435 |
0.002 |
1 |
34,715 |
31 |
|
| 8/02/10 |
8/09/10 |
7 |
|
- cash - |
| |
8/09/10 |
8/16/10 |
7 |
|
|
|
Electrolux |
100 |
2,142 |
|
16.201 |
15.910 |
16.496 |
0.296 |
2 |
35,349 |
157 |
|
| 8/16/10 |
3/14/11 |
210 |
|
- cash - |
| |
3/14/11 |
3/28/11 |
14 |
|
|
|
AstraZeneca |
100 |
1,077 |
|
32.812 |
32.736 |
32.888 |
0.076 |
0 |
35,431 |
6 |
|
| 3/28/11 |
4/04/11 |
7 |
|
- cash - |
| |
4/04/11 |
5/02/11 |
28 |
|
|
|
AstraZeneca |
100 |
1,053 |
|
33.640 |
35.296 |
31.983 |
-1.657 |
-5 |
33,686 |
-48 |
|
| |
5/02/11 |
5/09/11 |
7 |
|
|
|
Svenska Cellulosa B |
100 |
15,689 |
|
2.147 |
2.169 |
2.125 |
-0.022 |
-1 |
33,340 |
-42 |
|
| 5/09/11 |
5/16/11 |
7 |
|
- cash - |
| |
5/16/11 |
5/30/11 |
14 |
|
|
|
Tele2 |
100 |
2,415 |
|
13.805 |
13.812 |
13.798 |
-0.007 |
0 |
33,323 |
-1 |
|
| 5/30/11 |
6/06/11 |
7 |
|
- cash - |
| |
6/06/11 |
6/20/11 |
14 |
|
|
|
Tele2 |
100 |
2,529 |
|
13.172 |
13.020 |
13.326 |
0.154 |
1 |
33,712 |
35 |
|
| |
6/20/11 |
6/27/11 |
7 |
|
|
|
Telia Company |
100 |
6,940 |
|
4.857 |
5.029 |
4.686 |
-0.171 |
-4 |
32,523 |
-85 |
|
| 6/27/11 |
7/11/11 |
14 |
|
- cash - |
| |
7/11/11 |
7/18/11 |
7 |
|
|
|
Telia Company |
100 |
6,598 |
|
4.929 |
5.231 |
4.626 |
-0.302 |
-6 |
30,527 |
-96 |
|
| |
7/18/11 |
10/24/11 |
98 |
|
|
|
Electrolux |
100 |
2,289 |
|
13.334 |
13.879 |
12.788 |
-0.546 |
-4 |
29,278 |
-14 |
|
| L/S | date buy | date sell | days | | instrument | spl | pieces | | prc buy | prc sell | ps short | prc diff | d % | asset | yield | | | |
10/24/11 |
11/14/11 |
21 |
|
|
|
Hexagon |
100 |
20,270 |
|
1.444 |
1.545 |
1.344 |
-0.101 |
-7 |
27,238 |
-72 |
|
| |
11/14/11 |
11/21/11 |
7 |
|
|
|
Electrolux |
100 |
2,324 |
|
11.717 |
11.597 |
11.838 |
0.121 |
1 |
27,519 |
71 |
|
| |
11/21/11 |
11/28/11 |
7 |
|
|
|
Hexagon |
100 |
20,221 |
|
1.361 |
1.446 |
1.276 |
-0.085 |
-6 |
25,794 |
-97 |
|
| 11/28/11 |
5/07/12 |
161 |
|
- cash - |
| |
5/07/12 |
5/28/12 |
21 |
|
|
|
Ericsson |
100 |
3,672 |
|
7.024 |
7.203 |
6.844 |
-0.180 |
-3 |
25,134 |
-36 |
|
| |
5/28/12 |
7/23/12 |
56 |
|
|
|
Tele2 |
100 |
2,069 |
|
12.147 |
13.315 |
10.978 |
-1.168 |
-10 |
22,717 |
-48 |
|
| 7/23/12 |
6/10/13 |
322 |
|
- cash - |
| |
6/10/13 |
7/08/13 |
28 |
|
|
|
Tele2 |
100 |
2,443 |
|
9.297 |
9.227 |
9.367 |
0.070 |
1 |
22,889 |
10 |
|
| 7/08/13 |
9/02/13 |
56 |
|
- cash - |
| |
9/02/13 |
9/09/13 |
7 |
|
|
|
Tele2 |
100 |
2,350 |
|
9.736 |
9.620 |
9.854 |
0.117 |
1 |
23,165 |
87 |
|
| 9/09/13 |
3/03/14 |
175 |
|
- cash - |
| |
3/03/14 |
3/10/14 |
7 |
|
|
|
Electrolux |
100 |
1,384 |
|
16.727 |
16.611 |
16.843 |
0.117 |
1 |
23,326 |
44 |
|
| 3/10/14 |
8/18/14 |
161 |
|
- cash - |
| |
8/18/14 |
8/25/14 |
7 |
|
|
|
Getinge |
100 |
1,247 |
|
18.700 |
19.905 |
17.495 |
-1.205 |
-6 |
21,823 |
-97 |
|
| 8/25/14 |
9/15/14 |
21 |
|
- cash - |
| |
9/15/14 |
9/29/14 |
14 |
|
|
|
Volvo |
100 |
2,482 |
|
8.791 |
8.496 |
9.097 |
0.306 |
3 |
22,582 |
144 |
|
| 9/29/14 |
10/06/14 |
7 |
|
- cash - |
| |
10/06/14 |
10/27/14 |
21 |
|
|
|
Volvo |
100 |
2,716 |
|
8.312 |
8.865 |
7.759 |
-0.553 |
-7 |
21,080 |
-70 |
|
| |
10/27/14 |
11/03/14 |
7 |
|
|
|
Getinge |
100 |
1,202 |
|
17.536 |
18.526 |
16.545 |
-0.990 |
-6 |
19,890 |
-95 |
|
| 11/03/14 |
6/08/15 |
217 |
|
- cash - |
| |
6/08/15 |
7/27/15 |
49 |
|
|
|
Telia Company |
100 |
3,782 |
|
5.259 |
5.474 |
5.044 |
-0.215 |
-4 |
19,077 |
-27 |
|
| |
7/27/15 |
9/28/15 |
63 |
|
|
|
Tele2 |
100 |
2,034 |
|
9.379 |
8.214 |
10.709 |
1.330 |
14 |
21,783 |
116 |
|
| |
9/28/15 |
10/05/15 |
7 |
|
|
|
Sandvik |
100 |
3,050 |
|
7.142 |
8.200 |
6.084 |
-1.058 |
-15 |
18,555 |
-100 |
|
| |
10/05/15 |
10/26/15 |
21 |
|
|
|
Tele2 |
100 |
2,182 |
|
8.500 |
9.097 |
7.903 |
-0.597 |
-7 |
17,252 |
-72 |
|
| |
10/26/15 |
11/30/15 |
35 |
|
|
|
SKF B |
100 |
1,061 |
|
16.259 |
16.501 |
16.018 |
-0.242 |
-1 |
16,996 |
-14 |
|
| 11/30/15 |
12/14/15 |
14 |
|
- cash - |
| |
12/14/15 |
12/28/15 |
14 |
|
|
|
SKF B |
100 |
1,160 |
|
14.642 |
15.040 |
14.244 |
-0.398 |
-3 |
16,534 |
-51 |
|
| 12/28/15 |
1/04/16 |
7 |
|
- cash - |
| |
1/04/16 |
2/08/16 |
35 |
|
|
|
SKF B |
100 |
1,130 |
|
14.629 |
14.751 |
14.507 |
-0.122 |
-1 |
16,396 |
-8 |
|
| |
2/08/16 |
3/14/16 |
35 |
|
|
|
Tele2 |
100 |
2,278 |
|
7.196 |
8.322 |
6.070 |
-1.126 |
-16 |
13,831 |
-83 |
|
| |
3/14/16 |
3/21/16 |
7 |
|
|
|
SKF B |
100 |
898 |
|
15.397 |
15.407 |
15.388 |
-0.010 |
0 |
13,822 |
-3 |
|
| |
3/21/16 |
4/25/16 |
35 |
|
|
|
Nordea Bank |
100 |
1,568 |
|
8.811 |
8.653 |
8.973 |
0.162 |
2 |
14,075 |
21 |
|
| 4/25/16 |
6/13/16 |
49 |
|
- cash - |
| |
6/13/16 |
7/11/16 |
28 |
|
|
|
Ericsson |
100 |
2,144 |
|
6.565 |
6.961 |
6.169 |
-0.396 |
-6 |
13,226 |
-56 |
|
| 7/11/16 |
11/07/16 |
119 |
|
- cash - |
| |
11/07/16 |
11/21/16 |
14 |
|
|
|
Ericsson |
100 |
3,000 |
|
4.407 |
4.862 |
3.953 |
-0.454 |
-10 |
11,863 |
-94 |
|
| 11/21/16 |
11/28/16 |
7 |
|
- cash - |
| |
11/28/16 |
12/05/16 |
7 |
|
|
|
Ericsson |
100 |
2,440 |
|
4.862 |
5.079 |
4.644 |
-0.218 |
-4 |
11,332 |
-91 |
|
| L/S | date buy | date sell | days | | instrument | spl | pieces | | prc buy | prc sell | ps short | prc diff | d % | asset | yield | |
| 12/05/16 |
7/31/17 |
238 |
|
- cash - |
| |
7/31/17 |
9/04/17 |
35 |
|
|
|
SBB |
100 |
18,073 |
|
0.627 |
0.696 |
0.558 |
-0.069 |
-11 |
10,089 |
-70 |
|
| |
9/04/17 |
10/09/17 |
35 |
|
|
|
Ericsson |
100 |
2,064 |
|
4.887 |
4.893 |
4.880 |
-0.007 |
0 |
10,075 |
-1 |
|
| 10/09/17 |
2/05/18 |
119 |
|
- cash - |
| |
2/05/18 |
4/16/18 |
70 |
|
|
|
Sinch |
100 |
15,257 |
|
0.660 |
0.587 |
0.743 |
0.082 |
12 |
11,329 |
84 |
|
| 4/16/18 |
4/23/18 |
7 |
|
- cash - |
| |
4/23/18 |
5/21/18 |
28 |
|
|
|
Getinge |
100 |
1,230 |
|
9.208 |
8.456 |
10.026 |
0.818 |
9 |
12,335 |
203 |
|
| 5/21/18 |
6/25/18 |
35 |
|
- cash - |
| |
6/25/18 |
7/09/18 |
14 |
|
|
|
Getinge |
100 |
1,574 |
|
7.832 |
8.181 |
7.484 |
-0.349 |
-4 |
11,787 |
-69 |
|
| 7/09/18 |
10/15/18 |
98 |
|
- cash - |
| |
10/15/18 |
10/22/18 |
7 |
|
|
|
Getinge |
100 |
1,627 |
|
7.243 |
8.287 |
6.198 |
-1.044 |
-14 |
10,087 |
-100 |
|
| |
10/22/18 |
11/05/18 |
14 |
|
|
|
Electrolux |
100 |
581 |
|
17.350 |
19.031 |
15.669 |
-1.681 |
-10 |
9,111 |
-93 |
|
| |
11/05/18 |
2/04/19 |
91 |
|
|
|
Boliden |
100 |
445 |
|
20.449 |
21.765 |
19.133 |
-1.316 |
-6 |
8,525 |
-23 |
|
| |
2/04/19 |
2/11/19 |
7 |
|
|
|
Kinnevik |
100 |
402 |
|
21.160 |
20.765 |
21.562 |
0.402 |
2 |
8,687 |
167 |
|
| 2/11/19 |
6/03/19 |
112 |
|
- cash - |
| |
6/03/19 |
6/10/19 |
7 |
|
|
|
Swedbank |
100 |
682 |
|
12.722 |
13.328 |
12.117 |
-0.605 |
-5 |
8,274 |
-92 |
|
| 6/10/19 |
7/29/19 |
49 |
|
- cash - |
| |
7/29/19 |
9/02/19 |
35 |
|
|
|
Swedbank |
100 |
654 |
|
12.646 |
11.389 |
14.043 |
1.396 |
11 |
9,187 |
198 |
|
| 9/02/19 |
10/07/19 |
35 |
|
- cash - |
| |
10/07/19 |
10/14/19 |
7 |
|
|
|
Swedbank |
100 |
736 |
|
12.482 |
12.886 |
12.078 |
-0.404 |
-3 |
8,890 |
-82 |
|
| 10/14/19 |
3/02/20 |
140 |
|
- cash - |
| |
3/02/20 |
4/06/20 |
35 |
|
|
|
Kinnevik |
100 |
475 |
|
18.702 |
15.956 |
21.919 |
3.217 |
17 |
10,418 |
424 |
|
| |
4/06/20 |
6/22/20 |
77 |
|
|
|
Electrolux |
100 |
964 |
|
10.796 |
14.678 |
6.915 |
-3.882 |
-36 |
6,676 |
-88 |
|
| 6/22/20 |
10/26/20 |
126 |
|
- cash - |
| |
10/26/20 |
11/09/20 |
14 |
|
|
|
Tele2 |
100 |
633 |
|
10.534 |
10.692 |
10.375 |
-0.159 |
-2 |
6,576 |
-33 |
|
| 11/09/20 |
9/27/21 |
322 |
|
- cash - |
| |
9/27/21 |
11/01/21 |
35 |
|
|
|
Kinnevik |
100 |
212 |
|
30.964 |
34.201 |
27.728 |
-3.237 |
-10 |
5,890 |
-68 |
|
| |
11/01/21 |
11/08/21 |
7 |
|
|
|
Ericsson |
100 |
623 |
|
9.439 |
9.598 |
9.281 |
-0.158 |
-2 |
5,791 |
-59 |
|
| |
11/08/21 |
12/27/21 |
49 |
|
|
|
Sinch |
100 |
465 |
|
12.430 |
11.167 |
13.835 |
1.405 |
11 |
6,444 |
122 |
|
| 12/27/21 |
1/24/22 |
28 |
|
- cash - |
| |
1/24/22 |
1/31/22 |
7 |
|
|
|
Sinch |
100 |
779 |
|
8.271 |
8.992 |
7.550 |
-0.721 |
-9 |
5,883 |
-99 |
|
| 1/31/22 |
2/07/22 |
7 |
|
- cash - |
| |
2/07/22 |
8/22/22 |
196 |
|
|
|
Sinch |
100 |
637 |
|
9.234 |
1.863 |
45.760 |
36.525 |
396 |
29,149 |
1,870 |
|
| 8/22/22 |
8/29/22 |
7 |
|
- cash - |
| |
8/29/22 |
10/31/22 |
63 |
|
|
|
Sinch |
100 |
16,114 |
|
1.809 |
2.382 |
1.236 |
-0.573 |
-32 |
19,919 |
-89 |
|
| 10/31/22 |
11/07/22 |
7 |
|
- cash - |
| |
11/07/22 |
11/14/22 |
7 |
|
|
|
SBB |
100 |
12,949 |
|
1.538 |
1.711 |
1.366 |
-0.172 |
-11 |
17,686 |
-100 |
|
| 11/14/22 |
3/20/23 |
126 |
|
- cash - |
| |
3/20/23 |
3/27/23 |
7 |
|
|
|
SBB |
100 |
14,093 |
|
1.255 |
1.197 |
1.316 |
0.061 |
5 |
18,545 |
1,085 |
|
| 3/27/23 |
5/01/23 |
35 |
|
- cash - |
| |
5/01/23 |
5/08/23 |
7 |
|
|
|
SBB |
100 |
17,472 |
|
1.061 |
0.752 |
1.497 |
0.436 |
41 |
26,157 |
> 999,999 |
|
| 5/08/23 |
5/22/23 |
14 |
|
- cash - |
| |
5/22/23 |
7/03/23 |
42 |
|
|
|
SBB |
100 |
50,643 |
|
0.516 |
0.350 |
0.762 |
0.245 |
48 |
38,585 |
2,833 |
|
| L/S | date buy | date sell | days | | instrument | spl | pieces | | prc buy | prc sell | ps short | prc diff | d % | asset | yield | |
| 7/03/23 |
7/17/23 |
14 |
|
- cash - |
| |
7/17/23 |
7/24/23 |
7 |
|
|
|
SBB |
100 |
83,155 |
|
0.464 |
0.414 |
0.520 |
0.056 |
12 |
43,249 |
38,273 |
|
| 7/24/23 |
7/31/23 |
7 |
|
- cash - |
| |
7/31/23 |
11/27/23 |
119 |
|
|
|
SBB |
100 |
110,007 |
|
0.393 |
0.337 |
0.458 |
0.065 |
17 |
50,427 |
60 |
|
| 11/27/23 |
6/20/26 |
936 |
|
- cash - |
| accum | 6/05/06 |
11/27/23 | 2478 |
days out of 7474 invested (33%) |
404 |
50,427 |
27 |
|
Instrument Related Contribution
| instrument | L/S | date buy | date sell | days | prc buy | prc sell | ps short | prc diff | d % | | | total |
| Sinch | short | 2/05/18 | 4/16/18 | 70 | 0.66 | 0.59 | 0.74 | 0.08 | 12.45 | | | |
| | | 11/08/21 | 12/27/21 | 49 | 12.43 | 11.17 | 13.84 | 1.41 | 11.31 | | | |
| | | 1/24/22 | 1/31/22 | 7 | 8.27 | 8.99 | 7.55 | -0.72 | -8.72 | | | |
| | | 2/07/22 | 8/22/22 | 196 | 9.23 | 1.86 | 45.76 | 36.53 | 395.55 | | | |
| | | 8/29/22 | 10/31/22 | 63 | 1.81 | 2.38 | 1.24 | -0.57 | -31.67 | | | 286.87 |
| Boliden | | 12/24/07 | 4/28/08 | 126 | 8.58 | 7.03 | 10.47 | 1.89 | 22.03 | | | |
| | | 6/23/08 | 1/05/09 | 196 | 5.16 | 1.92 | 13.87 | 8.70 | 168.58 | | | |
| | | 11/05/18 | 2/04/19 | 91 | 20.45 | 21.76 | 19.13 | -1.32 | -6.44 | | | 206.66 |
| Swedbank | | 1/05/09 | 2/02/09 | 28 | 4.09 | 2.82 | 5.92 | 1.83 | 44.75 | | | |
| | | 2/16/09 | 3/02/09 | 14 | 2.48 | 1.61 | 3.83 | 1.34 | 54.13 | | | |
| | | 6/03/19 | 6/10/19 | 7 | 12.72 | 13.33 | 12.12 | -0.61 | -4.76 | | | |
| | | 7/29/19 | 9/02/19 | 35 | 12.65 | 11.39 | 14.04 | 1.40 | 11.04 | | | |
| | | 10/07/19 | 10/14/19 | 7 | 12.48 | 12.89 | 12.08 | -0.40 | -3.24 | | | 128.31 |
| SBB | | 7/31/17 | 9/04/17 | 35 | 0.63 | 0.70 | 0.56 | -0.07 | -10.97 | | | |
| | | 11/07/22 | 11/14/22 | 7 | 1.54 | 1.71 | 1.37 | -0.17 | -11.21 | | | |
| | | 3/20/23 | 3/27/23 | 7 | 1.25 | 1.20 | 1.32 | 0.06 | 4.86 | | | |
| | | 5/01/23 | 5/08/23 | 7 | 1.06 | 0.75 | 1.50 | 0.44 | 41.05 | | | |
| | | 5/22/23 | 7/03/23 | 42 | 0.52 | 0.35 | 0.76 | 0.25 | 47.52 | | | |
| | | 7/17/23 | 7/24/23 | 7 | 0.46 | 0.41 | 0.52 | 0.06 | 12.09 | | | |
| | | 7/31/23 | 11/27/23 | 119 | 0.39 | 0.34 | 0.46 | 0.07 | 16.60 | | | 125.40 |
| Kinnevik | | 2/04/19 | 2/11/19 | 7 | 21.16 | 20.77 | 21.56 | 0.40 | 1.90 | | | |
| | | 3/02/20 | 4/06/20 | 35 | 18.70 | 15.96 | 21.92 | 3.22 | 17.20 | | | |
| | | 9/27/21 | 11/01/21 | 35 | 30.96 | 34.20 | 27.73 | -3.24 | -10.45 | | | 6.95 |
| Svenska Cellulosa B | | 7/02/07 | 7/09/07 | 7 | 2.51 | 2.60 | 2.43 | -0.09 | -3.41 | | | |
| | | 7/23/07 | 11/19/07 | 119 | 2.60 | 2.41 | 2.81 | 0.21 | 8.06 | | | |
| | | 5/02/11 | 5/09/11 | 7 | 2.15 | 2.17 | 2.13 | -0.02 | -1.03 | | | 3.30 |
| instrument | L/S | date buy | date sell | days | prc buy | prc sell | ps short | prc diff | d % | | | total |
| Essity B | | 6/04/07 | 6/11/07 | 7 | 10.27 | 9.97 | 10.58 | 0.31 | 2.98 | | | 2.98 |
| Volvo | | 9/15/14 | 9/29/14 | 14 | 8.79 | 8.50 | 9.10 | 0.31 | 3.48 | | | |
| | | 10/06/14 | 10/27/14 | 21 | 8.31 | 8.86 | 7.76 | -0.55 | -6.65 | | | -3.41 |
| SKF B | | 10/26/15 | 11/30/15 | 35 | 16.26 | 16.50 | 16.02 | -0.24 | -1.49 | | | |
| | | 12/14/15 | 12/28/15 | 14 | 14.64 | 15.04 | 14.24 | -0.40 | -2.72 | | | |
| | | 1/04/16 | 2/08/16 | 35 | 14.63 | 14.75 | 14.51 | -0.12 | -0.83 | | | |
| | | 3/14/16 | 3/21/16 | 7 | 15.40 | 15.41 | 15.39 | -0.01 | -0.06 | | | -5.03 |
| Nordea Bank | | 5/03/10 | 5/10/10 | 7 | 6.25 | 6.86 | 5.65 | -0.61 | -9.74 | | | |
| | | 3/21/16 | 4/25/16 | 35 | 8.81 | 8.65 | 8.97 | 0.16 | 1.83 | | | -8.08 |
| AstraZeneca | | 2/22/10 | 3/01/10 | 7 | 31.92 | 33.30 | 30.55 | -1.37 | -4.30 | | | |
| | | 3/14/11 | 3/28/11 | 14 | 32.81 | 32.74 | 32.89 | 0.08 | 0.23 | | | |
| | | 4/04/11 | 5/02/11 | 28 | 33.64 | 35.30 | 31.98 | -1.66 | -4.92 | | | -8.80 |
| Hexagon | | 10/24/11 | 11/14/11 | 21 | 1.44 | 1.55 | 1.34 | -0.10 | -6.97 | | | |
| | | 11/21/11 | 11/28/11 | 7 | 1.36 | 1.45 | 1.28 | -0.09 | -6.27 | | | -12.80 |
| Telia Company | | 6/20/11 | 6/27/11 | 7 | 4.86 | 5.03 | 4.69 | -0.17 | -3.53 | | | |
| | | 7/11/11 | 7/18/11 | 7 | 4.93 | 5.23 | 4.63 | -0.30 | -6.14 | | | |
| | | 6/08/15 | 7/27/15 | 49 | 5.26 | 5.47 | 5.04 | -0.21 | -4.09 | | | -13.15 |
| Sandvik | | 9/28/15 | 10/05/15 | 7 | 7.14 | 8.20 | 6.08 | -1.06 | -14.82 | | | -14.82 |
| Tele2 | | 5/16/11 | 5/30/11 | 14 | 13.80 | 13.81 | 13.80 | -0.01 | -0.05 | | | |
| | | 6/06/11 | 6/20/11 | 14 | 13.17 | 13.02 | 13.33 | 0.15 | 1.17 | | | |
| | | 5/28/12 | 7/23/12 | 56 | 12.15 | 13.31 | 10.98 | -1.17 | -9.62 | | | |
| | | 6/10/13 | 7/08/13 | 28 | 9.30 | 9.23 | 9.37 | 0.07 | 0.76 | | | |
| | | 9/02/13 | 9/09/13 | 7 | 9.74 | 9.62 | 9.85 | 0.12 | 1.21 | | | |
| | | 7/27/15 | 9/28/15 | 63 | 9.38 | 8.21 | 10.71 | 1.33 | 14.18 | | | |
| | | 10/05/15 | 10/26/15 | 21 | 8.50 | 9.10 | 7.90 | -0.60 | -7.02 | | | |
| | | 2/08/16 | 3/14/16 | 35 | 7.20 | 8.32 | 6.07 | -1.13 | -15.65 | | | |
| | | 10/26/20 | 11/09/20 | 14 | 10.53 | 10.69 | 10.38 | -0.16 | -1.51 | | | -17.81 |
| instrument | L/S | date buy | date sell | days | prc buy | prc sell | ps short | prc diff | d % | | | total |
| Getinge | | 8/18/14 | 8/25/14 | 7 | 18.70 | 19.91 | 17.50 | -1.21 | -6.44 | | | |
| | | 10/27/14 | 11/03/14 | 7 | 17.54 | 18.53 | 16.55 | -0.99 | -5.65 | | | |
| | | 4/23/18 | 5/21/18 | 28 | 9.21 | 8.46 | 10.03 | 0.82 | 8.89 | | | |
| | | 6/25/18 | 7/09/18 | 14 | 7.83 | 8.18 | 7.48 | -0.35 | -4.45 | | | |
| | | 10/15/18 | 10/22/18 | 7 | 7.24 | 8.29 | 6.20 | -1.04 | -14.42 | | | -21.40 |
| S.E.B | | 3/23/09 | 3/30/09 | 7 | 2.43 | 2.97 | 1.90 | -0.54 | -22.04 | | | -22.04 |
| NIBE Industrier | | 11/19/07 | 12/24/07 | 35 | 0.38 | 0.49 | 0.27 | -0.11 | -29.06 | | | |
| | | 6/02/08 | 6/23/08 | 21 | 0.30 | 0.30 | 0.31 | 0.01 | 1.67 | | | |
| | | 6/21/10 | 7/19/10 | 28 | 0.42 | 0.41 | 0.44 | 0.02 | 4.42 | | | |
| | | 7/26/10 | 8/02/10 | 7 | 0.43 | 0.43 | 0.44 | 0.00 | 0.52 | | | -24.30 |
| Ericsson | | 6/05/06 | 8/28/06 | 84 | 11.93 | 12.99 | 10.87 | -1.06 | -8.86 | | | |
| | | 2/01/10 | 2/15/10 | 14 | 7.02 | 7.37 | 6.68 | -0.34 | -4.89 | | | |
| | | 5/07/12 | 5/28/12 | 21 | 7.02 | 7.20 | 6.84 | -0.18 | -2.56 | | | |
| | | 6/13/16 | 7/11/16 | 28 | 6.56 | 6.96 | 6.17 | -0.40 | -6.03 | | | |
| | | 11/07/16 | 11/21/16 | 14 | 4.41 | 4.86 | 3.95 | -0.45 | -10.31 | | | |
| | | 11/28/16 | 12/05/16 | 7 | 4.86 | 5.08 | 4.64 | -0.22 | -4.48 | | | |
| | | 9/04/17 | 10/09/17 | 35 | 4.89 | 4.89 | 4.88 | -0.01 | -0.14 | | | |
| | | 11/01/21 | 11/08/21 | 7 | 9.44 | 9.60 | 9.28 | -0.16 | -1.68 | | | -33.24 |
| Electrolux | | 8/09/10 | 8/16/10 | 7 | 16.20 | 15.91 | 16.50 | 0.30 | 1.83 | | | |
| | | 7/18/11 | 10/24/11 | 98 | 13.33 | 13.88 | 12.79 | -0.55 | -4.09 | | | |
| | | 11/14/11 | 11/21/11 | 7 | 11.72 | 11.60 | 11.84 | 0.12 | 1.03 | | | |
| | | 3/03/14 | 3/10/14 | 7 | 16.73 | 16.61 | 16.84 | 0.12 | 0.70 | | | |
| | | 10/22/18 | 11/05/18 | 14 | 17.35 | 19.03 | 15.67 | -1.68 | -9.69 | | | |
| | | 4/06/20 | 6/22/20 | 77 | 10.80 | 14.68 | 6.91 | -3.88 | -35.95 | | | -42.53 |
Annotations
| 5/13/22 | Atlas Copco B | | | splits 1:4 (four for one) |
| | Atlas Copco A | | | splits 1:4 (four for one) |
| 5/19/21 | Hexagon | | | stock split 1:7 (seven for one) |
| | Investor | | | stock split 1:4 (four for one) |
| 7/26/18 | OMXS 30 | | | Hexagon replaces Fingerprint Cards |
| 6/29/18 | Autoliv | | | spin-off of Veoneer |
| 6/19/18 | Atlas Copco A | | | spin-off Epiroc |
| 1/02/18 | OMXS 30 | | | Lundin drops out as a consequence of the SCA Essity split |
| 1/02/17 | OMXS 30 | | | Autoliv replaces Nokia |
| 1/04/16 | OMXS 30 | | | Fingerprint Cards replaces MTG |
| 9/10/15 | OMXS 30 | | | complete analysis |
| | OMXS 30 | | | complete analysis |
| 6/03/15 | Assa Abloy | | | ex split 1:3 (three for one) |
| 5/19/15 | Svenska Handelsbank | | | ex Split 1:3 (three for one) |
|
|